statsd-grapher
Version:
A statsd backend that serves an http page with the graphical data
66 lines (37 loc) • 3.1 kB
Markdown
# statsd-grapher
[](https://travis-ci.org/Risto-Stevcev/statsd-grapher)
[](https://coveralls.io/github/Risto-Stevcev/statsd-grapher?branch=master)
:chart_with_upwards_trend: A statsd backend that serves an http page with the graphical data. This is an alternative to using graphite, and can simply be hosted
on a free Heroku instance.
View the [annotated source](http://risto-stevcev.github.io/statsd-grapher/docs/utils.html)
# Quick use
1. Install and set up statsd-grapher
```bash
$ npm install statsd statsd-grapher --save
$ cp node_modules/statsd-grapher/exampleConfig.js .
$ ./node_modules/.bin/statsd exampleConfig.js
```
2. Send some data to your statsd instance
3. Go to your statsd http server to view the graph. The default would be `localhost:3000/stats`
# Configuration
## Options
`tokens` ([String]) - An array of tokens used to authenticate access to the graph. Makes it so that the data can only be accessed by an authenticated user (recommended)
`expressPort` (Integer) - The port on which the backend http server should run (default: `3000`)
`sessionStore` (Object) - The session store object that will be passed into the `store` option for `express-session` (default: `MemoryStore`)
`sessionSecret` (String) - The session secret (default: `uuid.v4()`)
`sessionExpires` (Integer) - The session expiration time in milliseconds (default: `3600000`)
## Urls
`http(s)://hostname:port/stats` - Views all stats. This page may be slow to load if you have a lot of metrics.
`http(s)://hostname:port/stats/:namespace/:metric` - Views stats from a particular `namespace` and `metric`. If `metric` is set to `all`, then all metrics will be returned for that namespace. Ex: */stats/some.name.space/timers*
`http(s)://hostname:port/metrics/:type/:name` - Returns a `JSON` representation of the metric. Ex: */metrics/counter_rates/some.complete.name.space*
Note: If you set `tokens` in your statsd configuration file, then you need to authenticate your session by appending the token as query parameter like this: `/stats?token=your_token_value`. The default session expiration time is 1 hour.
# Graphing
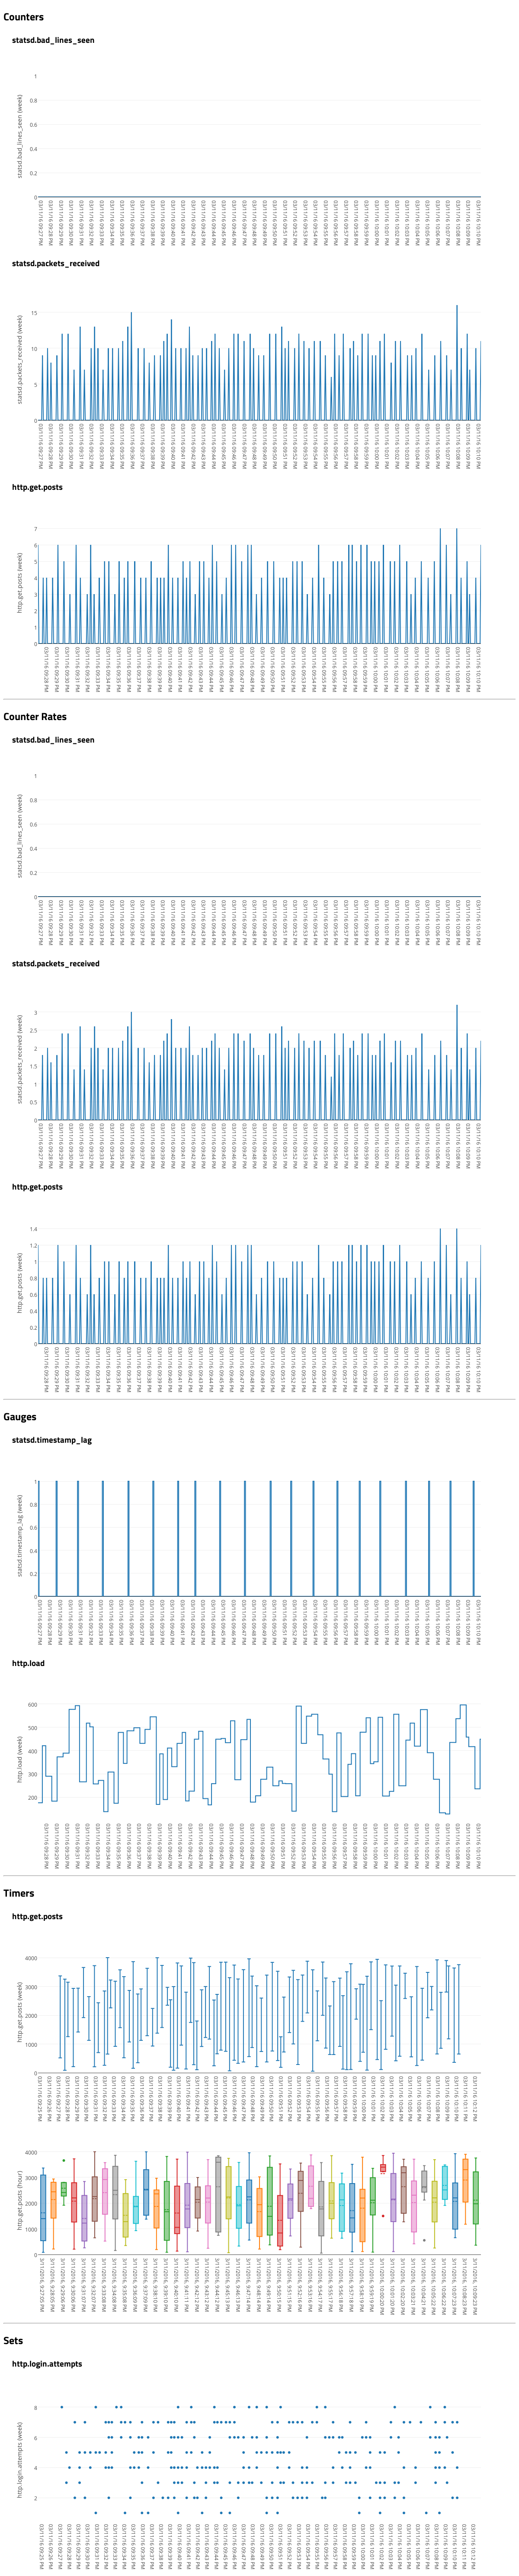
The library currently uses `plotly` to graph the stats. It can often lag when handling large data sets, though I consider this to be a reasonable trade-off due to its robust set of features.
# Example Graph
[](http://risto-stevcev.github.io/statsd-grapher/graph.png)
# Contributors
- Submit an issue citing the feature request first before submitting a PR
- PRs offering different graphing libraries are encouraged :deciduous_tree:
- Follow the coding style. Use `ramda`/`sanctuary` to write small generic functions with corresponding `mocha` tests. The functions should be composed in a `point-free` style whenever possible/practical for the DSL
# License
Licensed under the MIT license