specificity-graph
Version:
Generate an interactive Specificity Graph for your CSS.
74 lines (58 loc) • 3.26 kB
Markdown
# Specificity Graph (for CSS)
[](http://badge.fury.io/js/specificity-graph)
[](https://travis-ci.org/pocketjoso/specificity-graph)
Idea by [Harry Roberts](http://csswizardry.com/2014/10/the-specificity-graph/)
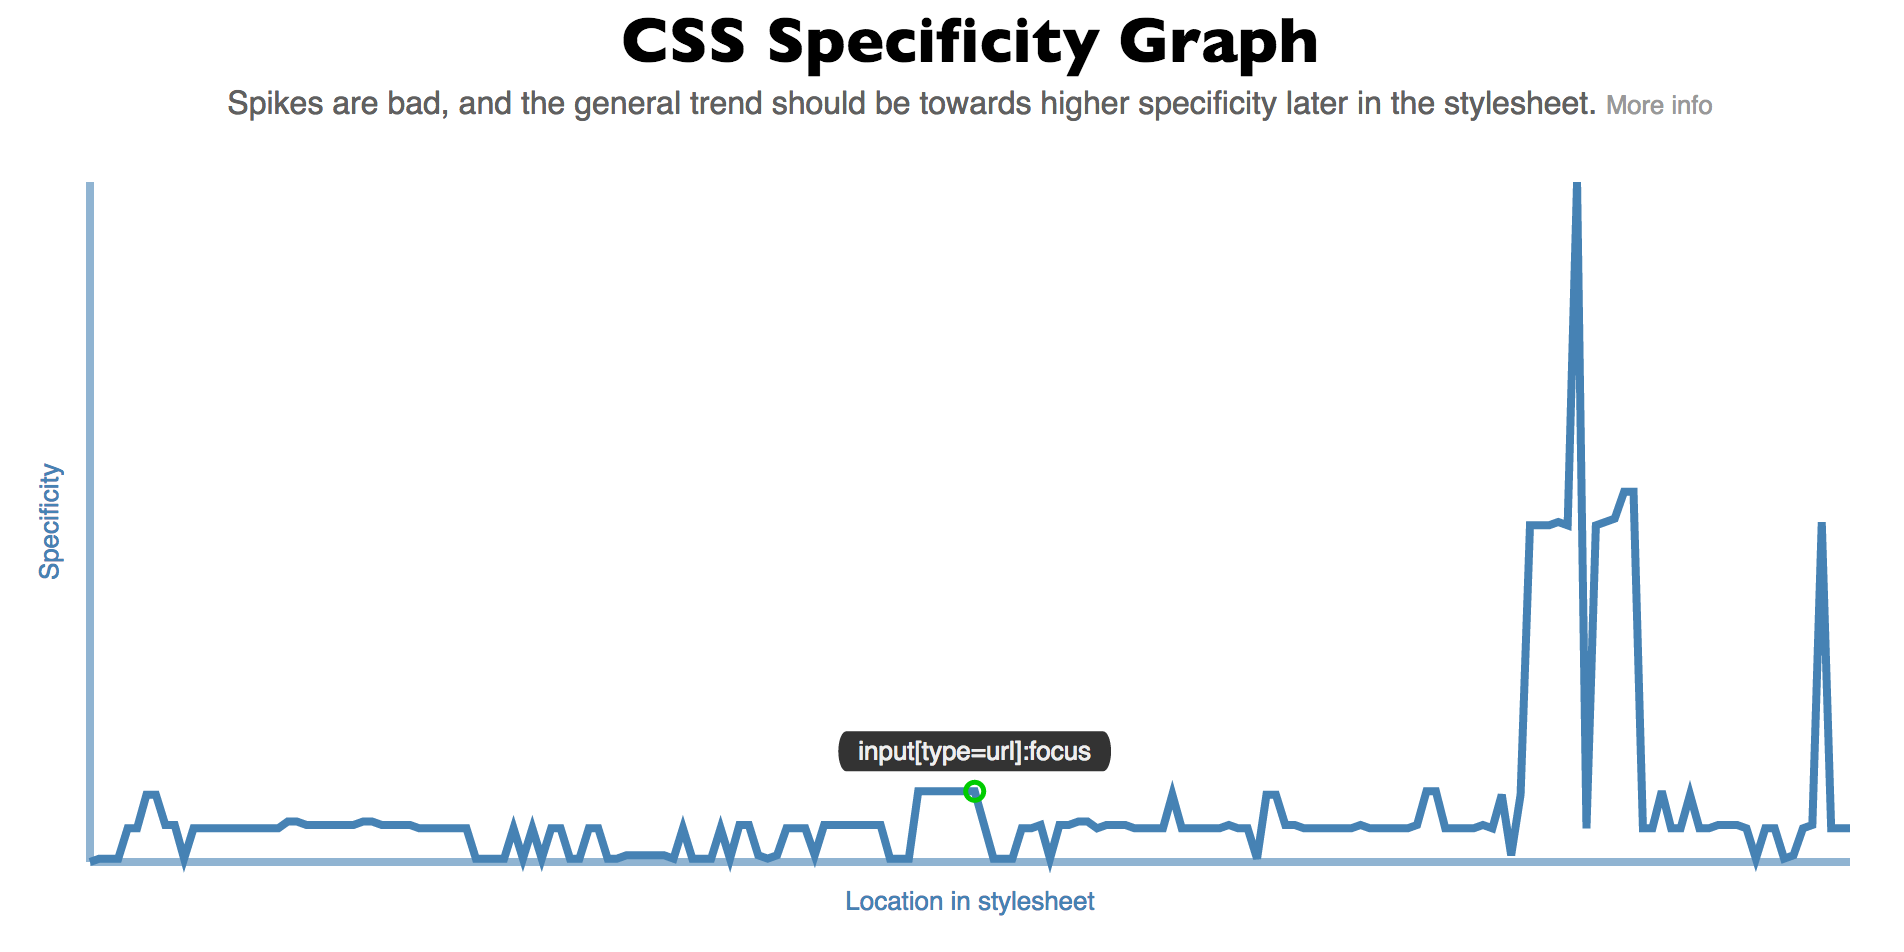
Generate an interactive line graph showing the specificity in your stylesheet. Uses [d3](https://github.com/mbostock/d3), [css-parser](https://github.com/reworkcss/css-parse), and [specificity](https://github.com/keeganstreet/specificity).
## Installation
`npm install specificity-graph`
## Usage
`specifity-graph` can be used in different ways:
* [CLI](#cli)
* [Node module](#node-module)
* [Via JavaScript](#via-javascript)
* [Online](http://jonassebastianohlsson.com/specificity-graph/)
### CLI
`specificity-graph <cssFile> [options]`
Creates a directory containing
* `json` file with specificity data for your CSS
* `html` file with interactive specificity graph for CSS
* necessary JS files to run graph
#### Options
| Flag | Description
| ---------------- | ------------- |
| -o --output | name for generated directory (default: `specificity-graph`) |
| -b --browser | auto launch browser to view generated chart |
| -h --help | Help |
### Node module
```
var specificityGraph = require('specificity-graph');
specificityGraph(directory, css, function(directory){
console.log('specificity-graph files created in ' + directory);
});
```
### Via JavaScript
First get the `specificityGraph` accessible in your code:
#### Using Browserify (or similar)
Just `require('specificity-graph')`.
#### Standalone (no module loader)
Add `<script src="specificity-graph-standalone.js"></script>`,
this will expose `specificityGraph` as a global variable.
#### Methods
* `specificityGraph.create(css, options)`
* `specificityGraph.createFromData(specificityData, options)`,
* `specificityGraph.update(css)`
##### Options
| Name | Description
| ---------------- | ------------- |
| css | String with css to generate specificity graph for |
| specificityData | JSON object with css specificity data. [CLI](#CLI) write a JSON in this format, as does the `lib/lineChart`'s create function' |
###### Create options
| Create option name | Description
| -------------------- | ------------- |
| svgSelector | Selector for `svg` element to draw specificity graph inside. Defaults to `.js-graph`. |
| width | default `1000`. You should set a viewBox value on the SVG element to match `width` and `height`, f.e. `viewbox='0 0 1000 4000'`. |
| height | default `400` |
| showTicks | `Boolean`. Show scale and ticks. Default `false`. |
| xProp | (possible values: `'selectorIndex'`, `'line'`). What to base the x dimension, 'location in stylesheet' in graph on: index of selector in CSS, or line number for selector in CSS. Default `'selectorIndex'`. |
| yProp | default `'specificity'` |