sense-calendar-heatmap
Version:
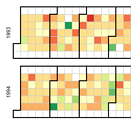
Qlik Sense Visualization Extension with a diverging color scale. The values are displayed as colored cells per day. Days are arranged into columns by week, then grouped by month and years.
11.8 kB
image/png
Qlik Sense Visualization Extension with a diverging color scale. The values are displayed as colored cells per day. Days are arranged into columns by week, then grouped by month and years.