safety-results-over-time
Version:
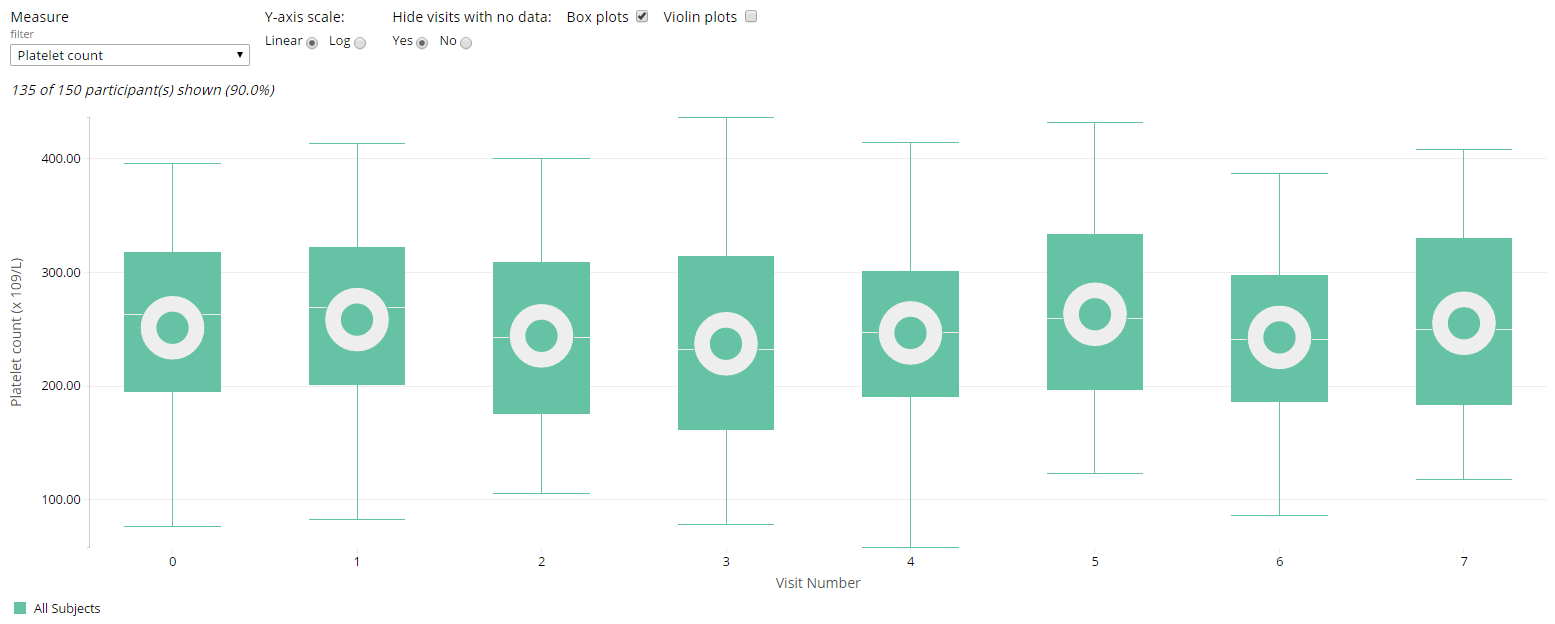
Chart showing population averages for lab measures, vital signs and other related measures during the course of a clinical trial.
84 lines (69 loc) • 3.85 kB
Markdown
# Safety Results Over Time
## Overview
Safety Results Over Time is a JavaScript library built using Webcharts ([1](https://github.com/RhoInc/Webcharts), [2](https://github.com/RhoInc/webcharts-wrapper-boilerplate)) that allows users to view summaries of clinical outcomes such as lab results and vital signs over time. A typical chart created with safety results over time looks like the chart pictured above.
Users can specify grouping variables and overlay violin plots:
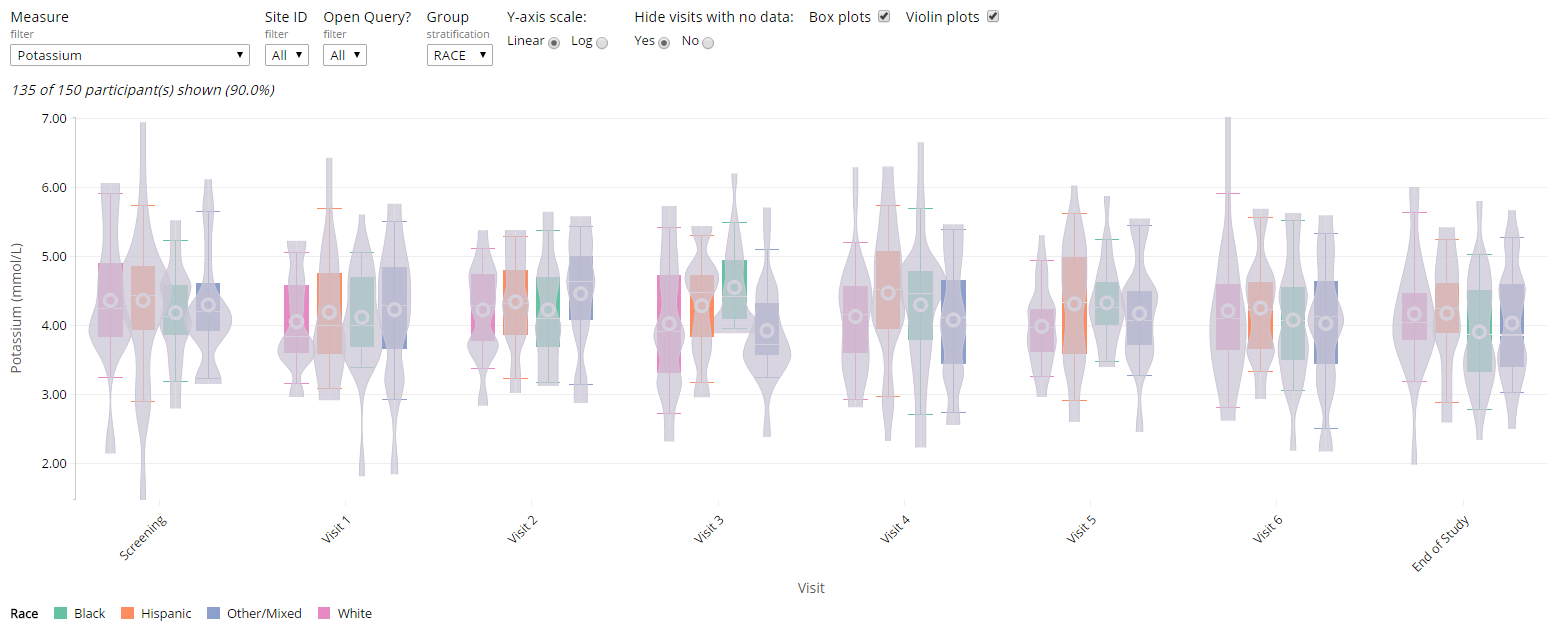
Users can view any outcome in the data and stratify that outcome by sex or treatment, for example; the full functionality is described [here](https://github.com/RhoInc/safety-results-over-time/wiki/Technical-Documentation).
The library expects an [ADaM-esque data structure](https://www.cdisc.org/system/files/members/standard/foundational/adam/analysis_data_model_v2.1.pdf) by default but can be customized to use any dataset that is one row per participant per timepoint per measure.
Full details about chart configuration are [here](https://github.com/RhoInc/safety-results-over-time/wiki/Configuration).
Users can interact with the display in real time to:
* See the chart compare lab and vital sign values at different time points
* See the number and percentage of participants displayed in the current view (updates with each user interaction)
* Change the measure of interest, and see an updated chart
* Hide visits that do not include data
* View box plots within the chart
* Remove box plots from the chart
* View violin plots in the chart
* Remove violin plots in the chart
* Filter the shift plot for selected criteria, and see an updated chart (optional)
## Typical Usage
The code to initialize the chart looks like this:
```javascript
d3.csv(
'https://rawgit.com/RhoInc/viz-library/master/data/safetyData/ADBDS.csv',
function(data) {
safetyResultsOverTime('body', {}).init(data);
}
);
```
The chart can be configured to facilitate non-standard data formats and to alter the chart itself. Overwrite the defaults with a custom settings object like so:
```javascript
const settings = {
time_settings: {
value_col: 'AVISIT',
type: 'ordinal',
label: 'Visit',
rotate_tick_labels: true,
vertical_space: 100
},
measure_col: 'PARAM',
value_col: 'AVAL',
normal_col_low: 'ANRLO',
normal_col_high: 'ANRHI',
groups: [
{value_col: 'TRT01P', label: 'Treatment Group'},
{value_col: 'SEX', label: 'Sex'},
{value_col: 'RACE', label: 'Race'}],
],
filters: [
{value_col: 'TRT01P', label: 'Treatment Group'},
{value_col: 'SEX', label: 'Sex'},
{value_col: 'RACE', label: 'Race'}
],
violins: true
};
d3.csv(
'ADBDS.csv',
function(data) {
safetyResultsOverTime('body', settings).init(data);
}
);
```
Click [here](https://rhoinc.github.io/safety-results-over-time/test-page/) to open an interactive example of the Safety Results Over Time.
## Links
- [Interactive Example](https://rhoinc.github.io/safety-results-over-time/test-page/)
- [Configuration](https://github.com/RhoInc/safety-results-over-time/wiki/Configuration)
- [API](https://github.com/RhoInc/safety-results-over-time/wiki/API)
- [Technical Documentation](https://github.com/RhoInc/safety-results-over-time/wiki/Technical-Documentation)
- [Data Guidelines](https://github.com/RhoInc/safety-results-over-time/wiki/Data-Guidelines)