react-typescript-datamaps
Version:
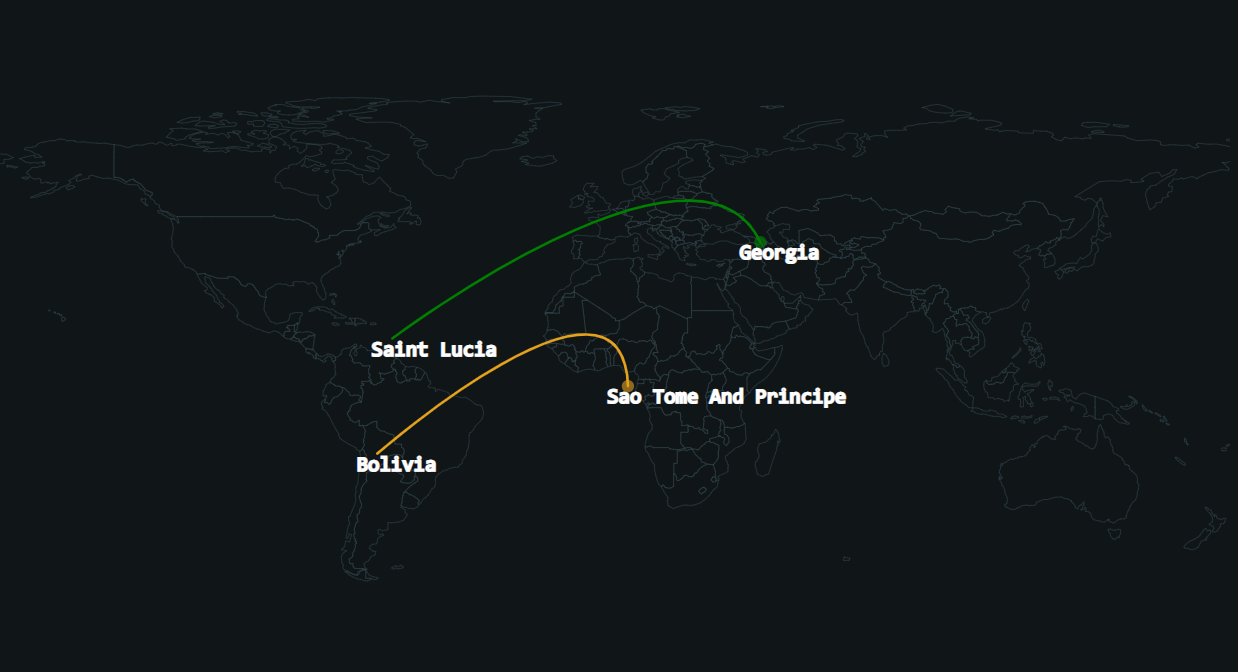
react wrapper component for the 'datamaps' library (Interactive maps for data visualizations). Out of the box it includes advance arc-attack-plugin and demo mode.
194 lines (170 loc) • 5.18 kB
Markdown
     
[](https://postimg.cc/KKNhNN1Y)
react-typescript-datamaps is a react wrapper component for the [datamaps](https://github.com/markmarkoh/datamaps) library - Interactive maps for data visualizations.
Out of the box it includes advance arc-attack-plugin and demo mode.
[](https://codesandbox.io/s/react-typescript-datamaps-lgzbz)
[](https://codesandbox.io/s/react-typescript-datamaps-2-l7ebe)
Use the package manager [npm](https://www.npmjs.com/package/react-typescript-datamaps) to install .
```bash
npm install react-typescript-datamaps
```
Adding ability to easily display attacks on svg maps.
React (with typescript) wrapper for the datamaps library for easy integration in your react project.
handleArcsAdvance - Datamaps plugin, can import alone and add to your own datamaps wrapper.
```jsx
// Use example - AttackMap - with builtin demo mode
import React from "react";
import { AttackMap } from "react-typescript-datamaps";
export default function App() {
return (
<div className="App">
<AttackMap demoMode={true}/>
</div>
);
}
// Use example - DataMapsWrapper , base on the the India map example https://github.com/markmarkoh/datamaps
const demoProps = {
scope: 'india',
geographyConfig: {
popupOnHover: true,
highlightOnHover: true,
borderColor: '#444',
borderWidth: 0.5,
dataUrl: 'https://rawgit.com/Anujarya300/bubble_maps/master/data/geography-data/india.topo.json'
//dataJson: topoJsonData
},
bubblesConfig: {
borderWidth: 2,
borderOpacity: 1,
borderColor: '#FFFFFF',
popupOnHover: true, // True to show the popup while hovering
radius: null,
popupTemplate: function (geo, data) {
return `<div class="hoverinfo">city: ${data.state}, Slums: ${data.radius}%</div>`;
},
fillOpacity: 0.75,
animate: true,
highlightOnHover: true,
highlightFillColor: '#FC8D59',
highlightBorderColor: 'rgba(250, 15, 160, 0.2)',
highlightBorderWidth: 2,
highlightBorderOpacity: 1,
highlightFillOpacity: 0.85,
exitDelay: 100, // Milliseconds
key: JSON.stringify
},
fills: {
'MAJOR': '#306596',
'MEDIUM': '#0fa0fa',
'MINOR': '#bada55',
defaultFill: '#dddddd'
},
data: {
'JH': { fillKey: 'MINOR' },
'MH': { fillKey: 'MINOR' }
},
setProjection: function (element) {
var projection = d3.geo.mercator()
.center([80, 25])
.scale(600)
.translate([element.offsetWidth / 2, element.offsetHeight / 2]);
var path = d3.geo.path()
.projection(projection);
return {path: path, projection: projection};
}
};
const bubblesDemo = [
{
centered: "MH",
fillKey: "MAJOR",
radius: 20,
state: "Maharastra"
},
{
centered: "AP",
fillKey: "MAJOR",
radius: 22,
state: "Andhra Pradesh"
},
{
centered: "TN",
fillKey: "MAJOR",
radius: 16,
state: "Tamil Nadu"
},
{
centered: "WB",
fillKey: "MEDIUM",
radius: 15,
state: "West Bengal"
},
{
centered: "MP",
fillKey: "MEDIUM",
radius: 15,
state: "Madhya Pradesh"
},
{
centered: "UP",
fillKey: "MINOR",
radius: 8,
state: "Uttar Pradesh"
},
{
centered: "RJ",
fillKey: "MINOR",
radius: 7,
state: "Rajasthan"
}
];
function Demo() {
const [bubbles, setBubbles] = React.useState([]);
React.useEffect(() => {
setInterval(() => {
setBubbles(bubblesDemo as any);
}, 1000);
},[]);
return (
<div style={{ width: '600px', height: '600px' }} className="App">
<DataMapsWrapper
{...demoProps}
bubbles={bubbles}
/>
</div>
);
}
export default function App() {
return (
<div className="example">
<Demo/>
</div>
);
}
```
prop | type | default value | info
--- | --- | --- | ---
data | ArcItem[] | [] | Array of attacks.
dataMapsProps| undefined or DataMapOptions | undefined | Any props support by the datamaps library
demoMod | boolean | false | Special mode - use to active demo of attacks without server needed.
hideTicker | boolean | true | Hide/Show default attack ticker table
ArcItem {
origin: Location;
destination: Location;
options: Options;
}
Location {
latitude: string | number;
longitude: string | number;
name: string;
}
Pull requests are welcome. For major changes, please open an issue first to discuss what you would like to change.
[](https://choosealicense.com/licenses/isc/)