react-d3-graph
Version:
React component to build interactive and configurable graphs with d3 effortlessly
124 lines (87 loc) • 12 kB
Markdown
# react-d3-graph · [](https://github.com/danielcaldas/react-d3-graph/workflows/react-d3-graph/badge.svg)
[](https://www.npmjs.com/package/react-d3-graph) [](https://www.npmjs.com/package/react-d3-graph)
[](https://www.npmjs.com/package/react-d3-graph) [](https://probot.github.io/) [](https://github.com/prettier/prettier)
:book: [Documentation](https://danielcaldas.github.io/react-d3-graph/docs/index.html)
### _Interactive and configurable graphs with react and d3 effortlessly_
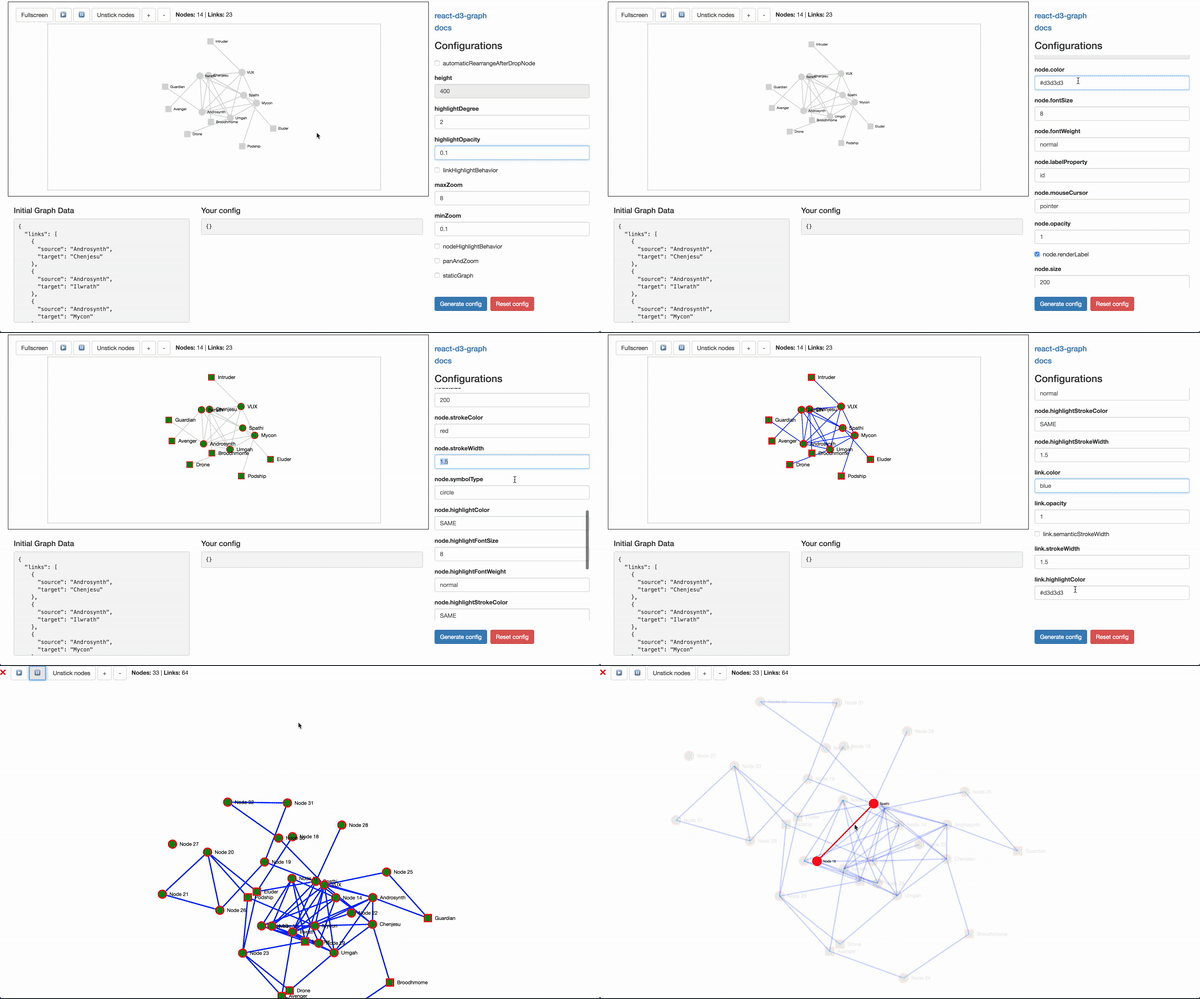
[](https://danielcaldas.github.io/react-d3-graph/sandbox/index.html)
## Playground
[Here a live playground](https://danielcaldas.github.io/react-d3-graph/sandbox/index.html) page where you can interactively config your own graph, and generate a ready to use configuration! :sunglasses:
You can also load different data sets and configurations via URL query parameter. Below is a table with all the data sets available in the live sandbox for you to interactively explore different kinds of integrations with the library.
| Name | Link | Source | Description |
| :----- | :---------------------------------------------------------------------------------------- | :------------------------- | :-------------------------------------------------------------------------------------------------------------------------------------------------------------------------------------------------------------------------------------------------------------------------------------------------------------------------------------------------------------------------------------------------------------------------------------------------------------------------------------------------------------------- |
| small | [demo](https://danielcaldas.github.io/react-d3-graph/sandbox/index.html?data=small) | `sandbox/data/small` | This is a good example to get you started. It has only 4 nodes. It's good to discuss over integration details and it's also good to report issues that you might found in the library. It's much easier to debug over a tiny graph. |
| custom | [demo](https://danielcaldas.github.io/react-d3-graph/sandbox/index.html?data=custom-node) | `sandbox/data/custom-node` | In this example you'll be able to see the power of the feature [node.viewGenerator](https://danielcaldas.github.io/react-d3-graph/docs/#node-view-generator) to create highly customizable nodes for you graph that go beyond the simple shapes that come out of the box with the library. |
| marvel | [demo](https://danielcaldas.github.io/react-d3-graph/sandbox/index.html?data=marvel) | `sandbox/data/marvel` | In this thematic example you can see how several features such as: [nodeHighlightBehavior](https://danielcaldas.github.io/react-d3-graph/docs/#node-highlight-behavior), [custom SVGs for nodes](https://danielcaldas.github.io/react-d3-graph/docs/#node-svg), [collapsible](https://danielcaldas.github.io/react-d3-graph/docs/#collapsible) etc. come together on top of a directed graph that displays some characters from the Marvel Universe. |
| static | [demo](https://danielcaldas.github.io/react-d3-graph/sandbox/index.html?data=static) | `sandbox/data/static` | If your goal is not to have nodes dancing around with the default [d3 forces](https://danielcaldas.github.io/react-d3-graph/docs/#config-d3) that the library provides, you can opt by making your nodes static and positioned them always in the same _(x, y)_ coordinates. To achieve this you can make use of [staticGraphWithDragAndDrop](https://danielcaldas.github.io/react-d3-graph/docs/#static-graph-with-drag-and-drop) or [staticGraph](https://danielcaldas.github.io/react-d3-graph/docs/#static-graph) |
Do you want to visualize your own data set on the live sandbox? Just submit a PR! You're welcome 😁.
## Documentation :book:
Full documentation [here](https://danielcaldas.github.io/react-d3-graph/docs/index.html).
## Install
[](https://www.npmjs.com/package/react-d3-graph)
```bash
npm install d3@^5.5.0 # if you don't have d3 already
npm install react@^16.4.1 # if you don't have react already
npm install react-d3-graph
```
#### About react and d3 peer dependencies
**Note** that `react` and `d3` are [peer-dependencies](https://nodejs.org/en/blog/npm/peer-dependencies/), this means that the responsibility to install them is delegated to the client. This will give you more flexibility on what versions of `d3` and `react` you want to consume, you just need to make sure that you are compliant with the range of versions that `react-d3-graph` is compatible with. If you install `react-d3-graph` without first installing `d3` and `react` you might see the following warnings:
> npm WARN react-d3-graph@2.0.1 requires a peer of d3@^5.5.0 but none is installed. You must install peer dependencies yourself.
> npm WARN react-d3-graph@2.0.1 requires a peer of react@^16.4.1 but none is installed. You must install peer dependencies yourself.
## Minimal usage example
Graph component is the main component for react-d3-graph components, its interface allows its user to build the graph once the user provides the data, configuration (optional) and callback interactions (also optional).
The code for the [live example](https://danielcaldas.github.io/react-d3-graph/sandbox/index.html) can be consulted [here](https://github.com/danielcaldas/react-d3-graph/blob/master/sandbox/Sandbox.jsx).
```javascript
import { Graph } from "react-d3-graph";
// graph payload (with minimalist structure)
const data = {
nodes: [{ id: "Harry" }, { id: "Sally" }, { id: "Alice" }],
links: [
{ source: "Harry", target: "Sally" },
{ source: "Harry", target: "Alice" },
],
};
// the graph configuration, just override the ones you need
const myConfig = {
nodeHighlightBehavior: true,
node: {
color: "lightgreen",
size: 120,
highlightStrokeColor: "blue",
},
link: {
highlightColor: "lightblue",
},
};
const onClickNode = function(nodeId) {
window.alert(`Clicked node ${nodeId}`);
};
const onClickLink = function(source, target) {
window.alert(`Clicked link between ${source} and ${target}`);
};
<Graph
id="graph-id" // id is mandatory
data={data}
config={myConfig}
onClickNode={onClickNode}
onClickLink={onClickLink}
/>;
```
For more advanced use cases check [the official documentation](https://danielcaldas.github.io/react-d3-graph/docs/index.html).
## Core Team
The group of maintainers driving the project.
| [Daniel Caldas](https://github.com/danielcaldas) | [Sara Hernández](https://github.com/LonelyPrincess) | [Terahn Harrison](https://github.com/terahn) | [Antonin Klopp-Tosser](https://github.com/antoninklopp) |
| ----------------------------------------------------------------------------------------------------------------------- | ------------------------------------------------------------------------------------------------------------------------- | ----------------------------------------------------------------------------------------------------------------- | ------------------------------------------------------------------------------------------------------------------ |
|  |  |  |  |
| [@\_danielcaldas](https://twitter.com/_danielcaldas) | | | |
## Contributions
Contributions are welcome, feel free to submit new ideas/features, just go ahead and open an issue. If you are more a _hands on_ person, just submit a pull request. Before jumping into coding, please take a look at the contribution guidelines [CONTRIBUTING.md](https://github.com/danielcaldas/react-d3-graph/blob/master/CONTRIBUTING.md).
To run react-d3-graph in development mode you just need to run `npm run dev` and the interactive sandbox will reload with the changes to the library code, that way you can test your changes not only through unit test but also through a real life example. It's that simple. The development workflow usually should follow the steps:
- Create a branch prefixed with `fix/` for bug fixes, `feature/` for new features, `chore/` or `refactor/` for refactoring or tooling and CI/CD related tasks.
- Make sure you are up to date running `npm install`.
- Run `npm run dev`.
- Make you changes inside the folder `src` and the interactive sandbox consumes your changes in real time
with webpack-dev-server.
- You can run tests locally with `npm run test` (for unit tests) or `npm run functional:local` for e2e tests.
- After you're done, open the Pull Request and describe the changes you've made.
## Alternatives (Not what you where looking for?)
Well if you scrolled this far maybe _react-d3-graph_ does not fulfill all your requirements 😭, but don't worry I got you covered! There are a lot of different and good alternatives out there, [here is a list with a few alternatives](http://anvaka.github.io/graph-drawing-libraries/#!/all#%2Fall).