react-chart-all
Version:
Simple Chart.js React component npm module. Support npm chart.js version, ES6 syntax and all chart.js types (Line, Bar, Radar, Polar Area, Pie, Doughnut).
119 lines (89 loc) • 3.5 kB
Markdown
# Description
This is npm version of simple Chart.js React component available at: [github.com/javascriptiscoolpl/react-charts](https://github.com/javascriptiscoolpl/react-charts). However, this version has been changed to support npm chart.js version, ES6 syntax and npm module environment.
# Install
npm install react-chart-all
# Usage - show
##### index.html
<html>
<head>
<meta charset="UTF-8" />
<title>example</title>
<style>
.SimpleChart {
width: 400px;
border: 1px dashed red;
float: left;
margin: 5px;
}
</style>
</head>
<body>
<div id="app"></div>
<script src="index.js"></script>
</body>
</html>
##### index.js
The default type is <code>line</code>, so you can skip it here.
import React from "react";
import ReactDOM from "react-dom";
import Chart from "chart.js";
import rcl from "react-chart-all";
// sample page content
class App extends React.Component {
constructor(props) {
super(props);
}
render() {
var chart = this.props.data;
return (
<div>
<rcl.SimpleChart data={chart} type={"line"}/>
<rcl.SimpleChart data={chart} type={"bar"}/>
<rcl.SimpleChart data={chart} type={"radar"}/>
<rcl.SimpleChart data={chart} type={"polarArea"}/>
<rcl.SimpleChart data={chart} type={"pie"}/>
<rcl.SimpleChart data={chart} type={"doughnut"}/>
<rcl.SimpleChart data={chart}/>
<rcl.SimpleChart data={chart} type={"radar"}/>
<rcl.SimpleChart data={chart} type={"bar"}/>
</div>
);
}
}
// sample usage 1
var chart = { msg: "test chart", osX: [], osY: [] };
for (var i=0,x=0; i<5; i++,x++) {
chart.osX[i] = "id "+x;
chart.osY[i] = x+5;
}
ReactDOM.render(
<App data={chart}/>,
document.getElementById('app')
);
# Usage - update
To update chart just send new <code>props</code> to the React component.
##### index.js
var chart = { msg: "testing random chart", osX: [], osY: [] };
function setRandomChart() {
for (var i=0,x=0; i<8; i++,x++) {
chart.osX[i] = "id "+x;
chart.osY[i] = x*Math.random();
}
ReactDOM.render(
<App data={chart}/>,
document.getElementById('app')
);
}
setInterval(() => { setRandomChart() }, 5000);
# Demo (might be very slow)
The demo is available in module directory. To test the demo just go to <code>demo</code> directory in module folder and open <code>index.html</code> in your browser.
However, you can build the demo again with npm. To re-build the demo just go to <code>demo</code> directory in module folder and run command:
npm run build
This should download all packages and build the demo <code>index.js</code> file again. After it, you can open <code>index.html</code> in your browser. Should work :-)
# Screenshot (demo)
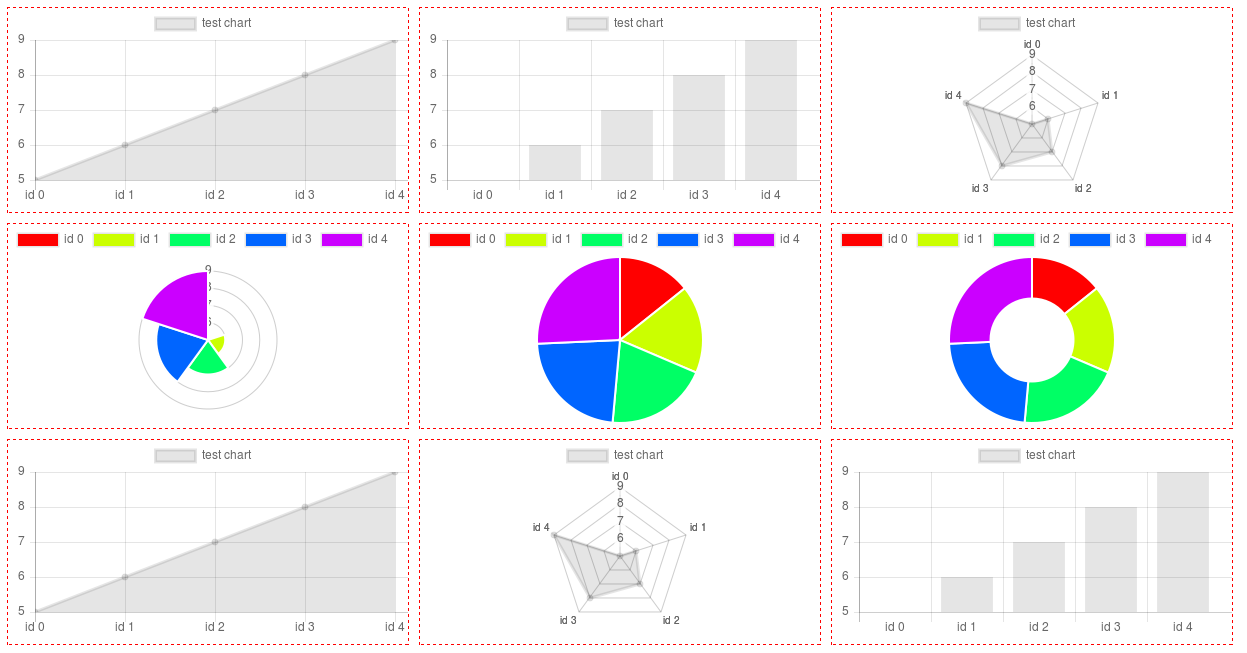
# Additional info (Polar, Pie, Doughnut)
For this type of chart you need only <code>osY</code> values in fact. They must be positive to show on chart. The <code>osX</code> is taken as labels here (can be strings). Colors are calculated according to the <code>osY</code> length, more data more colors.
# License
MIT