quickchart
Version:
In browser NodeJs data visualisation in seconds
58 lines (38 loc) • 1.32 kB
Markdown
# QuickChart
Ever wanted to visualize a dataset in a chart in seconds in a node app? Search no further!
QuickChart quickly opens a minimalistic node server and displays a ChartJs graph on your fav' browser using [autoChart](https://www.npmjs.com/package/autochart).
## Installation
```bash
npm i quickchart
```
## Usage
`quickchart(type, data, [options])`
The available chart types are `bar`, `line`, `radar`, `doughnut`, `pie` and `polarArea`.
Available options :
- `port` the server's port
- `hostname` the server's hostname
- `callback` a callback when success/fail. `callback(error)`
By default, the port is `8001`, the host is `localhost` and callback is a `console.log` or a `console.error`.
## Example
```javascript
const quickchart = require('quickchart')
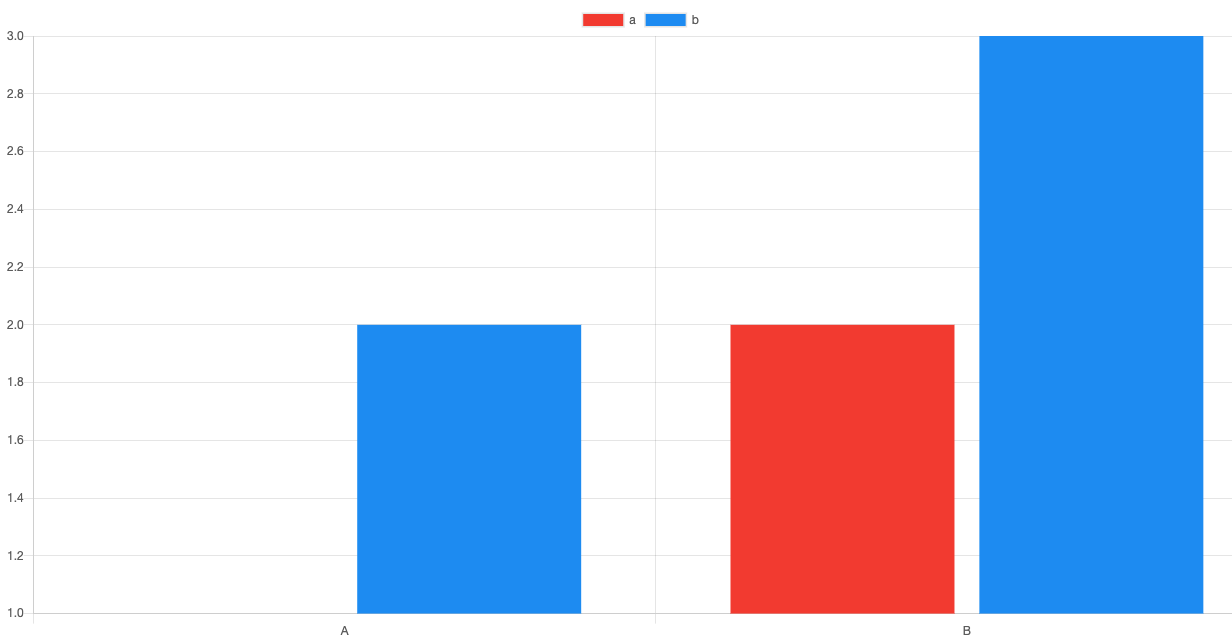
// with an object
quickchart('bar', {
A: {a: 1, b: 2},
B: {a:5, b: 9}
})
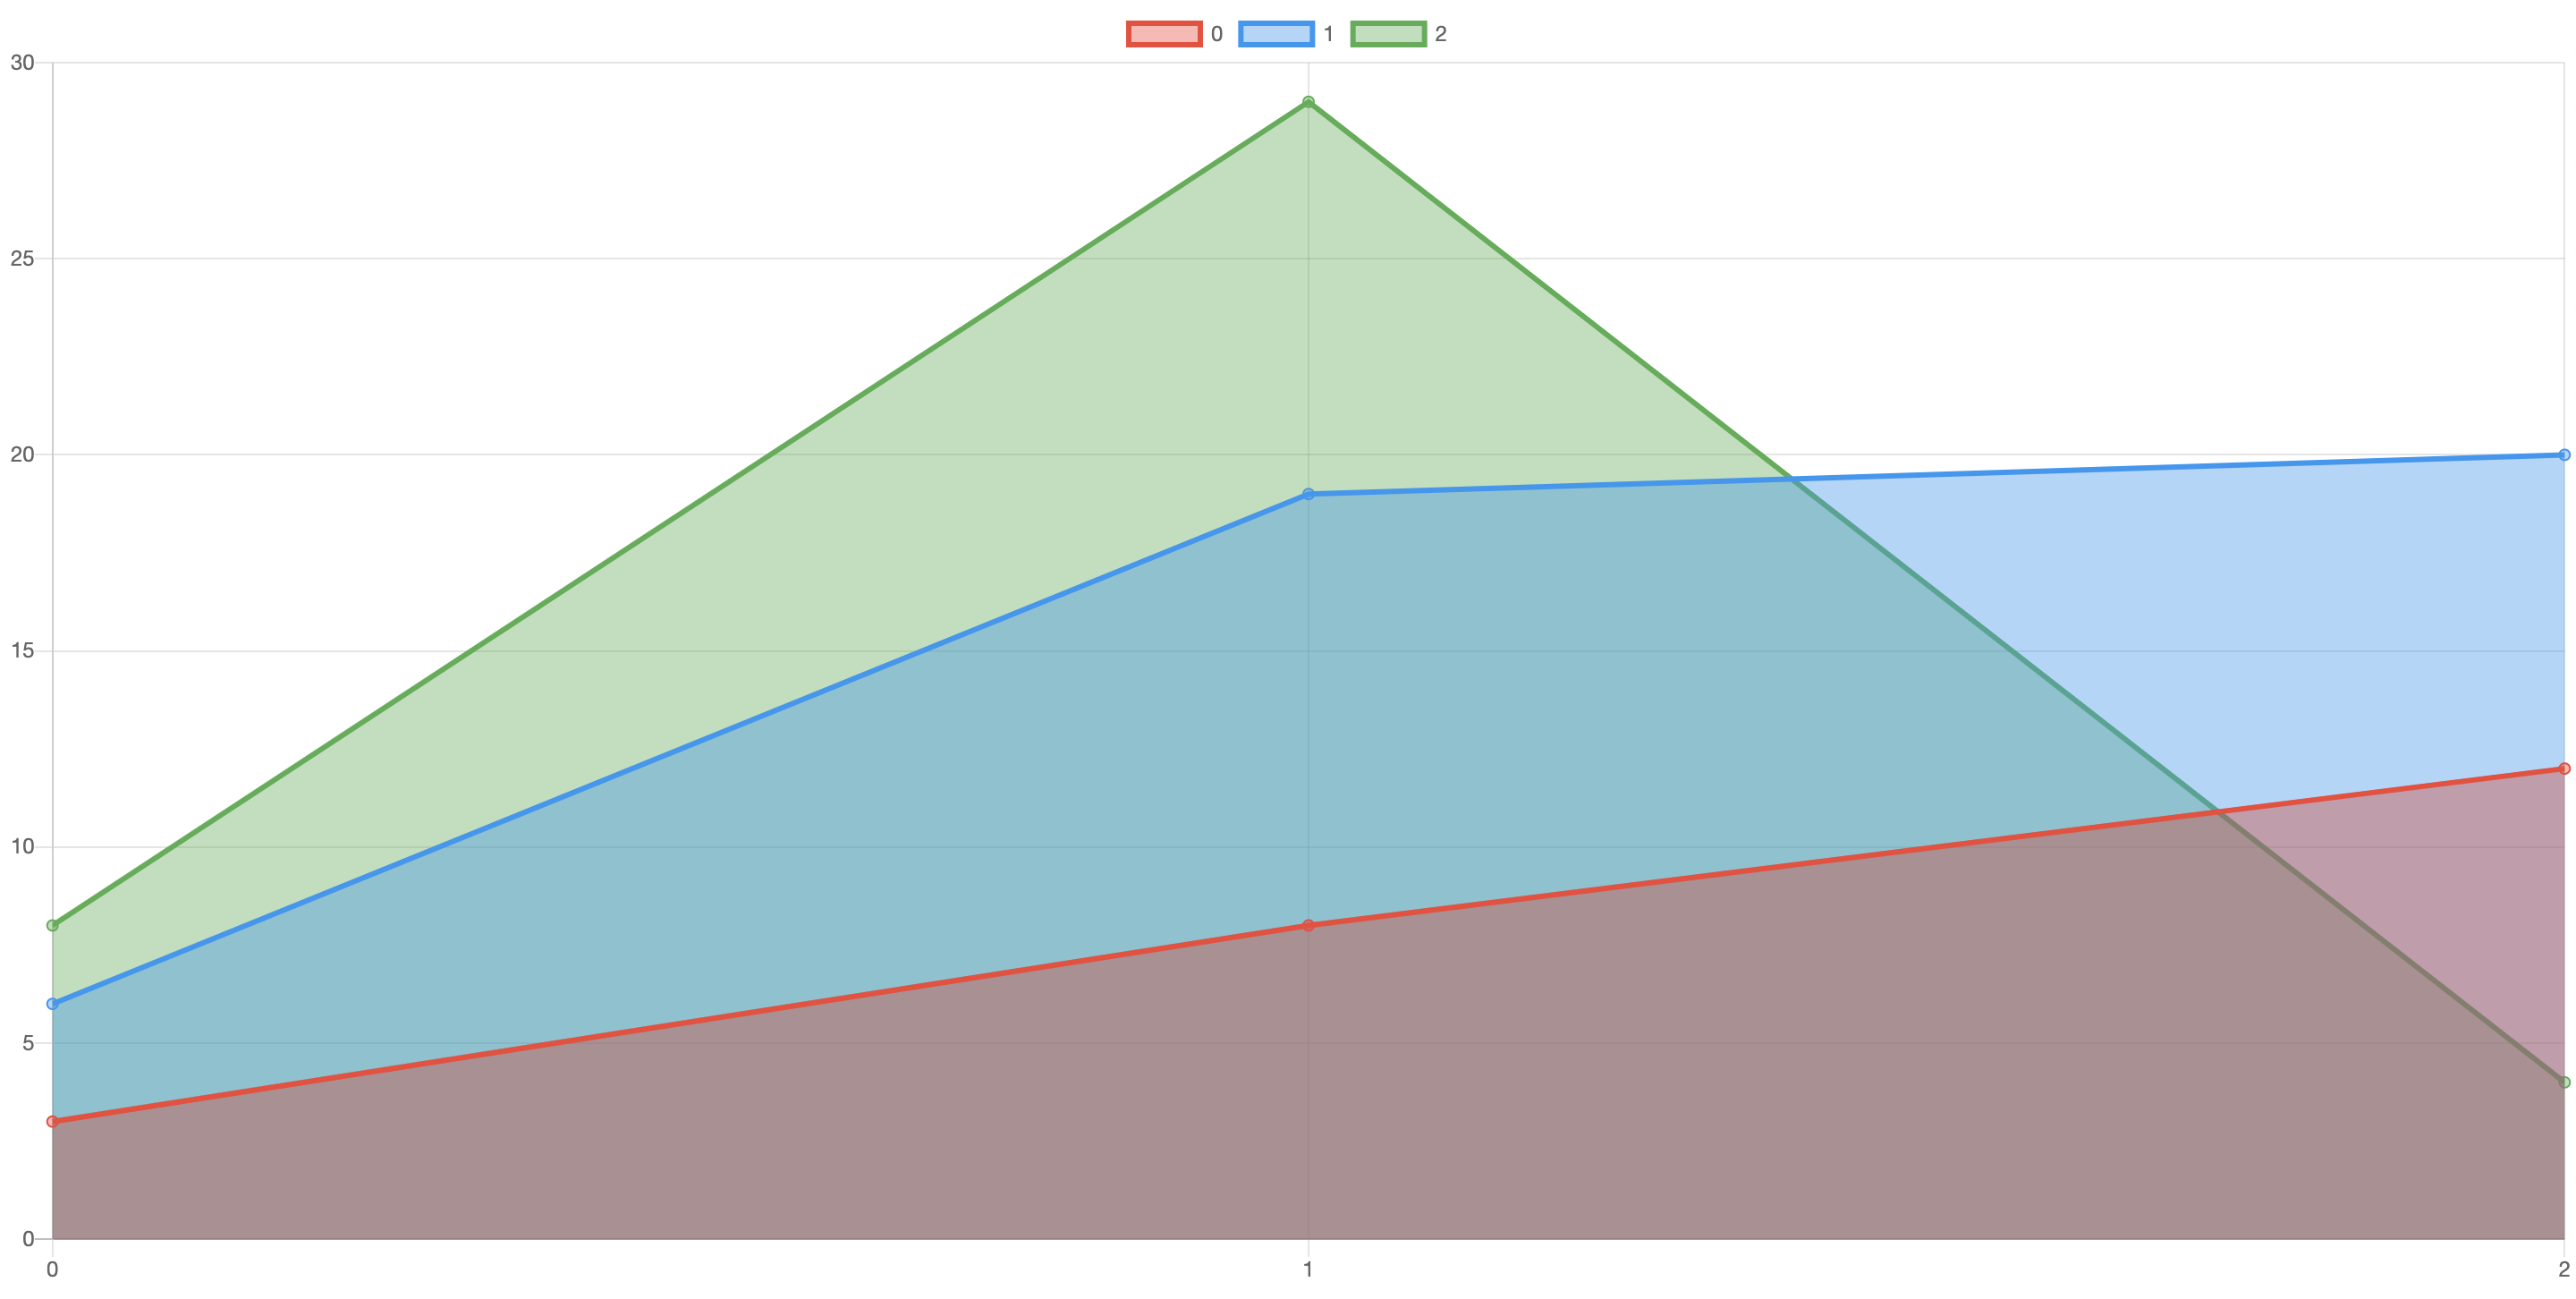
// with an array
quickchart('line', [
[3, 6, 8],
[8, 19, 29],
[12, 20, 4],
])
```
```bash
QuickChart is running on 127.0.0.1:8001
```
## License
MIT © Ivan Sedletzki - Please use and share at will
Special thanks to Dinesh Pandiyan for npm-module-boilerplate