perfrunner
Version:
Command-line-interface for the perfrunner - automated UI performance test tool
207 lines (141 loc) • 8.93 kB
Markdown
# Perfrunner [](https://travis-ci.org/Drag13/perfrunner)
Perfrunner - performance testing tool for websites and web applications. Tracks your application performance with Performance Events and visualize the progress. Supports various predefined network conditions, CPU throttling, cache. Supports different output - [HTML](#html), [CSV](#csv), [JSON](#json). Uses multiple reruns for better precision.
Tracks:
- First Contentful Paint
- Largest Contentful Paint
- Layout duration time
- Script duration time
- Resources size (js, css, img, fonts)
- And much more!
## Example
```cmd
npx perfrunner drag13.io
```
It's just an example, please don't consider to take framework depending on this chart :)
## Installation
To save it into your project:
```cmd
npm i perfrunner -D
```
For one-time usage:
```cmd
npx perfrunner https://drag13.io
```
## Default options
- Network:**original**/ **fast3g**
- Cache: **false**
- Runs: **3**
- Reporter: **html**
- Throttling: **2**
## All options
| Command | Alias | Description | Default value | IsRequired |
| --------------------- | ----- | ---------------------------------------------------------------------------------------------------------------- | ---------------------- | ---------- |
| | | Run tests using perfrunner.json config file | | Optional |
| --cache | -C | Using browser cahce. Mutliple values supported. <`true`/`false`> | `false` | Optional |
| --chrome-args | - | Additional arguments to pass to the browser instance. Should be passed using camelCase style like: `"noSandbox"` | `undefined` | Optional |
| --comment | - | Provide additional information about test. May be used from reporter | `undefined` | Optional |
| --executable-path | -E | Sets path to the Chrome instance | `undefined` | Optional |
| --ignore-default-args | - | Ignore defaultArgs for launching Chromium | `false` | Optional |
| --init | - | Creates perfrunner.json config file, requires URL as a parameter | `undefined` | Optional |
| --log-level | - | Setup log level: <`verbose`> | `undefined` | Optional |
| --network | - | Setup network contions. Multiple values supported. <`online`/`regular4g`/`fast3g`/`hspa`/`slow3g`> | `online`,`fast3g` | Optional |
| --no-headless | - | Disables headless mode | `false` | Optional |
| --purge | - | Remove old data before the test run | `false` | Optional |
| --reporter | - | Specify reporter | `html` | Optional |
| --report-only | - | Skips profiling session and only generates report | `false` | Optional |
| --runs | -R | Number of runs you want to be performed | `3` | Optional |
| --test-name | - | Name of the test run. Will be used to name testRun folder and grouping results | `undefined` | Optional |
| --throttling | -T | CPU slowdown multiplier | `2` | Optional |
| --timeout | - | Set timeout for the single test run in miliseconds | `90_000` | Optional |
| --url | - | Url to profile | This field is required | Required |
| --wait-for | -W | Specify selector or time in miliseconds to wait | `undefined` | Optional |
## Reporters
Supported reporters:
- [HTML](#html) - renders basic metrics into HTML (FCP, LCP, DCL, Size, etc)
- [MD](#md) - generates simple markdown report with First Contentful Paint and Largest Contentful Paint, DOM Interactive and some other metrics
- [JSON](#json) - saves all data to json
- [CSV](#csv) - saves all data to csv
- [custom](#custom) - you can specify your own custom reporter
To switch between reporters, use `--reporter` flag:
```cmd
npx drag13.io --reporter json
```
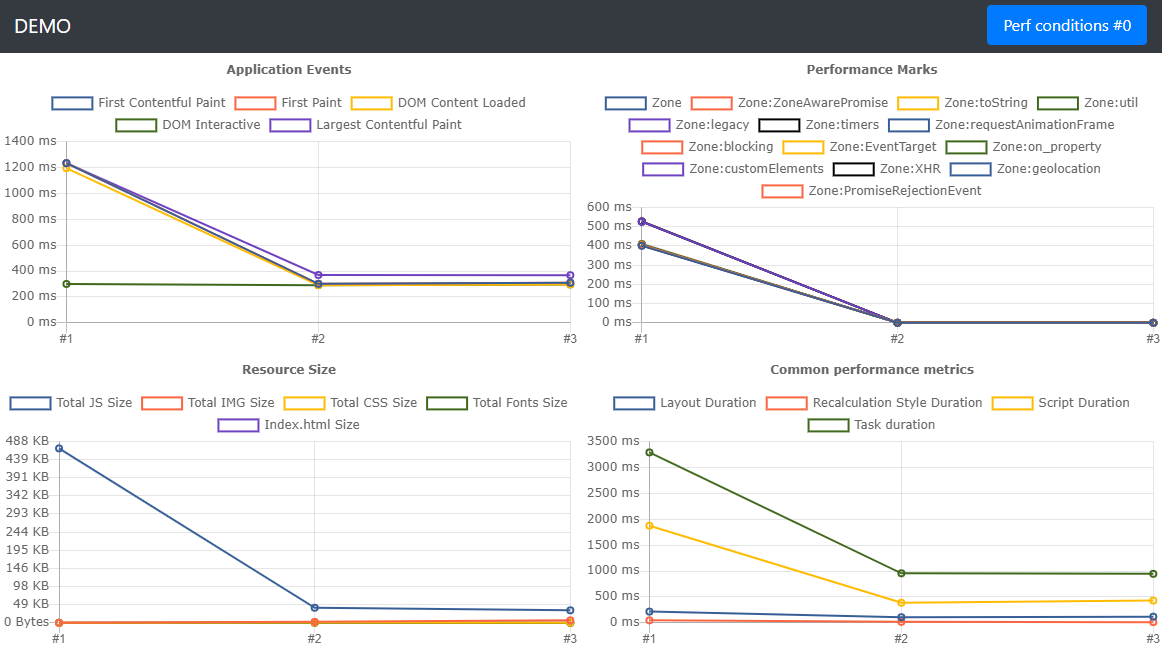
## HTML
Generates output as an HTML file. Includes:
- Performance events Chart (DOM Content Loaded, First Paint, First Contentful Paint, Largest Contentful Paint, DOM Interactive)
- Default Performance Metrics Chart - Layout Duration, Recalculation Style Duration, Script Duration, Task duration
- Resource Size Chart (JS, CSS ,IMG, Fonts, XHR)
- Performance Marks Chart - shows performance marks from application
Example:
This is default reporter so you don't need to name it
```cmd
npx perfrunner drag13.io
```
## MD
Generate simple markdown report, that includes:
- Performance events - First Contentful Paint and Largest Contentful Paint
- Performance metrics DOM Interactive, Script Duration, Layout Duration, Recalculate Style metrics.
**Example:**
```cmd
npx perfrunner drag13.io --reporter md
```
## JSON
Generates output as JSON file
**Example:**
```cmd
npx perfrunner drag13.io --reporter json
```
## CSV
Generates output as CSV file
**Example:**
```cmd
npx perfrunner drag13.io --reporter csv
```
## Custom
You also can use your own custom reporter
```cmd
npx perfrunner https://drag13.io --reporter my-custom-reporter.js
```
where reporter should looks like:
```js
module.exports = {
generateReport: (data, args) => console.log(outputFolder, JSON.stringify(data), args),
defaultReportName: 'reporter.txt',
};
```
## Config file
Config file supports additional features:
- Testing multiple plages
- Network customization
- Executing post loading script
### OnAfterPageLoaded
To run script after it was loaded, you need to:
- Create new file on the root of the project using `module.exports = function` notation
- Set `onAfterPageLoadedScript` property to "./YOUR-FILE-NAME.js"
Example:
```js
module.exports = async function () {
console.log('start');
return new Promise((r) => setTimeout((x) => (console.log('end'), r()), 3000));
};
```
The script will beexecuted after page loaded. If the script is async - page will wait till completion
## Troubleshooting
Internally, perfrunner uses [puppeteer](https://github.com/puppeteer/puppeteer), so please check [this](https://github.com/puppeteer/puppeteer/blob/master/docs/troubleshooting.md) page for troubleshooting.
Perfrunner supports passing chromeArgs and ignoreDefaults flags for better control from your side:
```cmd
npx perfrunner https://drag13.io --ignore-default-args --chrome-args noSandbox
```
You also can use Perfrunner without headless mode
```cmd
npx perfrunner https://drag13.io --no-headless
```
If nothing helps, try to use `--executable-path` option
```cmd
npx perfrunner https://drag13.io -E "Path\To\chrome.exe"
```
## What next
For the next updates, please check the [project](https://github.com/Drag13/perfrunner/projects/1). It's not very well described but might give you an idea of what is planned.
## More details
Here you can find an [introduction article about the Perfrunner](https://drag13.io/posts/perfrunner-intro/index.html).