perf-lens
Version:
AI-powered frontend performance optimizer
177 lines (128 loc) • 7.71 kB
Markdown
# PerfLens 🔍
**Lighthouse finds the slow pages. PerfLens finds the slow code.**
[](https://github.com/moiz-imran/perf-lens/actions/workflows/ci.yml)
[](https://badge.fury.io/js/perf-lens)
[](https://opensource.org/licenses/MIT)
[](https://nodejs.org)
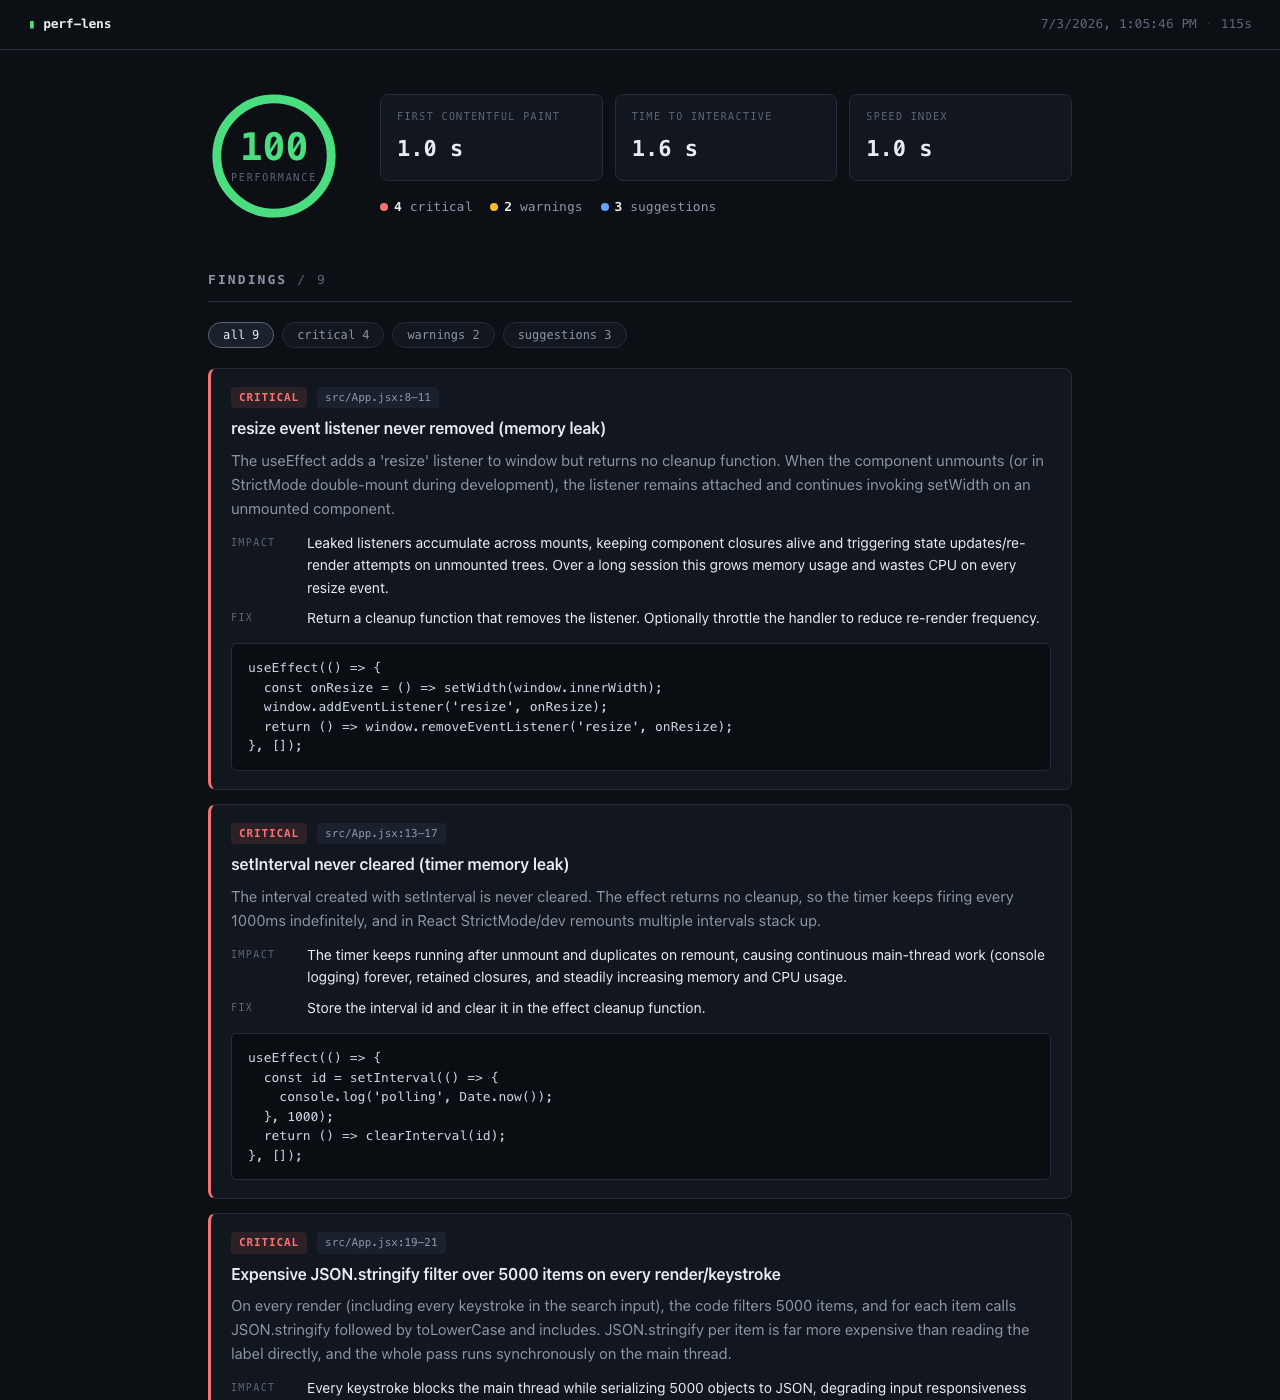
PerfLens runs Lighthouse against your dev server, then puts Claude to work on your _source code_ with those results as evidence. The report reads like a code review: "this `useEffect` in `ProductGrid.tsx:47` refetches on every render," with severity, impact, and corrected code for each finding. Every file/line location is checked against the actual file before it reaches the report, and `--fail-on critical` turns the scan into a CI gate.
## How it works
Two analysis modes share the same finding schema and report pipeline:
**Scan mode (default)** — files are prioritized, batched, and sent to Claude with the Lighthouse context. Findings come back through [structured outputs](https://platform.claude.com/docs/en/build-with-claude/structured-outputs) (a zod schema enforced by the API), so results are typed and validated rather than scraped out of prose. Every reported file/line location is verified against the actual file before it reaches the report.
**Agent mode (`--agent`)** — instead of being handed files, the model investigates the codebase itself through a hand-rolled tool-use loop (`list_files`, `read_file`, `grep`), forms hypotheses from the Lighthouse data, reads the relevant code, and submits findings via a final `report_findings` tool call. Tool access is sandboxed to the target directory.
Under the hood:
- **Structured outputs** via `messages.parse()` + zod — schema-guaranteed JSON findings
- **Agentic tool use** — multi-turn investigation loop with strict tool schemas and a forced final report
- **Prompt caching** — the stable system prefix (expert prompt + Lighthouse context) is cached across batch calls
- **Result caching** — unchanged file batches are never re-analyzed (`.perflens-cache.json`, content-hash keyed)
- **Cost tracking** — every scan ends with a token + estimated cost summary
## Installation
```bash
npm install --save-dev perf-lens
# or globally
npm install -g perf-lens
```
Requires Node.js ≥ 20 and Chrome (for Lighthouse).
## Quick start
1. Set your Anthropic API key (one of):
```bash
perf-lens config set-key YOUR_API_KEY
# or
export ANTHROPIC_API_KEY=YOUR_API_KEY
```
2. Start your dev server, then run a scan from your project root:
```bash
perf-lens scan
```
PerfLens auto-detects the dev server port (from `package.json` scripts or common ports), runs Lighthouse, analyzes your code, and writes `performance-report.md`.
3. Try agent mode:
```bash
perf-lens scan --agent
```
### CI gate
Fail the pipeline when serious issues appear:
```bash
perf-lens scan --fail-on critical # exit 1 if any critical finding
perf-lens scan --fail-on warning # exit 1 on critical or warning
```
## CLI reference
```
perf-lens scan [options]
-c, --config <path> Path to config file
-p, --port <number> Development server port
-t, --target <directory> Directory to scan (default: current directory)
-f, --max-files <number> Maximum number of files to analyze
-b, --batch-size <number> Files per batch
-s, --max-size <number> Maximum file size in KB
-d, --batch-delay <number> Delay between batches (ms)
-o, --output <path> Report output path
--format <type> Output format: md or html
--agent Agentic analysis (model investigates via tools)
--fail-on <severity> Exit 1 if findings at/above severity exist (CI gate)
--no-cache Skip the analysis result cache
--mobile Mobile emulation for Lighthouse
--cpu-throttle <number> CPU throttle multiplier
--network-throttle <type> slow3G | fast3G | 4G | none
--timeout <number> Lighthouse timeout (ms)
--verbose Verbose output
perf-lens config set-key <key> Save your Anthropic API key
perf-lens config get-key Show the configured key (masked)
```
## Configuration
PerfLens loads config via [cosmiconfig](https://github.com/cosmiconfig/cosmiconfig): `.perflensrc`, `.perflensrc.json|yaml|js`, `perflens.config.js`, or a `perflens` field in `package.json`.
```js
// perflens.config.js
export default {
ai: {
model: 'claude-opus-4-8', // default; use 'claude-haiku-4-5' for cheaper scans
maxTokens: 16000,
},
thresholds: {
performance: 90,
lcp: 2500,
cls: 0.1,
},
analysis: {
targetDir: '.',
maxFiles: 200,
batchSize: 20,
ignore: ['**/generated/**'],
},
lighthouse: {
mobileEmulation: true,
throttling: { cpu: 4, network: 'fast3G' },
},
output: {
format: 'html',
directory: './reports',
},
};
```
A `.perflensignore` file (gitignore syntax) is also honored.
### Model selection
The default model is `claude-opus-4-8` (deepest analysis). For faster/cheaper scans set `ai.model` to `claude-haiku-4-5`; `claude-sonnet-5` sits in between. Cost is printed after every scan so you can decide with real numbers.
### API key resolution
`PERF_LENS_ANTHROPIC_API_KEY` → `ANTHROPIC_API_KEY` → `~/.perf-lens/config.json` (written by `config set-key`).
## Reports
- **Markdown** — metrics summary, Lighthouse insights, and findings grouped by severity (🚨 critical / ⚠️ warning / 💡 suggestion), each with description, impact, solution, and a corrected code example.
- **HTML** — the same content as a self-contained styled dashboard.
## FAQ
**Why not just hand my Lighthouse report to Claude Code or Cursor?**
For a one-off investigation, do exactly that. It works, and it's the same idea this tool is built on. PerfLens exists for the runs after the first one. A fresh agent explores differently every time and produces different findings in different formats, which makes it a flaky CI check. PerfLens pins that down: schema-enforced structured output, every reported file/line verified before it hits the report, content-hash caching so unchanged code produces identical results instead of a re-roll, severity-based exit codes for gating, and per-scan cost you can see and cap. Build that layer around your own agent pipeline and you also own the glue code, the prompt drift, and the pager.
**How is this different from Lighthouse alone?**
Lighthouse measures and points at _resources_ (bundles, requests, images). PerfLens continues the investigation into the _code_ that produced them, and proposes the fix.
**What does a scan cost?**
You bring your own Anthropic API key and pay per scan; there's no service in the middle. Exact token usage and estimated cost are printed after every scan. Result caching means re-scans only pay for changed files, and you can set `ai.model` to `claude-haiku-4-5` for cheap scans.
**Where does my code go?**
Directly to the Anthropic API, nowhere else. In agent mode, the model's file access is sandboxed to the target directory. Use `.perflensignore` to exclude anything you don't want analyzed.
## Development
```bash
npm install
npm run build # tsc + prompt templates
npm test # vitest
npm run typecheck
npm run lint
```
Releases are automated with semantic-release on `main`.
## License
MIT © Moiz Imran