orgchart
Version:
Simple and direct organization chart(tree-like hierarchy) library based on pure DOM.
1,003 lines (875 loc) • 37.4 kB
Markdown

# Read this in other languages: [简体中文](https://github.com/dabeng/OrgChart/blob/master/README.zh-cn.md), [English](https://github.com/dabeng/OrgChart/blob/master/README.md)
# [ES6版](http://github.com/dabeng/OrgChart.js)
# [Web Components版](http://github.com/dabeng/OrgChart-Webcomponents)
# [Vue.js版](https://github.com/dabeng/vue-orgchart)
# [Angular版 -- 最節省空間的解決方案](https://github.com/dabeng/ng-orgchart)
# [React版](https://github.com/dabeng/react-orgchart)
## 寫在前面的話
感謝[wesnolte](https://github.com/wesnolte)的非常棒的作品-- [jOrgChart](https://github.com/wesnolte/jOrgChart)。用嵌套的table來構造樹狀結構,用td的border來構造節點間的連線,非常有創意。天然地降低了前端程序員在構造樹狀結構時的工作量和難度,要知道,利用D3.js中的腦圖去達到同樣效果,開發周期就會長好多。哪怕你對svg,canvas等高級的制圖API了然于胸,當你的樹狀結構圖激發出HR大姐的各種天馬行空的需求時,你會坦誠的承認svg或canvas這種重型武器拖累了你的快速解決一小戳敵人的能力。相比較而言,用單純的**HTML5 + CSS3**的解決方案就像是 **“小米 + 步槍”的輕步兵**,天然地降低了你在實現樹狀結構圖的難度,同時給予你更大的定制空間去面對基于這個結構圖衍生出的種種瑣碎需求。只要你的需求足夠多,基于這個樹狀結構圖,打造出一個完備的HR系統,也是可以期待的。實際上,網絡上很多OrgChart商業軟件就是圍繞著一個樹狀結構核心模型展開的業務邏輯實現。
- 自 5.0 版本起,使用者可以建立家譜樹。
- 自 6.0 版本起,OrgChart 元件已回歸原生實作,不再依賴 jQuery。
## 功能特性
- 支持本地和遠程的數據源。
- 用戶可以展開/折疊節點或子樹,方便地浏覽局部的結構圖。
- 上下左右4個方向的布局。
- 用戶可以通過拖放節點或子樹的方式來改變組織結構圖的形態。
- 用戶可以編輯組織結構圖的層次結構並將最終結果保存爲JSON對象。
- 支持將組織結構圖導出爲png圖片或pdf文檔。
- 支持對組織結構圖的縮放/平移
- 用戶可以自行定制節點的內部結構,例如插入員工照到節點中。
- 用戶可以采用不同的數據源構建多層級的組織結構圖(請參考多層組織結構圖和混合布局組織結構圖的實例)。
- 支持移動設備上的多點觸控操作。
## CDN
可以在CDN上找到本插件的對應資源。
[](https://cdnjs.com/libraries/orgchart) https://cdnjs.com/libraries/orgchart
## 安裝
### Bower
```
# From version 1.0.2 on, users can install orgchart and add it to bower.json dependencies
$ bower install orgchart
```
### npm
```
# From version 1.0.4 on, users can install orgchart with npm
$ npm install orgchart
```
在 CommonJS 環境中,`require('orgchart')`會直接導出 `OrgChart` 構造函數。
可參考這個例子, [在React中使用jQuery Orchart](https://stackblitz.com/edit/vitejs-vite-hqv4nbdt)
## [gihtub pages實例集合](https://dabeng.github.io/OrgChart/)
## [基于嵌套ul的實例集合](https://codepen.io/collection/nWqvzY)
## [基于嵌套table的實例集合](https://codepen.io/collection/AWxGVb/) (過時)
### 天馬行空的需求
- [ul數據源](https://dabeng.github.io/OrgChart/ul-datasource.html)(感謝 [Tobyee的好點子:blush:](https://github.com/dabeng/OrgChart/issues/1))
- [本地數據源](https://dabeng.github.io/OrgChart/local-datasource.html)
- [我想平移/縮放組織結構圖,像在地圖應用上那樣](https://dabeng.github.io/OrgChart/pan-zoom.html)
- 我想以不同的方向布局組織結構圖(感謝 [fvlima 和 badulesia 的好點子 :blush:](https://github.com/dabeng/OrgChart/issues/5))
從上到下 -- 默認的布局方向
[從下到上](https://dabeng.github.io/OrgChart/bottom2top.html)
[從左到右](https://dabeng.github.io/OrgChart/left2right.html)
[從右到左](https://dabeng.github.io/OrgChart/right2left.html)
- [我想通過點擊左右兩邊的箭頭來展開/折疊當前節點的左右兩邊單側的兄弟節點](https://dabeng.github.io/OrgChart/toggle-sibs-resp.html)
- [我想通過ajax請求獲得遠程數據源,然後構造組織結構圖](https://dabeng.github.io/OrgChart/ajax-datasource.html)
- [我想按需載入數據源,進而渲染不同的組織結構圖](https://dabeng.github.io/OrgChart/ondemand-loading-data.html)

- [我想定制組織結構圖中節點內的結構](https://dabeng.github.io/OrgChart/option-createNode.html)
- [我想把組織結構圖導出成一個圖片](https://dabeng.github.io/OrgChart/export-chart.html)
這裏使用了第三方的工具[html2canvas](https://github.com/niklasvh/html2canvas).
**注意:**
(1) 如果你想在IE或Edge導出,請先引入[es6-promise.auto.js](https://github.com/stefanpenner/es6-promise)到項目中.
(2) 如果你的操作系統是Windows,請先檢查“縮放設置”,需調整"Change the size of text, apps, and other items" to 100%.(感謝[sayamkrai](https://github.com/sayamkrai)的[研究](https://github.com/dabeng/OrgChart/issues/152))
(3) 此外,如果你想導出成pdf文件, 請先引入[jspdf](https://github.com/MrRio/jsPDF)到項目中,然後設置"exportFileextension"選項爲"pdf"。
- [我想把地理信息集成到組織結構圖裏](https://dabeng.github.io/OrgChart/integrate-map.html)
這裏,我們需要求助于[OpenLayers](https://github.com/openlayers/ol3)。
- [我想編輯組織結構圖的節點或者某個分支](https://dabeng.github.io/OrgChart/edit-chart.html)
本插件中暴露來若幹方法--addParent(), addSiblings(), addChildren(), removeNodes(),可以幫助開發者很方便的實現上述需求。
- [我想通過拖放的方式來改變組織結構圖的結構](https://dabeng.github.io/OrgChart/drag-drop.html)
一旦啓用了"draggable"選項,我們就可以通過拖放來改變組織結構圖的層次結構了。但是注意,這個特性在IE浏覽器上不工作。後續地,我們還可以利用dropCriteria選項,來定制更細致的拖放限制准則。默認情況下,插件只提供了一條限制准則--不能直接把父節點放到它的子節點裏。
- [我希望這個插件能提供給一個方法,調用它返回給我一個結果,該結果能描述出當前組織結構圖的層次結構](https://dabeng.github.io/OrgChart/get-hierarchy.html)
我們有個getHierarchy()方法,專門幹這事。
- [我想渲染一個顔色編碼的組織結構圖](https://dabeng.github.io/OrgChart/color-coded.html)
我們只需要把css的樣式與數據源中的id字段或css類字段關聯起來就好。
- [我想構造一個混合布局的(水平方向 + 垂直方向)組織結構圖](https://dabeng.github.io/OrgChart/vertical-level.html)
這個特性的靈感來源于這兩個話題的討論--[Aligning Children Vertical](https://github.com/dabeng/OrgChart/issues/46), [Hybrid(horizontal + vertical) OrgChart](https://github.com/dabeng/OrgChart/issues/61)。感謝[mfahadi](https://github.com/mfahadi)和[Destructrix](https://github.com/Destructrix)建設性的討論:blush:尤其感謝[tedliang](https://github.com/tedliang)提供了非常棒的混合布局的解決方案。
- [我想在組織結構圖初始化時,就默認折疊掉若幹節點(不限時這些節點的子節點)](https://dabeng.github.io/OrgChart/default-collapsed.html)
這個好辦。在數據源中,給父節點追加`'collapsed': true`,給子節點追加`'className': 'slide-up'`。
- [基于初始的數據源和options實例化組織結構圖之後,如果我還想變更某些option或者改動原始的數據源,然後讓組織結構圖基于這些變更刷新](https://dabeng.github.io/OrgChart/reload-data.html)
我們暴露了init()方法幫你完成上述任務,把新的option傳到init()方法裏就好了。
- [我想自己定制節點的內部結構,而非只是”名字和職位“的簡單構成](https://dabeng.github.io/OrgChart/custom-template.html)
沒問題,我們推薦使用ES6的模版字符串。
- [我想將節點安置在特定的層級。 咋做 ?](https://dabeng.github.io/OrgChart/level-offset.html)
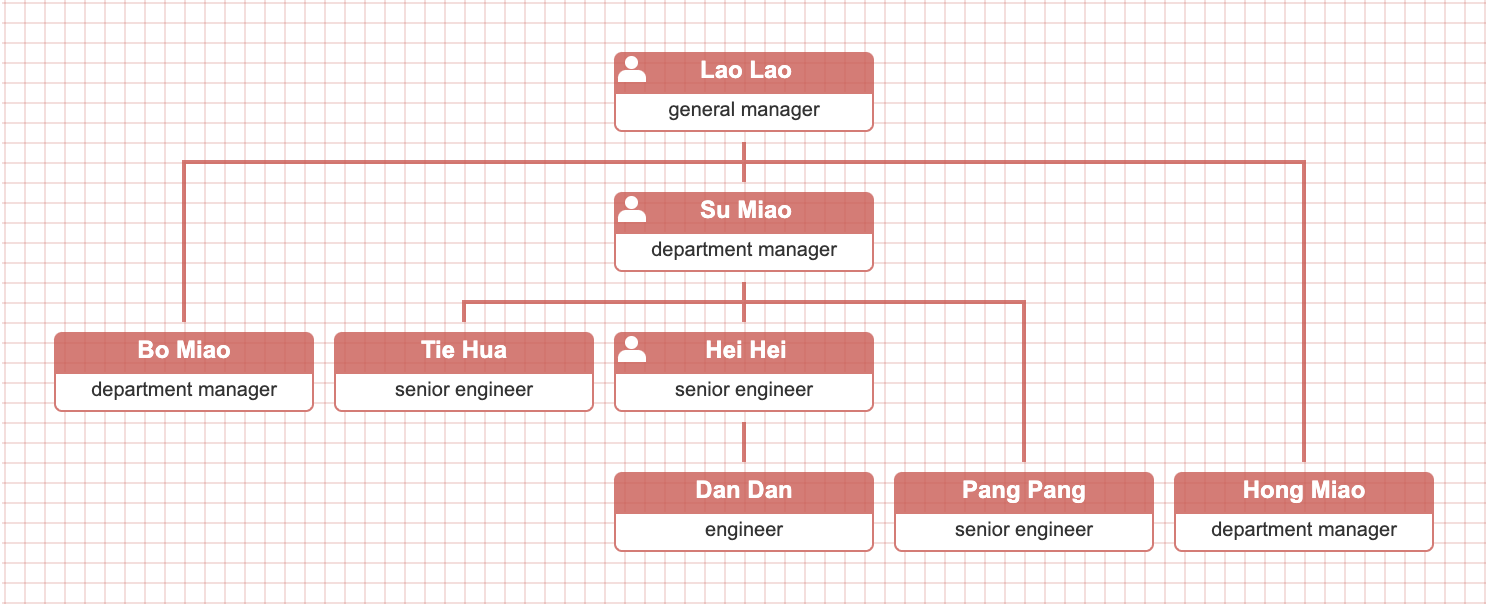
你需要的是一個復合的解決方案: **levelOffset data prop** + callback createNode() + CSS custom properties(variables)
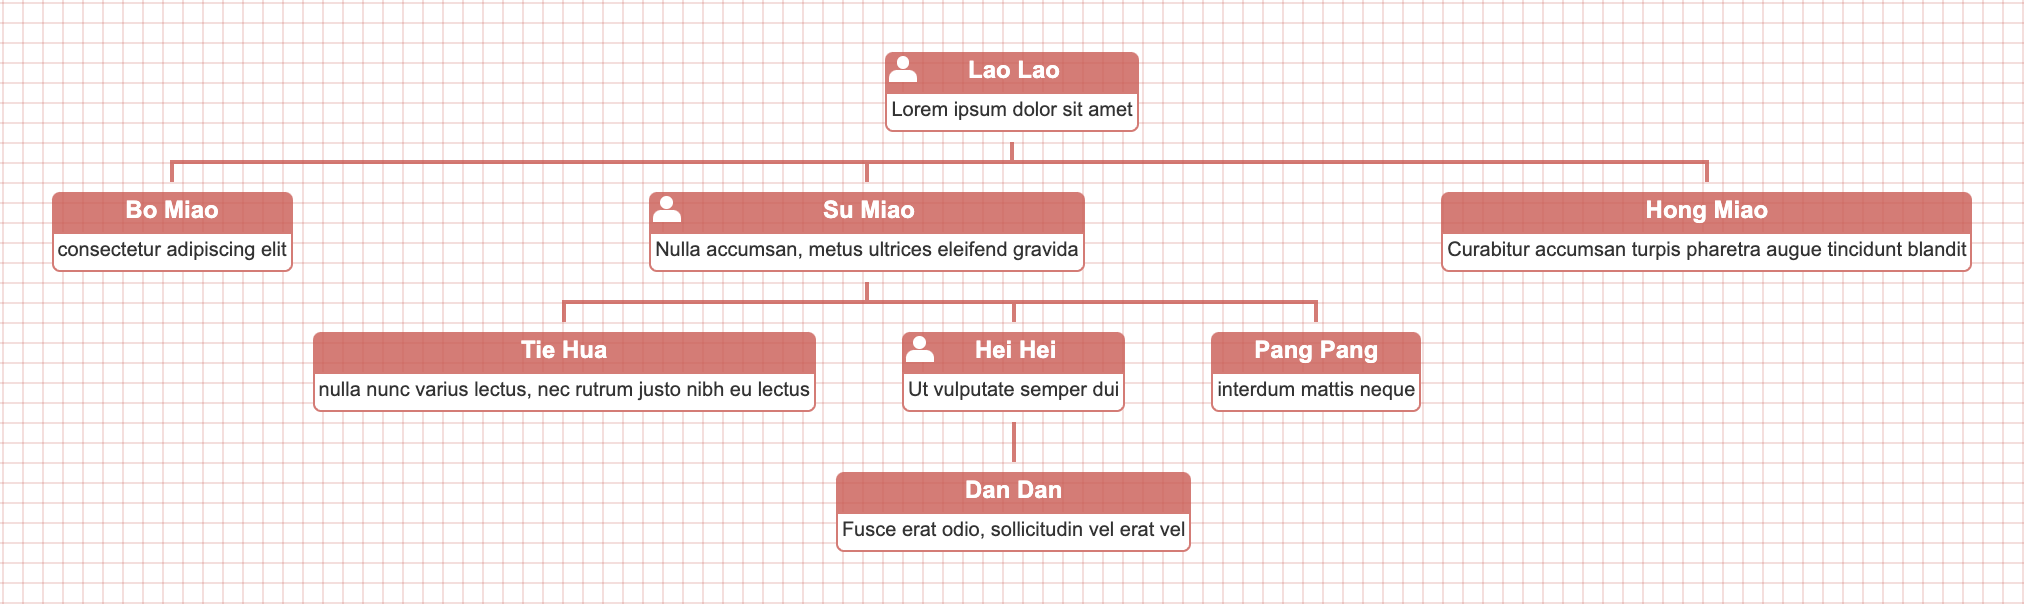
- [我想構造一個組織結構圖,每個節點寬度都可以不同的](https://dabeng.github.io/OrgChart/nodes-of-different-widths.html)
- [我想在混合布局中實現拖/放功能](https://dabeng.github.io/OrgChart/drag-drop-hybrid-chart.html)
- [我想指定從某一分支開始,其下所有子節點都以垂直樣式顯示](https://dabeng.github.io/OrgChart/data-prop-hybrid.html)
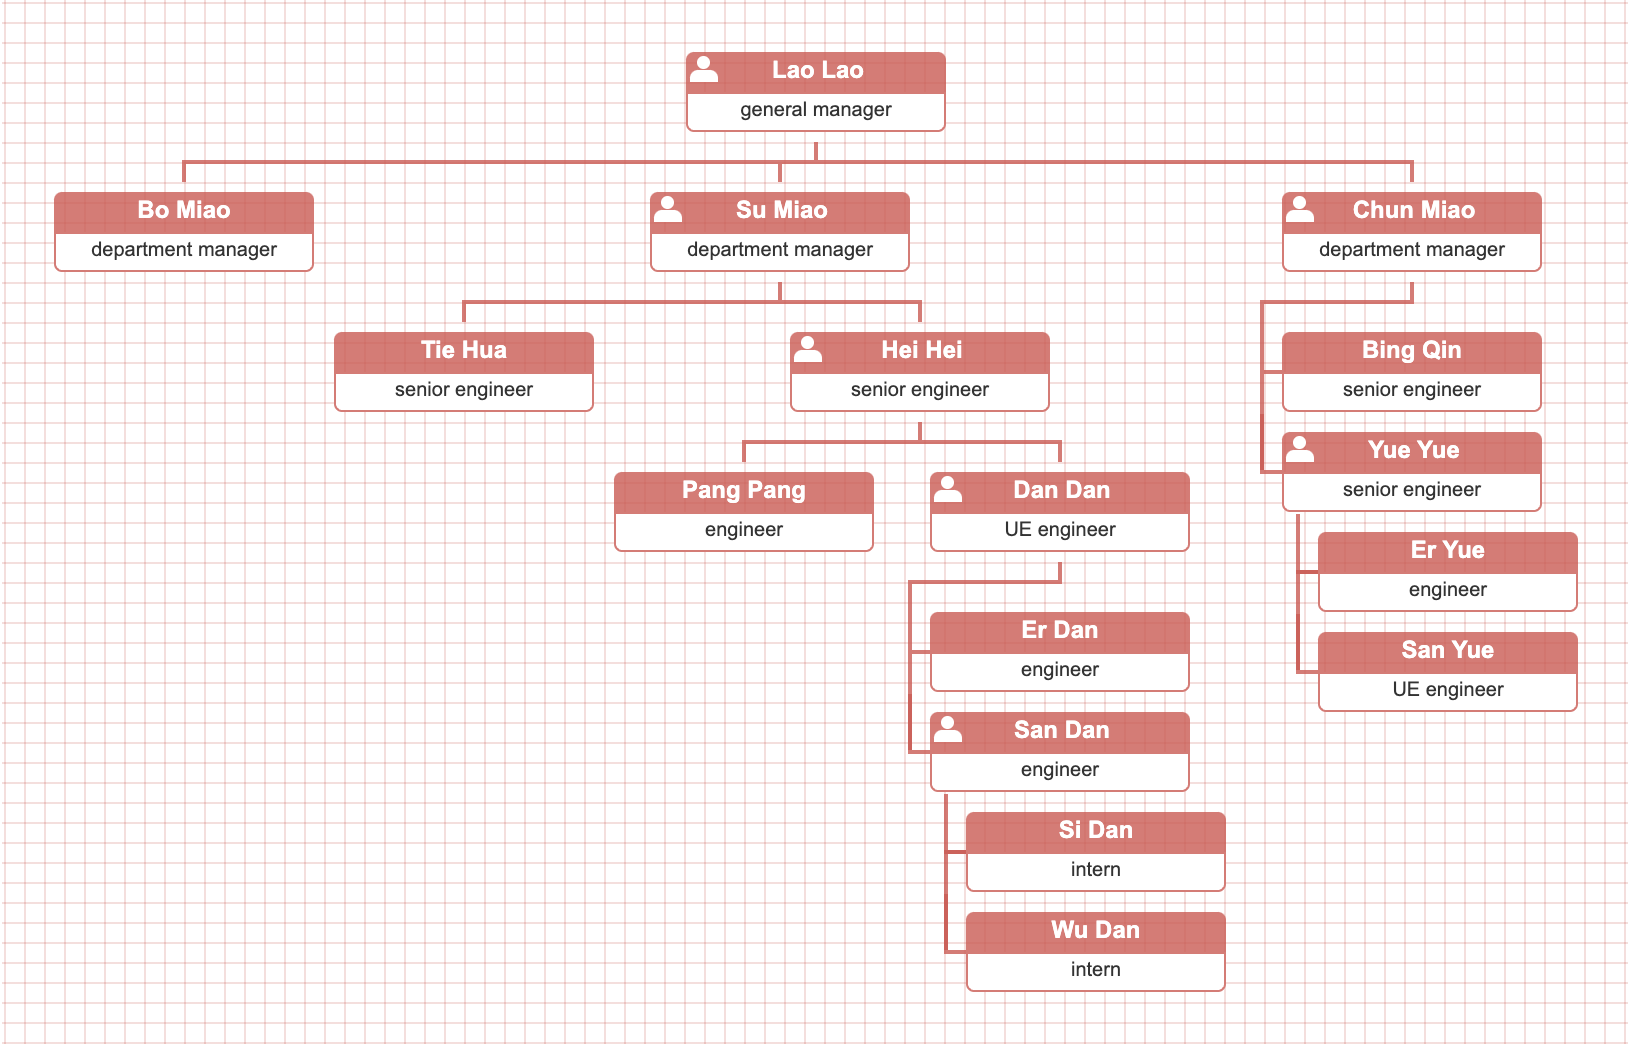
**hybrid data property** 就派上用場了。 在數據源的某個節點中提供"hybrid"屬性,那麽它的所有後代節點都會垂直布局。
- [我想用Font Awesome圖標代替內置的圖標](https://dabeng.github.io/OrgChart/custom-icons.html)
- [子節點眾多的時候,我想以一種壓縮起來的展示方式盡可能節省空間](https://dabeng.github.io/OrgChart/data-prop-compact.html)
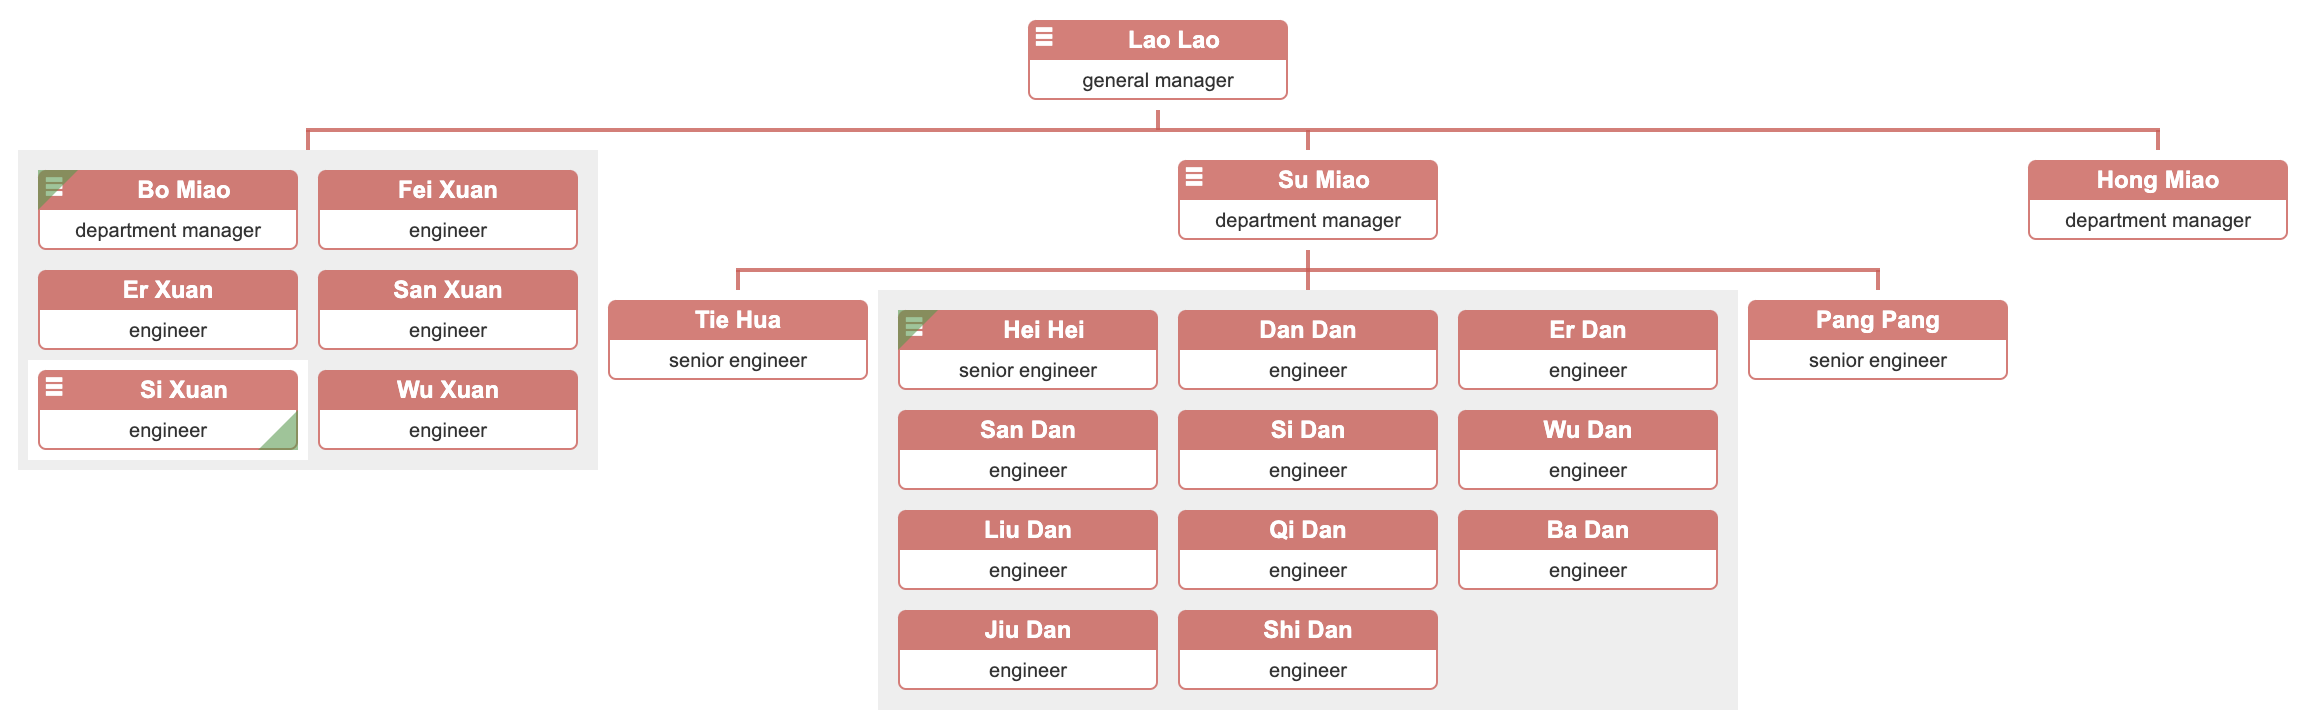
**compact data property** 就派上用場了。在數據源的某個節點裏提供了"compact"屬性,並賦為真值,那麽它和它的子節點就會展示為壓縮模式。
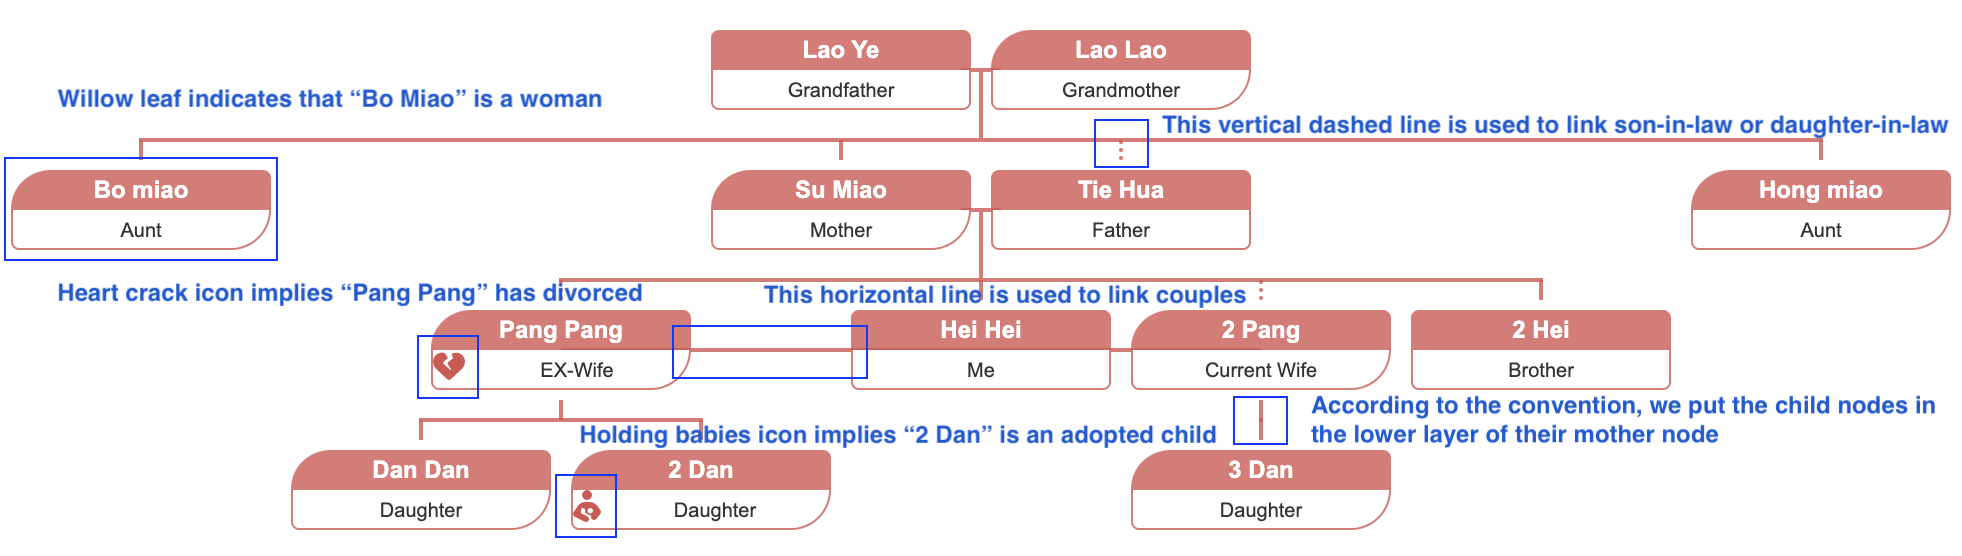
- [我想構造族譜,家譜,宗譜的關系圖](https://dabeng.github.io/OrgChart/family-tree.html)

我們使用如下的二維數組數據源來構建家譜。“outsider”代表外姓人。
```
var datascource = [
[
{ 'id': '8', 'name': 'Lao Ye', 'title': 'Grandfather' },
{
'id': '1', 'name': 'Lao Lao', 'title': 'Grandmother', 'outsider': true,
'children': [
[
{ 'id': '2', 'name': 'Bo miao', 'title': 'Aunt' }
],
[
{ 'id': '3', 'name': 'Su Miao', 'title': 'Mother',
'children': [
[
{ 'id': '12', 'name': 'Pang Pang', 'title': 'Wife', 'outsider': true,
'children': [
[{ 'id': '7', 'name': 'Dan Dan', 'title': 'Daughter' }],
[{ 'id': '6', 'name': 'Er Dan', 'title': 'Daughter' }],
]
},
{ 'id': '5', 'name': 'Hei Hei', 'title': 'Me' },
]
]
},
{ 'id': '9', 'name': 'Tie Hua', 'title': 'Father', 'outsider': true }
],
[
{ 'id': '10', 'name': 'Hong miao', 'title': 'Aunt' }
]
]
}
]
];
```
- [我想往族譜裏追加一些自定義的標識](https://dabeng.github.io/OrgChart/familytree-custom-properties.html)
- [我想通過小地圖導航組織結構圖](https://dabeng.github.io/OrgChart/minimap.html)
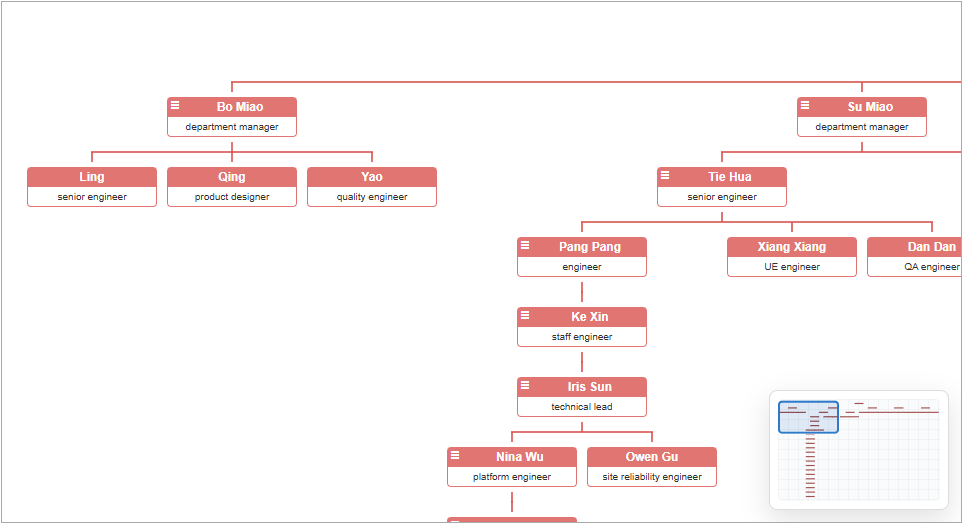
啓用 `minimap` 選項即可顯示概覽導航器。拖動其中的視口可以移動組織結構圖,在小地圖上滾動鼠標滾輪可以縮放。
### 本地運行orgchart
- 必須安裝node.js v6+,因爲我們的單元測試是基于jsdom v11。
- 必須安裝現代浏覽器(忽略IE浏覽器)。因爲orgchart插件幾乎所有的行爲和特性都是基于HTML5和CSS3環境下開發與測試的。
- 運行命令 `npm install`來安裝必要的依賴。
- 運行命令`npm test`來跑所有的測試(單元測試,集成測試,端到端測試,以及視覺回歸測試)
- 運行命令`npm run build`來生成生産版本的js,css文件。
- 運行命令`npm start`來啓動本地web server,在這個地址http://localhost:3000 上查看滿足不同場景需求的Demo。
## 使用
### 實例化組織結構圖
```js
var oc = new OrgChart({
chartContainer: '#chartContainerId',
data: datasource
});
```
### 數據源示例
```js
{
'id': 'rootNode', // 可選屬性。將來插件會基于它,創建節點的id,data-parent(當前節點的父節點的id屬性)等特性
'collapsed': true, // 默認初始化時,當前節點處于折疊狀態,其子節點不顯示
'className': 'top-level', // 可選屬性。將來組件會把它的值追加到節點的CSS 類中
'nodeTitle': 'name', // 可選屬性。插件會以該屬性的值爲屬性,
// 來檢索數據源,然後渲染默認結構樣式的節點的上半部分
'nodeContent': 'title', // 可選屬性。插件會以該屬性的值爲屬性,
// 來檢索數據源,然後渲染默認結構樣式的節點的下半部分
'relationship': relationshipValue, // 注意:當你激活按需載入節點特性時
// 你應該使用JSON數據源(不論本地或遠程)並設置本屬性
// 本屬性標識當前節點是否具有父節點,兄弟節點,子節點
// relationshipValue的值是由“0”或“1”組成的長度爲3的字符串
// 第1個字符代表當前節點是否具有父節點
// 第2個字符代表當前節點是否具有兄弟節點
// 第三個字符代表當前節點是否具有孩子節點
'children': [ // The property stands for nested nodes.
{ 'name': 'Bo Miao', 'title': 'department manager', 'relationship': '110' },
{ 'name': 'Su Miao', 'title': 'department manager', 'relationship': '111',
'children': [
{ 'name': 'Tie Hua', 'title': 'senior engineer', 'relationship': '110' },
{ 'name': 'Hei Hei', 'title': 'senior engineer', 'relationship': '110' }
]
},
{ 'name': 'Yu Jie', 'title': 'department manager', 'relationship': '110' }
],
'otherPro': anyValue // 數據源中可以追加任意其他字段,只要你覺得
// 在之後的渲染和操作組織結構圖時派得上用場
};
```
### 選項
<table>
<thead>
<tr>
<th>名稱</th>
<th>類型</th>
<th>必填</th>
<th>默認值</th>
<th>描述</th>
</tr>
</thead>
<tbody>
<tr>
<td>data</td>
<td>json / HTMLUListElement</td>
<td>是</td>
<td></td>
<td>用于構造組織結構圖的數據源。它的值可以是JSON或能提供數據的ul元素。</td>
</tr>
<tr>
<td>pan</td>
<td>boolean</td>
<td>否</td>
<td>false</td>
<td>啓用本選項,用戶可以通過鼠標拖拽組織結構圖。</td>
</tr>
<tr>
<td>zoom</td>
<td>boolean</td>
<td>否</td>
<td>false</td>
<td>啓動本選項,用戶可以通過鼠標滾輪或觸摸板對組織結構圖進行縮放。</td>
</tr>
<tr>
<td>zoominLimit</td>
<td>number</td>
<td>否</td>
<td>7</td>
<td>放大的上限值</td>
</tr>
<tr>
<td>zoomoutLimit</td>
<td>number</td>
<td>否</td>
<td>0.5</td>
<td>縮小的下限值</td>
</tr>
<tr>
<td>direction</td>
<td>string</td>
<td>否</td>
<td>"t2b"</td>
<td>該選項用來設置布局方向。"t2b"代表從上到下,是默認值。"b2t"代表從下到上。"l2r"代表從左到右。"r2l"代表從右到左。</td>
</tr>
<tr>
<td>verticalLevel</td>
<td>integer(>=2)</td>
<td>否</td>
<td></td>
<td>表示組織結構圖從哪一層開始,從水平布局節點轉變爲垂直布局節點。</td>
</tr>
<tr>
<td>toggleSiblingsResp</td>
<td>boolean</td>
<td>否</td>
<td>false</td>
<td>啓動該選項,用戶點擊了節點的兩側箭頭按鈕時,會展開/折疊一側的兄弟節點;默認的行爲是用戶點擊了節點任何一側的箭頭按鈕,都會折疊起所有的兄弟節點,不區分左右。</td>
</tr>
<tr>
<td>visibleLevel</td>
<td>positive integer</td>
<td>否</td>
<td>999</td>
<td>該選項爲用戶指定初始化組織結構圖時,可見的展開的層級是多少</td>
</tr>
<tr>
<td>nodeTitle</td>
<td>string</td>
<td>否</td>
<td>"name"</td>
<td>將默認節點結構中的標題部分關聯到數據源中的一個屬性</td>
</tr>
<tr>
<td>parentNodeSymbol</td>
<td>string</td>
<td>否</td>
<td>"oci-leader"</td>
<td>爲所有父節點的icon標識指定CSS類名</td>
</tr>
<tr>
<td>nodeContent</td>
<td>string</td>
<td>否</td>
<td></td>
<td>將默認節點結構中的內容部分關聯到數據源中的一個屬性</td>
</tr>
<tr>
<td>nodeId</td>
<td>string</td>
<td>no</td>
<td>"id"</td>
<td>選取一個數據源中的字段作爲組織結構圖中的每個節點的唯一標識</td>
</tr>
<tr>
<td>nodeTemplate</td>
<td>function</td>
<td>否</td>
<td></td>
<td>應該爲該選項提供一個節點結構模版生成函數,該函數只接收一個參數,就是涵蓋子樹渲染的數據源片段。</td>
</tr>
<tr>
<td>createNode</td>
<td>function</td>
<td>否</td>
<td></td>
<td>爲該選項提供的函數,會在默認節點結構創建完畢後調用。利用傳入的兩個參數--"node"和"data",可以幫助開發者定制或改動現有的節點結構。</td>
</tr>
<tr>
<td>exportButton</td>
<td>boolean</td>
<td>否</td>
<td>false</td>
<td>啓用該選項,插件會追加“導出”按鈕到組織結構圖的容器DIV裏。</td>
</tr>
<tr>
<td>exportButtonName</td>
<td>string</td>
<td>否</td>
<td>"Export"</td>
<td>導出按鈕的名字。</td>
</tr>
<tr>
<td>exportFilename</td>
<td>string</td>
<td>否</td>
<td>"Orgchart"</td>
<td>導出文件的文件名。</td>
</tr>
<tr>
<td>exportFileextension</td>
<td>string</td>
<td>否</td>
<td>"png"</td>
<td>導出文件的擴展名。</td>
</tr>
<tr>
<td>chartClass</td>
<td>string</td>
<td>否</td>
<td>""</td>
<td>通過指定該選項,來給組織結構圖追加自定義的CSSl類名,尤其是在你的組織結構圖容器中要承載奪冠chart的時候,這個選項就顯得很重要了。</td>
</tr>
<tr>
<td>draggable</td>
<td>boolean</td>
<td>否</td>
<td>false</td>
<td>啓用該選項,用戶就可以拖放節點的方式改變組織結構圖的結構了。**注意:**將當前的某個父節點拖放到其下面的某個子節點裏,這樣的操作是不允許的。因爲如果插件順從了這樣的操作,會産生孤立的子樹;本選項在IE浏覽器上不可用。</td>
</tr>
<tr>
<td>dropCriteria</td>
<td>function</td>
<td>否</td>
<td></td>
<td>用戶可以通過該選項定制更細致的拖放節點的限制准則。你需要爲該選項提供一個返回boolean值的函數,該函數用來判斷當拖放操作結束時,是否允許將當前拖拽的節點從拖動區域摘出來插入到松放區域裏。該函數接受3個參數--draggedNode, dragZone, dropZone。</td>
</tr>
<tr>
<td>initCompleted</td>
<td>function</td>
<td>否</td>
<td></td>
<td>組織結構圖初始化完成後,該選項指定的回調函數被觸發。該函數接受一個參數--"chart", 即初始化後的組織結構圖元素。</td>
</tr>
</tbody>
</table>
### 方法
使用 `new OrgChart(options)` 建立實例。`chartContainer` 和 `chart` 屬性分別提供原生容器元素與已渲染的組織結構圖元素。
```js
const oc = new OrgChart({ chartContainer: '#chartContainerId', data: datasource });
```
公開 API 包括:`init`、`setOptions`、`attachMinimap`、`detachMinimap`、`updateMinimap`、`addAncestors`、`addDescendants`、`addParent`、`addSiblings`、`addChildren`、`removeNodes`、`getHierarchy`、`getNodeState`、`getParent`、`getChildren`、`getSiblings`、`getRelatedNodes`、`hideParent`、`showParent`、`hideChildren`、`showChildren`、`hideSiblings`、`showSiblings`、`setChartScale`、`export`、`exportPNG` 和 `exportPDF`。其中節點和圖表參數均為原生 `HTMLElement`。
#### API 參考
| 呼叫 | 參數 | 回傳值與呼叫行為 |
| --- | --- | --- |
| `oc.init(options)` | 部分選項物件;傳入 `data` 可替換資料來源。 | 重新建立圖表並回傳 `oc`。 |
| `oc.setOptions(options)`<br>`oc.setOptions(name, value)` | 包含 `data`、`pan`、`zoom` 或 `minimap` 的物件;或受支援的選項名稱及布林值。 | `data` 會重建圖表,其他選項切換相應功能;回傳 `oc`。 |
| `oc.attachMinimap()`<br>`oc.detachMinimap()`<br>`oc.updateMinimap(forceRefresh)` | `forceRefresh` 可選;傳入 `true` 會重繪節點預覽。 | 建立、移除或刷新小地圖。一般啟用應使用 `setOptions('minimap', value)`。 |
| `oc.addAncestors(data, parentId)` | 祖先資料,以及接收原根節點的祖先節點 id。 | 插入祖先層級;無回傳值。 |
| `oc.addDescendants(data, parent)` | 後代資料陣列和已渲染的父 `.node`。 | 附加後代層級;無回傳值。 |
| `oc.addParent(currentRoot, data)` | 已渲染的根 `.node` 和新父節點資料。 | 用新父節點包裹目前根;無回傳值。 |
| `oc.addSiblings(node, data)`<br>`oc.addChildren(node, data)` | 已渲染的 `.node` 和兄弟節點或子節點資料陣列。 | 增加渲染節點;無回傳值。 |
| `oc.removeNodes(node)` | 要刪除的已渲染 `.node`。 | 刪除該節點及其後代;無回傳值。 |
| `oc.getHierarchy(includeNodeData)` | 可選布林值,預設 `false`。 | 回傳層級物件;圖表或必要節點 id 不可用時回傳錯誤字串。 |
| `oc.getNodeState(node, relation)` | 已渲染 `.node`;`relation` 為 `parent`、`children` 或 `siblings`。 | 回傳 `{ exist, visible }`。 |
| `oc.getParent(node)` | 已渲染 `.node`。 | 回傳父 `.node`,不存在時回傳 `null`。 |
| `oc.getChildren(node)`<br>`oc.getSiblings(node)` | 已渲染 `.node`。 | 回傳直接子節點或兄弟節點 `.node` 元素陣列。 |
| `oc.getRelatedNodes(node, relation)` | 已渲染 `.node`;`relation` 為 `parent`、`children` 或 `siblings`。 | 通用關聯查詢;parent 回傳節點或 `null`,其他關係回傳陣列。 |
| `oc.hideParent(node)` / `oc.showParent(node)`<br>`oc.hideChildren(node)` / `oc.showChildren(node)` | 已渲染 `.node`。 | 透過圖表過渡隱藏或顯示關聯分支;無回傳值。 |
| `oc.hideSiblings(node, direction)`<br>`oc.showSiblings(node, direction)` | 已渲染 `.node`;可選 `direction` 為 `left` 或 `right`。 | 隱藏或顯示指定一側的兄弟節點;省略方向時處理全部兄弟節點;無回傳值。 |
| `oc.setChartScale(chart, multiplier, zoomAnchor)` | 通常傳入 `oc.chart`;正數的相對縮放倍數;可選視口座標 `{ x, y }`。 | 在配置的縮放範圍內縮放,提供 `zoomAnchor` 時固定該點。 |
| `oc.export(filename, extension)` | 可選檔案名稱和 `png` 或 `pdf` 副檔名。 | 按配置預設值開始匯出;無法匯出時回傳 `false`。 |
| `oc.exportPNG(canvas, filename)`<br>`oc.exportPDF(canvas, filename, exportScale)` | 已準備的 canvas、檔案名稱;PDF 縮放預設 `1`。 | 將傳入 canvas 直接下載為 PNG 或 PDF;通常應呼叫 `export()`。 |
#### init(newOptions)
當你想基于新的options或數據源刷新組織結構圖時,這個方法就派上用場了。
#### setOptions(options) / setOptions(name, value)
無需重新建立圖表即可更新 `pan`、`zoom` 或 `minimap`。可傳入選項物件,或傳入支援的選項名稱和布林值;傳入包含 `data` 的物件時會重新建立圖表。
#### attachMinimap() / detachMinimap()
建立或移除目前圖表的小地圖覆蓋層。通常應使用 `setOptions('minimap', true|false)`,以確保選項狀態和覆蓋層保持同步。
#### updateMinimap(forceRefresh)
在修改圖表變換或版面配置後重新計算小地圖視口。傳入 `true` 會重繪小地圖中的節點預覽。
#### addAncestors(data, parentId)
爲當前的組織結構圖增加祖先節點,可以不止壹個層級。
<table>
<thead>
<tr>
<th>名稱</th>
<th>類型</th>
<th>必填</th>
<th>默認值</th>
<th>描述</th>
</tr>
</thead>
<tbody>
<tr>
<td>data</td>
<td>json</td>
<td>是</td>
<td></td>
<td>用于構造祖先節點的數據源</td>
</tr>
<tr>
<td>parentId</td>
<td>string</td>
<td>yes</td>
<td></td>
<td>將當前的組織結構圖追加到某壹個祖先節點裏,該節點的id</td>
</tr>
</tbody>
</table>
#### addDescendants(data, parent)
爲指定的父節點增加後代節點。
<table>
<thead>
<tr>
<th>名稱</th>
<th>類型</th>
<th>必填</th>
<th>默認值</th>
<th>描述</th>
</tr>
</thead>
<tbody>
<tr>
<td>data</td>
<td>array</td>
<td>yes</td>
<td></td>
<td>用于構造後代節點的數據源</td>
</tr>
<tr>
<td>parent</td>
<td>HTMLElement</td>
<td>yes</td>
<td></td>
<td>後代節點要追加到的父節點對象</td>
</tr>
</tbody>
</table>
#### addParent(currentRoot, data)
爲當前的組織結構圖增加父節點。
<table>
<thead>
<tr>
<th>名稱</th>
<th>類型</th>
<th>必填</th>
<th>默認值</th>
<th>描述</th>
</tr>
</thead>
<tbody>
<tr>
<td>currentRoot</td>
<td>HTMLElement</td>
<td>是</td>
<td></td>
<td>當前組織結構圖的根節點,新父節點會包裹這個根節點</td>
</tr>
<tr>
<td>data</td>
<td>json object</td>
<td>是</td>
<td></td>
<td>構造根節點的數據源</td>
</tr>
</tbody>
</table>
#### addSiblings(node, data)
爲指定的節點增加兄弟節點。
<table>
<thead>
<tr>
<th>名稱</th>
<th>類型</th>
<th>必填</th>
<th>默認值</th>
<th>描述</th>
</tr>
</thead>
<tbody>
<tr>
<td>node</td>
<td>HTMLElement</td>
<td>是</td>
<td></td>
<td>基于該節點增加其兄弟節點</td>
</tr>
<tr>
<td>data</td>
<td>array</td>
<td>是</td>
<td></td>
<td>用于構造兄弟節點的數據源</td>
</tr>
</tbody>
</table>
#### addChildren(node, data)
爲指定的節點增加孩子節點。
<table>
<thead>
<tr>
<th>名稱</th>
<th>類型</th>
<th>必填</th>
<th>默認值</th>
<th>描述</th>
</tr>
</thead>
<tbody>
<tr>
<td>node</td>
<td>HTMLElement</td>
<td>是</td>
<td></td>
<td>基于該節點增加其孩子節點</td>
</tr>
<tr>
<td>data</td>
<td>array</td>
<td>是</td>
<td></td>
<td>構造孩子節點的數據源</td>
</tr>
</tbody>
</table>
#### removeNodes(node)
刪除指定的節點及其後代節點。
<table>
<thead>
<tr>
<th>名稱</th>
<th>類型</th>
<th>必填</th>
<th>默認值</th>
<th>描述</th>
</tr>
</thead>
<tbody>
<tr>
<td>node</td>
<td>HTMLElement</td>
<td>是</td>
<td></td>
<td>待刪除的節點。</td>
</tr>
</tbody>
</table>
#### getHierarchy()
這個方法被設計用來提供組織結構圖的層次結構關系。舉個例子,當你采取某種手段對當前的組織結構圖的結構進行了改動後,可以調用本方法獲得最新的結構,並將其保存到後台。
<table>
<tr>
<th>名稱</th>
<th>類型</th>
<th>必填</th>
<th>默認值</th>
<th>描述</th>
</tr>
<tr>
<td>includeNodeData</td>
<td>Boolean</td>
<td>否</td>
<td>false</td>
<td>如果傳入的該參數爲true,那麽導出的層次結構對象中就加入nodeData數據。</td>
</tr>
</table>
#### hideParent(node)
隱藏指定節點的父節點。當然其兄弟節點及祖先節點也一並隱藏了。
<table>
<tr>
<th>名稱</th>
<th>類型</th>
<th>必填</th>
<th>默認值</th>
<th>描述</th>
</tr>
<tr>
<td>node</td>
<td>HTMLElement</td>
<td>Yes</td>
<td>None</td>
<td>指定節點元素。</td>
</tr>
</table>
#### showParent(node)
顯示指定節點的父節點。但不包括更上一層的祖先節點。
<table>
<tr>
<th>名稱</th>
<th>類型</th>
<th>必填</th>
<th>默認值</th>
<th>描述</th>
</tr>
<tr>
<td>node</td>
<td>HTMLElement</td>
<td>是</td>
<td></td>
<td>指定節點元素。</td>
</tr>
</table>
#### hideChildren(node)
隱藏指定節點的孩子節點。當然這其中包含了所有的後代節點。
<table>
<tr>
<th>名稱</th>
<th>類型</th>
<th>必填</th>
<th>默認值</th>
<th>描述</th>
</tr>
<tr>
<td>node</td>
<td>HTMLElement</td>
<td>是</td>
<td></td>
<td>指定節點元素。</td>
</tr>
</table>
#### showChildren(node)
顯示指定節點的孩子節點。默認只顯示緊鄰的下一個層級,並不包括所有的後代節點。
<table>
<tr>
<th>名稱</th>
<th>類型</th>
<th>必填</th>
<th>默認值</th>
<th>描述</th>
</tr>
<tr>
<td>node</td>
<td>HTMLElement</td>
<td>是</td>
<td></td>
<td>指定節點元素。</td>
</tr>
</table>
#### hideSiblings(node, direction)
隱藏指定節點的兄弟節點。
<table>
<tr>
<th>名稱</th>
<th>類型</th>
<th>必填</th>
<th>默認值</th>
<th>描述</th>
</tr>
<tr>
<td>node</td>
<td>HTMLElement</td>
<td>是</td>
<td></td>
<td>指定節點元素。</td>
</tr>
<tr>
<td>direction</td>
<td>string</td>
<td>否</td>
<td></td>
<td>可供選擇的值有"left"和"rigth". 如果指定某一側,就只隱藏某一側的兄弟節點。如果不提供該參數,就隱藏所有的兄弟節點</td>
</tr>
</table>
#### showSiblings(node, direction)
顯示指定節點的兄弟節點。
<table>
<tr>
<th>名稱</th>
<th>類型</th>
<th>必填</th>
<th>默認值</th>
<th>描述</th>
</tr>
<tr>
<td>node</td>
<td>HTMLElement</td>
<td>是</td>
<td></td>
<td>指定節點元素。</td>
</tr>
<tr>
<td>direction</td>
<td>string</td>
<td>否</td>
<td></td>
<td>可供選擇的值有"left"和"rigth". 如果指定某一側,就只顯示某一側的兄弟節點。如果不提供該參數,就顯示所有的兄弟節點</td>
</tr>
</table>
#### getNodeState(node, relation)
該方法幫你了解指定節點的相關節點的顯示狀況。
<table>
<tr>
<th>名稱</th>
<th>類型</th>
<th>必填</th>
<th>默認值</th>
<th>描述</th>
</tr>
<tr>
<td>node</td>
<td>HTMLElement</td>
<td>是</td>
<td></td>
<td>指定節點元素。</td>
</tr>
<tr>
<td>relation</td>
<td>String</td>
<td>是</td>
<td></td>
<td>可選的值有--"parent", "children" 和 "siblings"。 指定明確的關系,然後本方法返回給你相關節點的顯示狀態。</td>
</tr>
</table>
本方法的返回對象的結構如下:
```js
{
"exist": true|false, // 標識你想了解的父節點,孩子節點,兄弟節點是否存在
"visible":true|false, // 標識相關節點當前是否可見
}
```
#### getRelatedNodes(node, relation)
獲得指定節點的關聯節點。
<table>
<tr>
<th>名稱</th>
<th>類型</th>
<th>必填</th>
<th>默認值</th>
<th>描述</th>
</tr>
<tr>
<td>node</td>
<td>HTMLElement</td>
<td>是</td>
<td></td>
<td>指定節點元素。</td>
</tr>
<tr>
<td>relation</td>
<td>String</td>
<td>是</td>
<td></td>
<td>可選的值有--"parent", "children" 和 "siblings"。用來指定具體的關系。</td>
</tr>
</table>
#### getParent(node)
回傳指定節點的父節點;如果不存在父節點,則回傳 `null`。
#### getChildren(node)
回傳指定節點的直接子節點陣列。回傳值中的每一項都是原生 `HTMLElement`。
#### getSiblings(node)
回傳指定節點的兄弟節點陣列。回傳值中的每一項都是原生 `HTMLElement`。
#### setChartScale(chart, newScale, zoomAnchor)
用這個方法可以幫你爲指定的組織結構圖設置新的scale系數。
`zoomAnchor` 為可選參數,格式為視口座標 `{ x, y }`。提供該參數後,縮放時會固定該座標點。
<table>
<tr>
<th>名稱</th>
<th>類型</th>
<th>必填</th>
<th>默認值</th>
<th>描述</th>
</tr>
<tr>
<td>chart</td>
<td>HTMLElement</td>
<td>是</td>
<td>None</td>
<td>組織結構圖容器中的某一個圖。</td>
</tr>
<tr>
<td>newScale</td>
<td>Float</td>
<td>是</td>
<td>None</td>
<td>用于縮放組織結構圖的縮放系數。</td>
</tr>
</table>
#### export(exportFilename, exportFileextension)
將當前的組織結構圖導出爲png圖片或pdf文檔。
<table>
<tr>
<th>名稱</th>
<th>類型</th>
<th>必填</th>
<th>默認值</th>
<th>描述</th>
</tr>
<tr>
<td>exportFilename</td>
<td>String</td>
<td>否</td>
<td>'OrgChart'</td>
<td>導出文件的文件名。</td>
</tr>
<tr>
<td>exportFileextension</td>
<td>String</td>
<td>否</td>
<td>'png'</td>
<td>導出文件的擴展名</td>
</tr>
</table>
#### exportPNG(canvas, exportFilename)
將準備好的 canvas 匯出為 PNG 下載。當應用程式自行提供 canvas 時可直接呼叫;大多數情境應使用 `export()`。
#### exportPDF(canvas, exportFilename, exportScale)
將準備好的 canvas 匯出為 PDF 下載。`exportScale` 是 canvas 的渲染縮放比例,用於保持 PDF 的邏輯尺寸;大多數情境應使用 `export()`。
### 事件
OrgChart 會派發可冒泡的原生 `CustomEvent`。請使用 `addEventListener` 訂閱,事件參數位於 `event.detail`。
```js
oc.chart.addEventListener('nodedrop.orgchart', function (event) {
const { draggedNode, dragZone, dropZone } = event.detail;
});
```
<table>
<thead>
<tr>
<th>類型</th>
<th>附帶參數</th>
<th>描述</th>
</tr>
</thead>
<tbody>
<tr>
<td>nodedrop.orgchart</td>
<td><code>event.detail</code>: draggedNode, dragZone, dropZone</td>
<td>在節點移動前於圖表元素上觸發。呼叫 <code>event.preventDefault()</code> 可取消本次拖放。</td>
</tr>
<tr>
<td>otherdropped.orgchart</td>
<td><code>event.detail</code>: draggedItem, dropZone</td>
<td>非 OrgChart 的可拖放項目被放到節點上時,於圖表元素上觸發。</td>
</tr>
<tr>
<td>init.orgchart</td>
<td>無;<code>event.target</code> 為圖表元素</td>
<td>圖表渲染完成後觸發。</td>
</tr>
<tr>
<td>show-[relation].orgchart</td>
<td></td>
<td>關聯節點顯示時在該節點上觸發;<code>relation</code> 為 parent、children 或 siblings。</td>
</tr>
<tr>
<td>hide-[relation].orgchart</td>
<td></td>
<td>關聯節點隱藏時在該節點上觸發;<code>relation</code> 為 parent、children 或 siblings。</td>
</tr>
</tbody>
</table>
### Tips
#### 默認的展開/折疊節點功能雖然很好,但是我想禁掉它,咋辦?
關于這個需求的展開討論可以看這個[問題](https://github.com/dabeng/OrgChart/issues/25)。感謝[der-robert](https://github.com/der-robert)和[ActiveScottShaw](https://github.com/ActiveScottShaw)的非常有建設性的討論:blush:
我們提供了一個CSS類"noncollapsable",可以方便地完成這件事。
```js
oc.chart.classList.add('noncollapsable'); // 禁掉展開/折疊
oc.chart.classList.remove('noncollapsable'); // 開啓展開/折疊
```
#### 爲啥根節點消失了,看不到了?
比如說我渲染了一個非常龐大的組織結構圖,同時我啓用了“平移”特性,這時如果我隱藏掉某個節點的大量的後代節點,可能會導致上層的一些節點在當前可視區域內消失。
跟多的細節,可以參考這個[問題](https://github.com/dabeng/OrgChart/issues/85)的討論。感謝[manuel-84](https://github.com/manuel-84) 的問題抛出 :blush:
## 浏覽器兼容性檢查
- Chrome 19+
- Firefox 4+
- Safari 6+
- Opera 15+
- IE 10+