node-red-contrib-ui-svg
Version:
A Node-RED widget node to show interactive SVG (vector graphics) in the dashboard
23 lines (16 loc) • 1.95 kB
Markdown
# "SVG" tab sheet
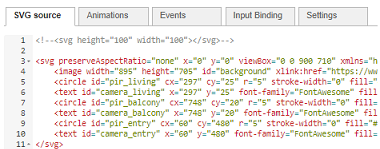
Enter you (XML-based) SVG graphics in this editor. This can be done in different ways:
+ If you are a die-hard SVG fanatic, you can enter the SVG string manually in the *"SVG"* tab sheet.
+ If you prefer to use an SVG drawing editor, you can use the embedded [DrawSvg](#DrawSvg-drawing-editor) editor.
+ If you need very specific types of drawings, you can use a third party SVG editor to create your drawing (and simple paste the generated SVG string into this tab sheet). Multiple (online) editors are free available, each with their own dedicated speciality:
+ [Floorplanner](http://floorplanner.com)
+ [Floorplancreator](https://floorplancreator.net/#pricing)
+ ...
However:
+ Be aware that those third-party SVG editors could create rather complex SVG strings, which are harder to understand when you want to change them manually afterwards.
+ Be aware that the browser has a lot of work to render all the SVG elements in the drawing! In some cases, it might be useful - to gain performance - to convert your SVG once to an image and use that as a background image in this SVG node (and draw other shapes on top of that image). For example, in Floorplanner website, the SVG drawing can be saved as a JPEG/PNG image. That image can be loaded into an SVG *'image'* element, like I have done in the example flows on this readme page ...
At the bottom of the "SVG source" tab sheet, a series of buttons are available:
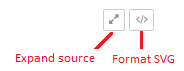
+ *Expand source*: show the SVG source in full screen mode.
+ *Format SVG*: by formatting the SVG source, the source will be beatified. This means the empty lines will be removed, each line will get a single SVG element, indents will be corrected ...