mithril-leaflet
Version:
A Leaflet drawable map component for mithril.
70 lines (54 loc) • 3.4 kB
Markdown
# mithril-leaflet
This library offers a `LeafletMap` component for the [mithril](https://mithril.js.org) framework, which combines [leaflet](http://leafletjs.com) for displaying maps, and [leaflet-draw](http://leaflet.github.io/Leaflet.draw/docs/leaflet-draw-latest.html) for editing overlays (see the [demo](https://erikvullings.github.io/mithril-leaflet/)).
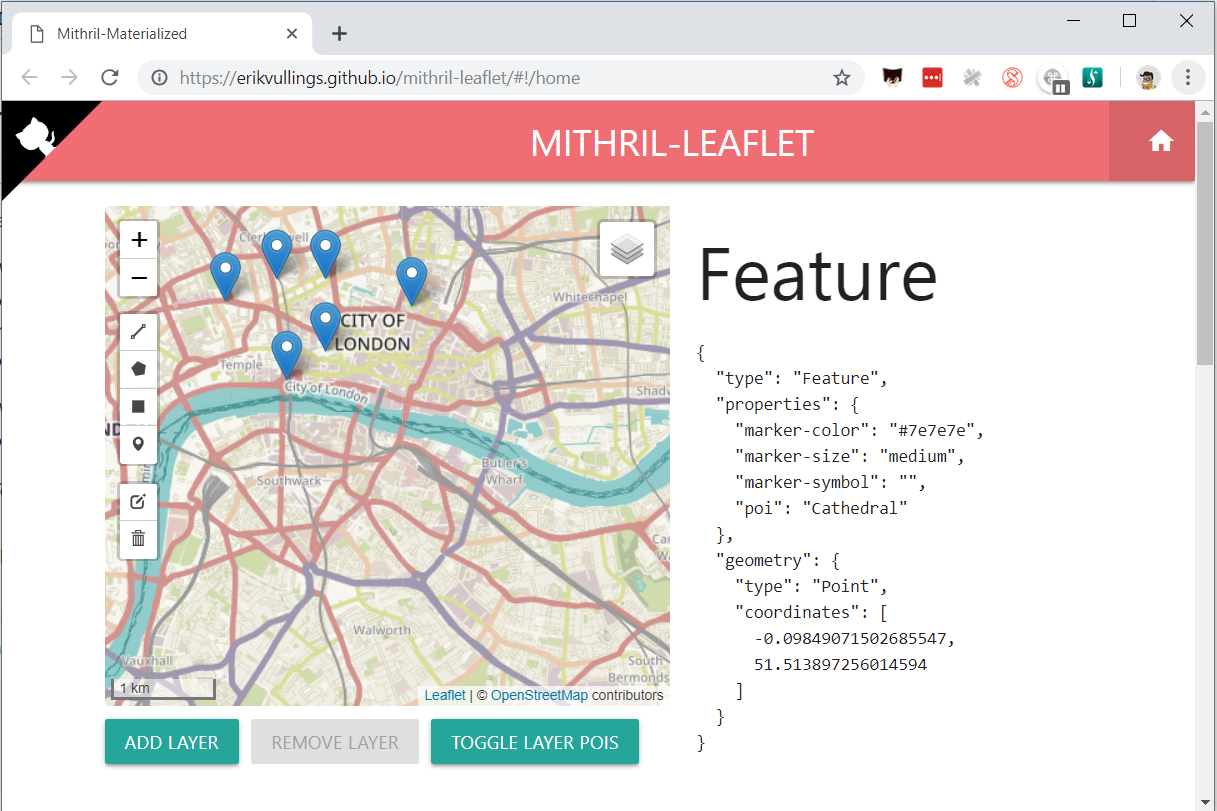
If you set the view and zoom factor when creating the map, they are used for centring. Otherwise, all initial overlays are used to compute the bounds ([see leaflet.fitBounds](https://leafletjs.com/reference-1.6.0.html#map-fitbounds)).
When editing, the last selected editable layer can be edited. So if you have multiple overlays, each of which can be edited, only the one you selected last can be changed. During editing, the same limitations apply as mentioned in [leaflet-draw](http://leaflet.github.io/Leaflet.draw/docs/leaflet-draw-latest.html): markers can be moved, polylines and lines can be edited. There is no editing support, however, for multi-lines and multi-polygons.
When multiple overlays are present, a layer control is shown. You can also enable the scale control, optionally choosing between metric, imperial or both.
You can check out the API documentation [here](https://erikvullings.github.io/mithril-leaflet/typedoc/index.html) or review the [example source code](https://github.com/erikvullings/mithril-leaflet/blob/master/packages/example/src/components/home/home-page.ts).
## Installation
First, you need to install the required packages: note that this library does not contain `leaflet`, or `leaflet-draw`, so you need to install them yourself. It has been tested against `leaflet` v1.4.
```bash
npm i mithril leaflet leaflet-draw mithril-leaflet
# Also install the typings if you use TypeScript
npm i --save-dev @types/leaflet @types/leaflet-draw @types/geojson @types/mithril
```
## Usage
Now you can use it in your [mithril](https://mithril.js.org) code.
```ts
import { LeafletMap } from 'mithril-leaflet';
import { Feature, Geometry } from 'geojson';
import { LatLngExpression, FeatureGroup, LeafletEvent, geoJSON } from 'leaflet'
...
m(LeafletMap, {
style: 'height: 400px; margin-top: 20px;',
// Default base layer, for others, see https://wiki.openstreetmap.org/wiki/Tile_servers
baseLayers: {
osm: {
url: 'http://{s}.tile.openstreetmap.fr/hot/{z}/{x}/{y}.png',
options: {
subdomains: ['a', 'b'],
attribution: '© <a href="http://osm.org/copyright">OpenStreetMap</a> contributors',
maxZoom: 19,
maxNativeZoom: 17,
},
},
},
// Optionally, specify initial view and zoom. By default, fit bounds is applied.
// view: [51.505, -0.09] as LatLngExpression,
// zoom: 13,
// Optionally, add overlay layers and specify which ones are visible.
// overlays,
// visible,
editable: ['test', 'pois'],
onMapClicked: console.log,
showScale: { imperial: false },
onLayerEdited: (f: FeatureGroup) => console.log(JSON.stringify(f.toGeoJSON(), null, 2)),
onLoadedOverlaysChanged: (v: string[]) => (state.visible = v),
})
```
## Build instructions
```bash
pnpm m i # You can also use `npm i`, but I prefer [pnpm](https://pnpm.js.org).
npm start # during development
npm run build:domain # for deploying it to GitHub
```