gordan
Version:
Gauss-Jordan + Regression JS library
221 lines (155 loc) • 4.93 kB
Markdown
[](https://postimg.cc/NychVyy0)
## Gauss-Jordan + Regression JavaScript library
[](https://github.com/tavuntu/gordan/blob/master/LICENSE.md)
[](https://www.npmjs.com/package/gordan/v/0.1.7)
### Installation
```npm i gordan --save```
### Usage
```js
import Gordan from 'gordan'; // for ES6
```
```js
const Gordan = require('gordan'); // for Node
```
### Main API
<details>
<summary>Gordan.solveByGaussJordan(matrix)</summary>
* ```matrix```: the augmented matrix, a bidimensional array
* **Returns:** the identity matrix with the solution coefficients
</details>
<details>
<summary>Gordan.getLinearRegressionRect(points)</summary>
* **Returns:** a list of points for the regression rect
</details>
<details>
<summary>Gordan.getQuadraticRegressionCurve(points)</summary>
* **Returns:** a list of points for the regression curve (from cuadratic equation)
</details>
<details>
<summary>Gordan.getRegressionPath(points, N)</summary>
* **Returns:** a list of points for an Nth grade equation (```ax^N + bx^(N - 1) + cx^(N - 2) + ...```)
* ```points```: for all cases, a list of ```x, y``` points. The following formats are supported:
```json
[
[1, 2],
[2, 2],
[3, 3]
]
```
```json
[
{ "x": 1, "y": 2 },
{ "x": 2, "y": 2 },
{ "x": 3, "y": 3 }
]
```
</details>
### Secondary API
<details>
<summary>Gordan.addRows(row1, row2, [invert1[, invert2]])</summary>
* ```row1```: first row to add, a number array
* ```row2```: second row to add, a number array
* ```invert1```: boolean, if present, values in ```row1``` are multiplied by ```-1```
* ```invert2```: boolean, if present, values in ```row2``` are multiplied by ```-1```
* **Returns:** the addition of the 2 rows (```number[]```)
</details>
<details>
<summary>Gordan.multiplyRow(row, value)</summary>
* ```row```: the row to multiply, a number array
* ```value```: each number in ```row``` is multiplied by this number
* **Returns:** a new row with the multipled values (```number[]```)
</details>
<details>
<summary>Gordan.divideRow(row, value)</summary>
* ```row```: the row to divide, a number array
* ```value```: each number in ```row``` is divided by this number
* **Returns:** a new row with the divided values (```number[]```)
</details>
<details>
<summary>Gordan.getSymbolValues(matrix)</summary>
* ```matrix```: the augmented matrix, a bidimensional array
* **Returns:** the last column of the resulting identity matrix (```number[]```)
</details>
<details>
<summary>Gordan.normalizePoints(points)</summary>
* ```points```: an array of ```[x, y]``` or ```{x, y}``` points
* **Returns:** an array of points with ```{x, y}``` format
</details>
<details>
<summary>Gordan.getRegressionMatrixFromPoints(points, degreeOfEquation)```</summary>
* ```points```: an array of ```[x, y]``` or ```{x, y}``` points
* ```degreeOfEquation```: a number greater than zero
* **Returns:** the regression augmented matrix
</details>
<details>
<summary>Gordan.getRange(points, axis)</summary>
* ```points```: an array of ```[x, y]``` or ```{x, y}``` points
* ```axis```: a string ```'x'``` or ```'y'```
* **Returns:** ```'x'```/```'y'``` limits on the plane for the given points
</details>
### Gauss-Jordan example
```javascript
let gaussJordanMatrix = [
[ 1, -2, 2, -3, 15 ],
[ 3, 4, -1, 1, -6 ],
[ 2, -3, 2, -1, 17 ],
[ 1, 1, -3, -2, -7 ]
];
let solvedMatrix = Gordan.solveByGaussJordan(gaussJordanMatrix);
```
Results in:
```
1, 0, 0, 0, 2
0, 1, 0, 0, -2
0, 0, 1, 0, 3
0, 0, 0, 1, -1
```
### Regression example
```javascript
let points = [
[1, 2],
[1.5, 4],
[2, 2.4],
[3, 5],
[4, 3],
[5.5, 9.3],
[5, 6],
[6, 10],
[6.5, 8.5],
[6.5, 13],
[7, 12.5]
];
let rect = Gordan.getLinearRegressionRect(points);
let curve = Gordan.getQuadraticRegressionCurve(points);
let gradeSixCurve = Gordan.getRegressionPath(points, 6);
```
Results in:
[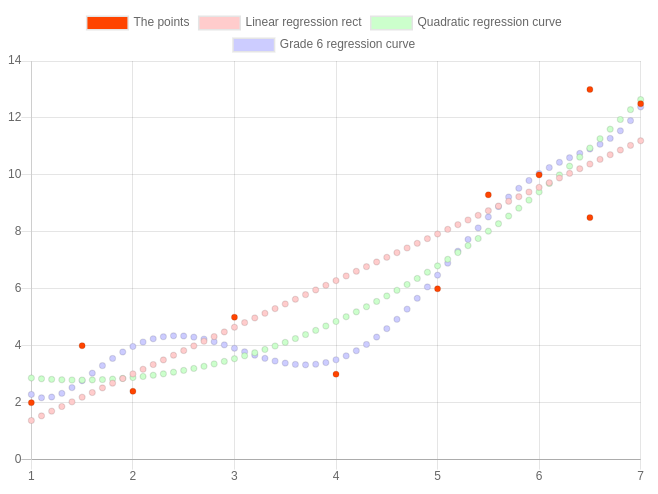](https://postimg.cc/dkspx0SM)
Here's the [Chart.js](https://www.chartjs.org/) code needed for that:
```javascript
let chart = new Chart(document.getElementById('chart'), {
type: 'scatter',
data: {
datasets: [{
label: 'The points',
data: Gordan.normalizePoints(points),
backgroundColor: '#f40'
}, {
label: 'Linear regression rect',
data: rect,
backgroundColor: '#fcc'
}, {
label: 'Quadratic regression curve',
data: curve,
backgroundColor: '#cfc'
}, {
label: 'Grade 6 regression curve',
data: gradeSixCurve,
backgroundColor: '#ccf'
}]
},
options: {
responsive: true
}
});
```