github-contribution-graph
Version:
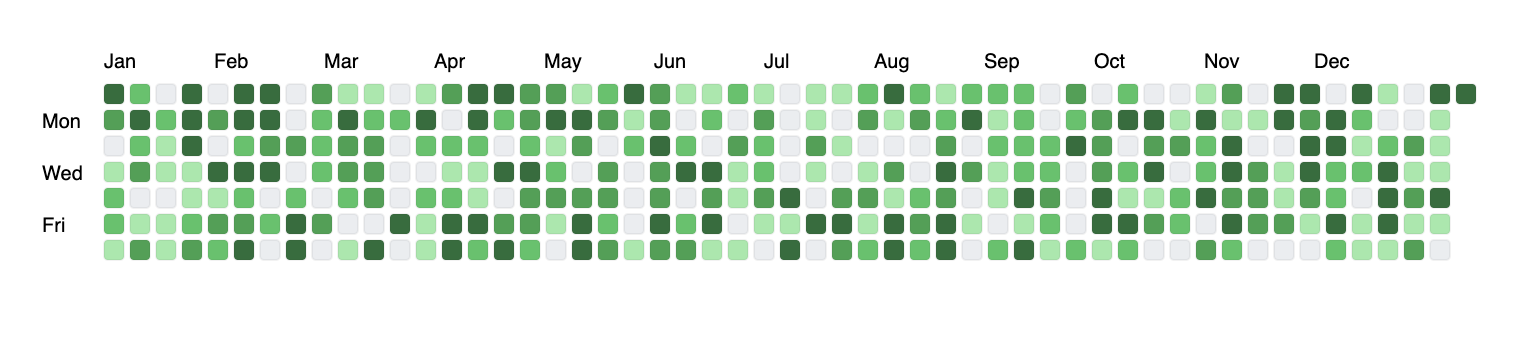
display your data visually with a github like contribution graph
110 lines (75 loc) • 2.03 kB
Markdown
display your data visually with a github like contribution graph.
```bash
npm i github-contribution-graph
```
or
```bash
yarn add github-contribution-graph
```
```js
import drawContributionGraph from "github-contribution-graph";
// for toottip css
// <link rel="stylesheet" href="https://unpkg.com/github-contribution-graph/src/style.css" crossorigin="anonymous">
// or
// import "github-contribution-graph/src/style.css";
drawContributionGraph({
data,
ssr: false,
config: {
graphMountElement: "#app",
},
});
```
- [CSR (Client Side Rendering) demo](https://stackblitz.com/edit/csr-github-contribution-graph-demo?file=index.js)
- [SSR (Server Side Rendering) demo](https://stackblitz.com/edit/ssr-github-contribution-graph-demo?file=pages%2Findex.js)
- `drawContributionGraph(data, ssr, config)`
Type: Object
data to feed the graph, below is an example of the accepted format of the object
```js
const data = {
2023: [
{
done: 12,
not_done: 4, // it's fine if you keep not_done as 0
date: "2023-06-07",
},
{
done: 3,
not_done: 6,
date: "2023-02-25",
},
],
2022: [
{
done: 7,
not_done: 3,
date: "2022-08-01",
},
],
};
```
Type: boolean (defaults to `false`)
set to true if you want to use this package in server side rendering
Type: object
children types : string or number
(defaults to `723`)
width of the contribution graph
(defaults to `113`)
height of the contribution graph
(defaults to `body`)
the css selector of the element to which the contribution graph to be appended
(defaults to `standard`)
theme of the graph (check in utils/themes.js for available themes)