ember-google-charts
Version:
The default blueprint for ember-cli addons.
523 lines (362 loc) • 13.8 kB
Markdown
Ember Google Charts [](https://travis-ci.org/sir-dunxalot/ember-google-charts) [](https://www.npmjs.com/package/ember-google-charts)
======
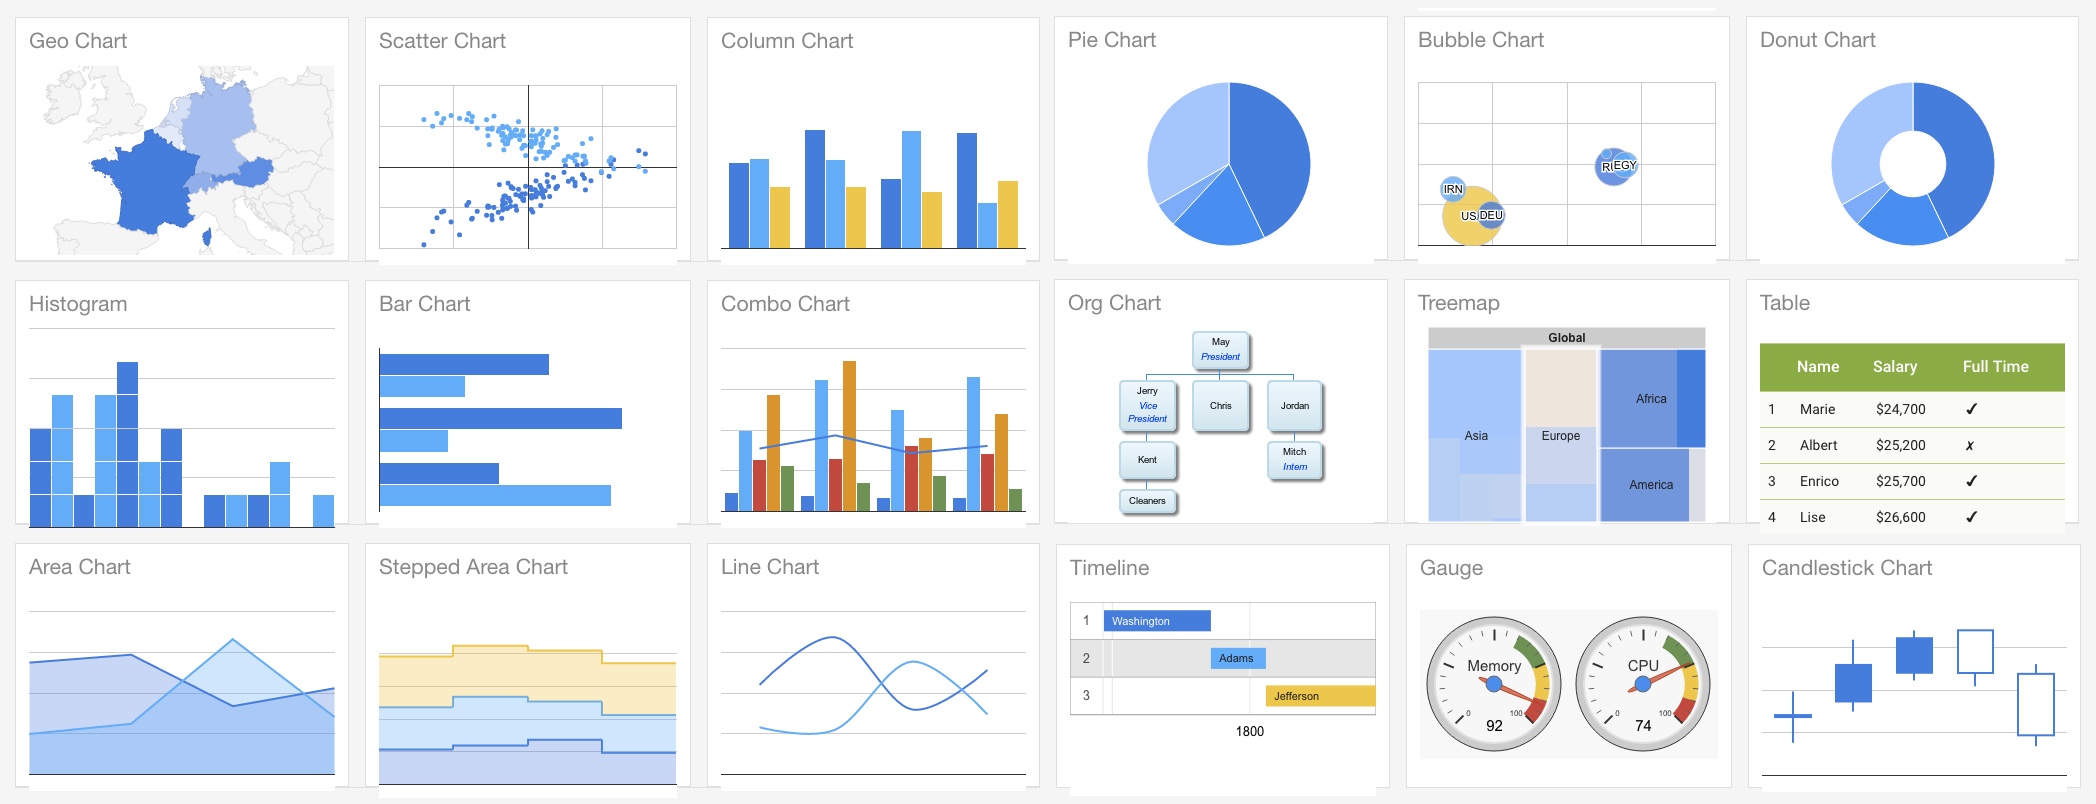
Ember Google Charts makes it very easy to implement [Google Charts](https://developers.google.com/chart/) in Ember CLI apps.
All dependencies are lazy loaded using the [Google JS API Loader](https://developers.google.com/loader/?hl=en), which intelligently caches requests between a user's sessions.
## Installation
```sh
ember install ember-google-charts
```
See the [demo app](http://sir-dunxalot.github.io/ember-google-charts/) here.
- [Charts](#charts)
- [Default options](#default-options)
- [Locales](#locales)
- [Resize](#resize)
- [Actions](#actions)
- [chartDidRender()](#chartdidrender)
- [packagesDidLoad()](#packagesdidload)
- [Events](#events)
- [Custom Charts](#custom-charts)
- [Content Security Policy](#content-security-policy)
- [Testing](#testing)
- [renderChart()](#renderchart)
- [assertChart()](#assertchart)
- [Development](#development)
## Usage
### Charts
There are six types of chart supported out of the box:
- Area Charts (`{{area-chart}}`)
- Bar Charts (`{{bar-chart}}`)
- Geo Charts (`{{geo-chart}}`)
- Line Charts (`{{line-chart}}`)
- Pie Charts (`{{pie-chart}}`)
- Scatter Charts (`{{scatter-chart}}`)
To add a chart to any route, simply add the relevant component:
```hbs
<AreaChart @data={{this.model}} @options={{this.options}} />
```
Or if you're using an old template syntax:
```hbs
{{area-chart data=data options=options}}
```
Data and options should be in the format expected by the given chart, as detailed in the [Google Charts documentation](https://developers.google.com/chart/interactive/docs/).
For example:
```js
/* stats/route.js */
import Route from '@ember/routing/route';
export default Route.extend({
model() {
return [
['Task', 'Hours per Day'],
['Work', 11],
['Eat', 2],
['Commute', 2],
['Watch TV', 2],
['Sleep', 7],
];
},
});
```
```js
/* stats/controller.js */
import Controller from '@ember/controller';
export default Controller.extend({
options: {
title: 'How I spend my days',
height: 300,
width: 400,
animation: {
startup: true,
easing: 'inAndOut',
},
},
});
```
```hbs
{{!-- stats/template.hbs --}}
<PieChart @data={{this.model}} @options={{this.options}} />
```
You can pass data as an array (see above example) or as a [Google Data Table](https://developers.google.com/chart/interactive/docs/datatables_dataviews):
```js
/* stats/route.js */
import Route from '@ember/routing/route';
export default Route.extend({
model() {
return google.visualization.arrayToDataTable([
['Year', 'Sales', 'Expenses'],
['2004', 1000, 400],
['2005', 1170, 460],
], false);
},
});
```
```hbs
{{!-- stats/template.hbs --}}
<PieChart @data={{this.model}} @options={{this.options}} />
```
For more information about data tables and how to create them, see the [Google Charts guides](https://developers.google.com/chart/interactive/docs/datatables_dataviews).
Where possible, this addon default to using Material Charts over Google's 'classic' design.
It's very easy to add non-default charts (e.g. table charts or gauge charts) - [see the custom charts docs here](#custom-charts)
#### Design
Indicate which design you want: `classic` or `material`.
```hbs
<BarChart @data={{this.model}} @options={{this.options}} @design="classic" />
```
Only some chart types support Material Charts. See the [Google Charts documentation](https://developers.google.com/chart/interactive/docs) Chart Types to learn more.
#### Default Options
Default options for all charts can be set in the `GoogleChartsService`.
**Default options are always merged with the options you pass into a component.** Passed in options will only override specific options properties, not the whole options object.
```js
/* services/google-charts.js */
import GoogleChartsService from 'ember-google-charts/services/google-charts';
export default GoogleChartsService.extend({
defaultOptions: {
backgroundColor: '#389fcc',
annotations: {
alwaysOutside: true,
},
},
});
```
You can also set default options for individual components by overriding `defaultOptions` for the component. For example, if you want a [custom chart component](#custom-charts) to use different default options:
```js
/* components/gantt-chart.js */
import GoogleChart from 'ember-google-charts/components/google-chart';
import renderMaterialChart from 'ember-google-charts/utils/render-material-chart';
export default GoogleChart.extend({
type: 'gantt',
defaultOptions: {
backgroundColor: '#389fcc',
annotations: {
alwaysOutside: true,
},
},
renderChart: renderMaterialChart,
});
```
```
```
#### Locales
You can set the language of the charts you render by specifying the language code in the `google-charts` service:
```js
/* services/google-charts.js */
import GoogleChartsService from 'ember-google-charts/services/google-charts';
export GoogleChartsService.extend({
language: 'fr',
});
```
For more information on locales, see the [Google Charts documentation](https://developers.google.com/chart/interactive/docs/basic_load_libs#loadwithlocale).
Please note, Google Charts dependencies can only be loaded for a single language. This is a [limitation](https://developers.google.com/chart/interactive/docs/basic_load_libs#basic-library-loading) of the Google API loader.
#### Resize
By default charts will rerender when the window size changes. You can opt out of this by setting `responsiveResize` to false:
```hbs
{{pie-chart data=data responsiveResize=false}}
```
### Actions
Two actions are available for you to hook on to:
#### chartDidRender()
This fires when the Google chart has rendered and is ready for interaction via Google Charts public methods.
This action receives the `chart` object of the rendered chart.
```js
/* stats/controller.js */
import Controller from '@ember/controller';
export default Controller.extend({
actions: {
selectCountry(chart) {
chart.setSelection('someValue');
},
},
});
```
```hbs
{{!-- stats/template.hbs --}}
<GeoChart
@data={{this.model}}
@options={{this.options}}
@chartDidRender=(action 'selectCountry')
/>
```
#### packagesDidLoad()
This fires when the Google chart has finished loading the required Google packages for a specific chart.
This action receives no params.
```js
/* stats/controller.js */
import Controller from '@ember/controller';
export default Controller.extend({
actions: {
checkGoogleExists() {
if (window.google) {
// Do something...
}
},
},
});
```
```hbs
{{!-- stats/template.hbs --}}
<LineChart
@data={{this.model}}
@options={{this.options}}
@packagesDidLoad=(action 'checkGoogleExists')
/>
```
### Events
It's easy to listen to events emitted by a chart:
```js
/* stats/controller.js */
import Controller from '@ember/controller';
export default Controller.extend({
actions: {
addChartEventListeners(chart) {
const { google: { visualization } } = window;
visualization.events.addListener(chart, 'onmouseover', function(event) {
/* Do something here... */;
});
}
},
});
```
```hbs
{{!-- stats/template.hbs --}}
<LineChart
@data={{this.model}}
@options={{this.options}}
@chartDidRender=(action 'addChartEventListeners')
/>
```
For more information on events, see the [Google Charts event documentation](https://developers.google.com/chart/interactive/docs/events).
### Custom Charts
All chart components in this addon extend from a single core component: the `GoogleChartComponent`.
1. Find the type of chart in [the Google guides](https://developers.google.com/chart/interactive/docs/) and see what Google Charts package it requires
2. Update the [Google Chart service](https://github.com/sir-dunxalot/ember-google-charts/blob/master/addon/services/google-charts.js) `packages` property with the new Google Charts package you require (if applicable)
3. Specify whether to use `'material'` or `'classic'` design (depending on what Google Charts documentation says the chart type supports)
```js
/* components/gantt-chart.js */
import GoogleChart from 'ember-google-charts/components/google-chart';
export default GoogleChart.extend({
design: 'classic',
type: 'gantt',
});
```
```js
/* services/google-charts.js */
import GoogleChartsService from 'ember-google-charts/services/google-charts';
export GoogleChartsService.extend({
googlePackages: ['corechart', 'bar', 'line', 'scatter', 'gantt'], // Added gantt to defaults
});
```
If preferred, you can write your own `renderChart` method. Use the [`renderChart` util as your guide](https://github.com/sir-dunxalot/ember-google-charts/blob/master/addon/utils/render-chart.js).
`renderChart()` receives the DOM Element in which to render the chart followed by the chart properties, which is an object that should include the following properties:
- `data` (see usage instructions)
- `design` (`'material'` or `'classic'`)
- `options` (see usage instructions)
- `type` (e.g. `'bar'`, `'line'`, etc)
`renderChart()` must return a promise that resolves with the chart object (`resolve(chart)`).
### Content Security Policy
You will need to add the following to your app's [content security policy](https://github.com/rwjblue/ember-cli-content-security-policy) to mitigate CSP errors:
```js
contentSecurityPolicy: {
'script-src': "'self' 'unsafe-eval' *.google.com *.gstatic.com",
'style-src': "'self' 'unsafe-inline' *.google.com *.googleapis.com *.gstatic.com",
'font-src': "'self' *.gstatic.com *.googleapis.com",
}
```
## Testing
This addon makes two test helpers available that you can use in your app's test suite:
- `renderChart()`
- `assertChart()`
### renderChart()
`renderChart()` is an async helper that renders a chart using `@ember/test-helpers`'s `render()` method.
You must pass in an ES6 tagged template string, as is expected by `render()`, [documented here](https://github.com/emberjs/ember-test-helpers/blob/master/API.md#render), so this helper is designed for use in integration tests.
For convenience, `renderChart()` returns the chart's DOM element.
For example:
```js
/* tests/integration/some-test */
import { module } from 'qunit';
import { setupRenderingTest } from 'ember-qunit';
import { renderChart } from 'ember-google-charts/test-support';
module('Integration | Component | pretty color', function(hooks) {
setupRenderingTest(hooks);
test('Rendering the expenses chart', async function(assert) {
this.set('data', [
['Year', 'Sales', 'Expenses'],
['2004', 1000, 400],
['2005', 1170, 460],
['2006', 660, 1120],
['2007', 1030, 540],
]);
const chart = await renderChart(hbs`{{area-chart data=data}}`);
/* Now run some assertions... */
assert.ok(chart.textContent.indexOf('2007') > -1,
'Should contain 2007 data');
});
});
```
`renderChart()` adds a delay to your test suite that can be removed if you desire (but this may fail test suites in remote environments, like Travis):
```js
const chart = await renderChart(hbs`{{area-chart data=data}}`, {
delay: 0, // Or some number of milliseconds
});
```
### assertChart()
`assertChart()` runs a series of predefined assertions on any chart element to assert that the chart has been rendered correctly.
`assertChart()` expects several params to be passed:
- `assert`, which is available in all 'ember-qunit' tests
- `chart`, which is the chart's element and is returned by the [`renderChart()` test helper](#renderchart)
- `properties`, which is an object that should include the properties passed into the chart component:
- `data`
- `design` (`'material'` or `'classic'`)
- `options`
- `type` (e.g. `'bar'`, `'line'`, etc)
Here is an example, which also uses `renderChart()`:
```js
/* tests/integration/some-test */
import { module } from 'qunit';
import { setupRenderingTest } from 'ember-qunit';
import { assertChart, renderChart } from 'ember-google-charts/test-support';
module('Integration | Component | pretty color', function(hooks) {
setupRenderingTest(hooks);
const data = [
['Year', 'Sales', 'Expenses'],
['2004', 1000, 400],
['2005', 1170, 460],
['2006', 660, 1120],
['2007', 1030, 540],
];
const options = {
title: 'Yearly expenses',
animation: {
startup: true,
easing: 'inAndOut',
},
};
test('Rendering the expenses chart', async function(assert) {
this.setProperties({
data,
options,
});
const chart = await renderChart(hbs`{{area-chart data=data options=options}}`);
assertChart(assert, chart, {
data,
design: 'classic', // Because it's not a Material Chart
options,
type: 'area',
});
});
});
```
## Development
All PRs and issues are welcome.
- `git clone https://github.com/sir-dunxalot/ember-google-charts.git`
- `cd ember-tooltips`
- `npm install && bower install`
- `ember s`
- `ember test`, `ember try:testall`, or the `/tests` route
Please include tests and documentation updates with any new features.
You do not need to bump the version when you have a PR.
To release an update to the demo app:
```sh
git checkout master # make sure you're on master branch
ember github-pages:commit --message "Some commit message" # Builds the app
git push origin gh-pages:gh-pages # Deploys the app
```