dpchart
Version:
Create your graph based of eCharts
234 lines (171 loc) • 5.61 kB
Markdown
# 🚀 dpChart
<p align="center">
<img src="https://raw.githubusercontent.com/passariello/container/ef3fa0eb45da8d9925e31fd29173375ee741f318/dpchart/assets/logos/dpchart.svg" alt="dpChart Logo" width="200"/>
</p>
<p align="center">
<strong>Beautiful Charts Made Simple</strong>
</p>
<p align="center">








</p>
## 📋 Table of Contents
- [About](#about-)
- [Features](#features-)
- [Quick Start](#quick-start-)
- [Installation](#installation-)
- [Usage](#usage-)
- [Examples](#examples-)
- [API](#api-)
- [License](#license-)
## 🔥 About
**dpChart** is a lightweight, powerful charting library built on top of [Apache ECharts](https://echarts.apache.org/). It provides a simplified API for creating beautiful, interactive charts with minimal code.
Created by [Dario Passariello](https://dario.passariello.ca) with ❤️
## ✨ Features
- 🚀 **Lightweight** - ~50KB minified bundle
- ⚡ **Fast** - Built with esbuild for lightning-fast builds
- 🎨 **Beautiful** - Stunning default styles and animations
- 📱 **Responsive** - Charts automatically resize
- 🔄 **Reactive** - Real-time data updates
- 🎯 **TypeScript** - Full type support
- 🔧 **Flexible** - Full ECharts power when you need it
## ⚡ Quick Start
```javascript
import "dpchart";
dpchart.draw({
id: "my-chart",
appendTo: "#chart-container",
option: {
xAxis: { data: ['Mon', 'Tue', 'Wed', 'Thu', 'Fri'] },
yAxis: {},
series: [{ data: [10, 22, 28, 43, 49], type: 'line' }]
}
});
```
## 📦 Installation
```bash
npm install dpchart --save
```
Or for the latest version:
```bash
npm install dpchart@latest --save
```
## 💻 Usage
### JavaScript/TypeScript (React, Vue, etc.)
```javascript
import "dpchart";
// Create a simple line chart
dpchart.draw({
id: "chart_001",
appendTo: "#chart-container",
option: {
tooltip: { trigger: 'axis' },
xAxis: { type: 'category', data: ['Mon', 'Tue', 'Wed', 'Thu', 'Fri', 'Sat', 'Sun'] },
yAxis: { type: 'value' },
series: [{
data: [820, 932, 901, 934, 1290, 1330, 1320],
type: 'line',
smooth: true
}]
}
});
```
### HTML (No build required)
```html
<script src="https://unpkg.com/dpchart@latest/index.js"></script>
<div id="chart-container" style="width: 100%; height: 400px;"></div>
<script>
dpchart.draw({
id: "my-chart",
appendTo: "#chart-container",
option: {
series: [{ data: [10, 20, 30], type: 'bar' }]
}
});
</script>
```
## 📊 Examples
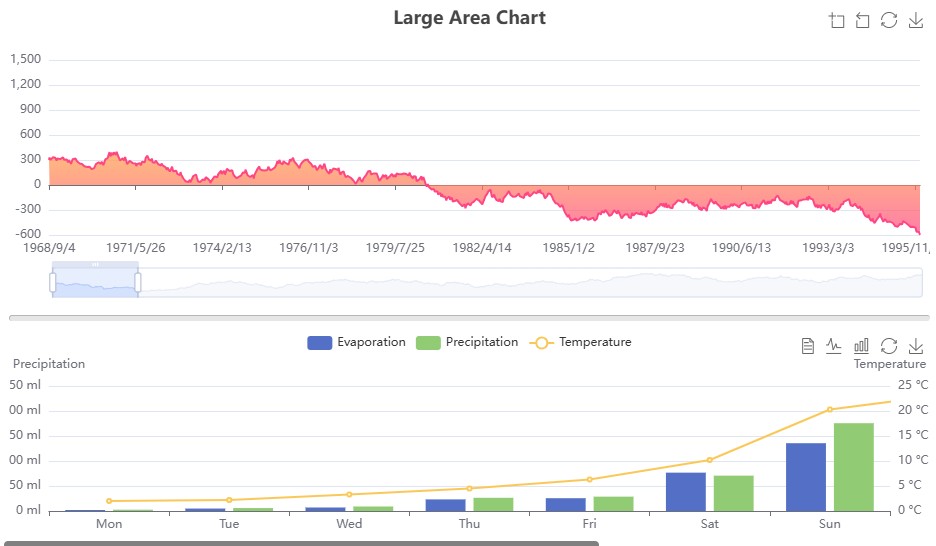
### Line Chart
```javascript
dpchart.draw({
id: "chart_001",
appendTo: "#chart_001",
option: {
tooltip: { trigger: 'axis' },
xAxis: { data: ['Mon', 'Tue', 'Wed', 'Thu', 'Fri', 'Sat', 'Sun'] },
yAxis: {},
series: [
{ name: 'Sales', type: 'bar', data: [820, 932, 901, 934, 1290, 1330, 1320] }
]
}
});
```
### Polar Chart
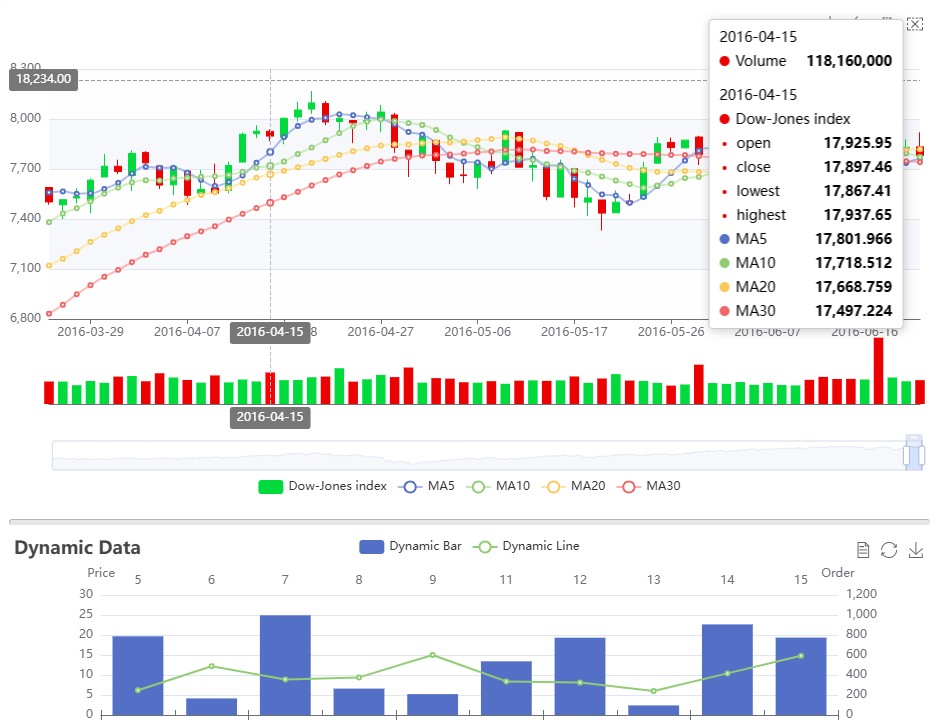
```javascript
dpchart.draw({
id: "chart_100",
appendTo: "#chart_100",
option: {
angleAxis: {},
radiusAxis: { type: 'category', data: ['Mon', 'Tue', 'Wed', 'Thu'], z: 10 },
polar: {},
series: [
{ type: 'bar', data: [1, 2, 3, 4], coordinateSystem: 'polar', name: 'A', stack: 'a' },
{ type: 'bar', data: [2, 4, 6, 8], coordinateSystem: 'polar', name: 'B', stack: 'a' }
],
legend: { show: true, data: ['A', 'B'] }
}
});
```
## 🛠️ API
### `dpchart.draw(options)`
Creates and renders a chart.
| Parameter | Type | Description |
|-----------|------|-------------|
| `id` | `string` | Unique identifier for the chart |
| `appendTo` | `string` | CSS selector or DOM element to append to |
| `option` | `object` | ECharts configuration object |
| `style` | `object` | Optional CSS styles (width, height) |
| `api` | `string` | Optional API endpoint for dynamic data |
## 🔌 Utilities
### `dpchart.update({ id, data })`
Update chart data:
```javascript
dpchart.update({
id: "my-chart",
data: { series: [{ data: [50, 60, 70] }] }
});
```
### `dpchart.fakeData(count, max, steps)`
Generate random time series data:
```javascript
const [dates, values] = dpchart.fakeData('2024-01-01', 100, 30);
// Returns: [['2024/1/1', '2024/1/2', ...], [random values]]
```
### `dpchart.cvs.processData(csvString)`
Parse CSV data:
```javascript
const data = dpchart.cvs.processData("name,value,date\nA,10,2024-01-01\nB,20,2024-01-02");
```
## 📄 License
MIT License - Copyright (c) [Dario Passariello](https://dario.passariello.ca)
Made with ❤️ and a lot of caffe' espesso!