dpchart
Version:
Create your graph based of eCharts
230 lines (202 loc) • 5.2 kB
Markdown
# I am dpChart

**dpChart** by [Dario Passariello](https://dario.passariello.ca) (c)


## About 🔥
dpChart is a semplification of eChart.
For some live examples visit: https://react.picla.net
## Install
```
npm i dpchart --save-dev
```
or update:
```
npm i dpchart@latest --save-dev
```
Use it in the in main root file (and only there):
```javascript
import "dpchart";
```
or
```javascript
require("dpchart");
```
## Install for ejs or other type of projects (like html)
note: you don't need to use npm install in this case or you get an error
```html
<script src="https://unpkg.com/dpchart@latest/index.js"></script>
```
## Example 1:
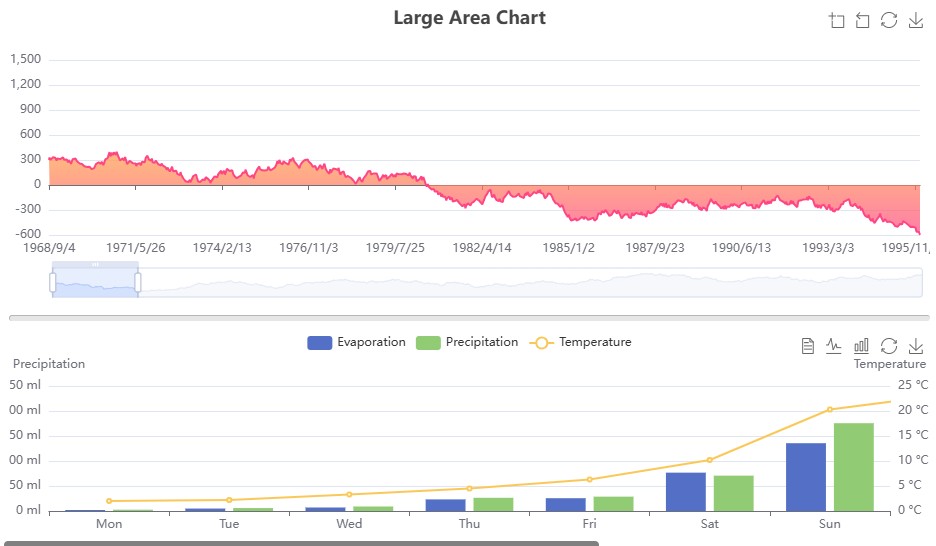
```javascript
// PS: create a div with id "chart_000"
export default () => dpchart.draw(
{
id: "chart_000",
appendTo: "#chart_000",
option: {
tooltip: {
trigger: 'axis',
axisPointer: {
type: 'cross',
crossStyle: {
color: '#999'
}
}
},
grid: {
left: 40,
top: 55,
right: 40,
bottom: 20
},
toolbox: {
feature: {
dataView: { show: true, readOnly: false },
magicType: { show: true, type: ['line', 'bar'] },
restore: { show: true },
saveAsImage: { show: true }
}
},
legend: {
data: ['Evaporation', 'Precipitation', 'Temperature']
},
xAxis: [
{
type: 'category',
data: ['Mon', 'Tue', 'Wed', 'Thu', 'Fri', 'Sat', 'Sun'],
axisPointer: {
type: 'shadow'
}
}
],
yAxis: [
{
type: 'value',
name: 'Precipitation',
min: 0,
max: 250,
interval: 50,
axisLabel: {
formatter: '{value} ml'
}
},
{
type: 'value',
name: 'Temperature',
min: 0,
max: 25,
interval: 5,
axisLabel: {
formatter: '{value} °C'
}
}
],
series: [
{
name: 'Evaporation',
type: 'bar',
tooltip: {
valueFormatter: function (value) {
return value + ' ml'
}
},
data: [
2.0, 4.9, 7.0, 23.2, 25.6, 76.7, 135.6, 162.2, 32.6, 20.0, 6.4, 3.3
]
},
{
name: 'Precipitation',
type: 'bar',
tooltip: {
valueFormatter: function (value) {
return value + ' ml'
}
},
data: [
2.6, 5.9, 9.0, 26.4, 28.7, 70.7, 175.6, 182.2, 48.7, 18.8, 6.0, 2.3
]
},
{
name: 'Temperature',
type: 'line',
yAxisIndex: 1,
tooltip: {
valueFormatter: function (value) {
return value + ' °C'
}
},
data: [2.0, 2.2, 3.3, 4.5, 6.3, 10.2, 20.3, 23.4, 23.0, 16.5, 12.0, 6.2]
}
]
}
}
)
```
## Example 2:
```javascript
// PS: create a div with id "chart_100"
export default () => dpchart.draw(
{
id: "chart_100",
appendTo: "#chart_100",
option: {
angleAxis: {},
radiusAxis: {
type: 'category',
data: ['Mon', 'Tue', 'Wed', 'Thu'],
z: 10
},
grid: {
left: 10,
top: 10,
right: 10,
bottom: 10
},
polar: {},
series: [
{
type: 'bar',
data: [1, 2, 3, 4],
coordinateSystem: 'polar',
name: 'A',
stack: 'a',
emphasis: {
focus: 'series'
}
},
{
type: 'bar',
data: [2, 4, 6, 8],
coordinateSystem: 'polar',
name: 'B',
stack: 'a',
emphasis: {
focus: 'series'
}
},
{
type: 'bar',
data: [1, 2, 3, 4],
coordinateSystem: 'polar',
name: 'C',
stack: 'a',
emphasis: {
focus: 'series'
}
}
],
legend: {
show: true,
data: ['A', 'B', 'C']
}
}
}
)
```
Dario Passariello, All rights reserved - Copyright (c) 2019 - 2024