chartme
Version:
Turn an image into a chart.
145 lines (131 loc) • 5.03 kB
Markdown
# ChartMe: Image to chart generation.
**ChartMe** is a TypeScript library designed to take in an image and turn it into a chart while also providing customization options.
## Features
- Recoloring images using proximity to color.
- Filtering a processed image to filter for outliers.
- Saving and loading preprocessed graph data.
- Recoloring following same colored segments.
## Related Links
* GitHub: https://github.com/CasFre4/EIA-bulk
* npm: https://www.npmjs.com/package/chartme
## Installation
You can install the `chartme` package using `npm`:
```bash
npm install chartme
```
# Getting Started
### 1. Imports
```js
import ChartMe from 'chartme'
import {Jimp} from 'jimp'
```
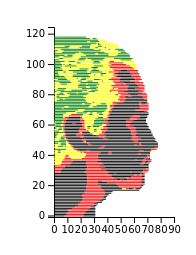
### 2. Saving a model
```js
const image = await Jimp.read(imagePath)
const chart = await new ChartMe({image: image, colorBundle: [
{tcolor: [0,0,0,255], fcolor: 'green'},
{tcolor: [50,50,50,255], fcolor: 'yellow'},
{tcolor: [100, 100, 100, 255], fcolor: 'red'},
{tcolor: [150,150,150,255], fcolor: 'black'}],
height: image.height/20, width: image.width/20})
.load()//height and width define image resizing.
chart.cleanData()
chart.splitColors({splits: 3})
chart.preprocess()
chart.saveFile('./data.json')
```
<details>
<summary> Click to view chart </summary></br>
</details>
### 3. Displaying graph
#### With saved file and React
```js
const containerRef = useRef<HTMLDivElement>(null);
useEffect(() => {
const run = async () => {
if (!containerRef.current) return
const chart = new ChartMe({})
await chart.loadFile('./data.json')
chart.graph({container: containerRef.current, height: 190, width: 120})//height and width define size of chart
}
run();
}, []);
```
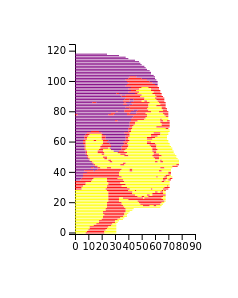
#### Without save file and using getElementById
```js
const image = await Jimp.read(imagePath)
const chart = await new ChartMe({image: image, colorBundle: [
{tcolor: [0,0,0,255], fcolor: 'purple'},
{tcolor: [100,100,100,255], fcolor: 'red'},
{tcolor: [150, 150, 150, 255], fcolor: 'yellow'}],
height: image.height/20, width: image.width/20})
.load()
chart.cleanData()
chart.splitColors({splits: 3})
chart.preprocess()
const container = document.getElementById('my_dataviz')
if (container && container instanceof HTMLDivElement) {
chart.graph({container: container, height: 190, width: 120})
}
```
<details>
<summary> Click to view chart </summary></br>
</details>
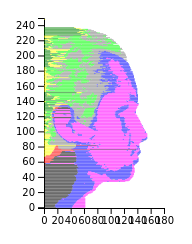
### 4. With color splitting
```js
const image = await Jimp.read(imagePath)
const chart = await new ChartMe({image: image, colorBundle: [
{tcolor: [0,0,0,255], fcolor: 'green'},
{tcolor: [50,50,50,255], fcolor: 'yellow'},
{tcolor: [100, 100, 100, 255], fcolor: 'red'},
{tcolor: [150, 150, 150, 255], fcolor: "black"}]})
.load()
chart.cleanData()
chart.splitColors({splits: 4, colorBundle:
[{tcolor: [0,0,0,255], fcolor: 'lime'},
{tcolor: [50,50,50,255], fcolor: 'grey'},
{tcolor: [150, 150, 150, 255], fcolor: 'blue'},
{tcolor: [100,100,100,255], fcolor: 'magenta'}]})
chart.preprocess()
const container = document.getElementById('my_dataviz')
if (container && container instanceof HTMLDivElement) {
chart.graph({container: containerRef.current, height: 190, width: 120})
}
```
<details>
<summary> Click to view chart </summary></br>
</details>
### 5. Full example
<!-- <details>
<summary> Starting image </summary></br> -->
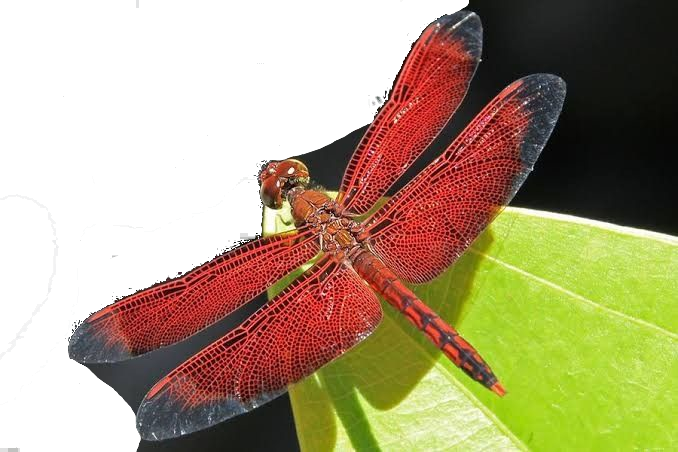
#### Starting image
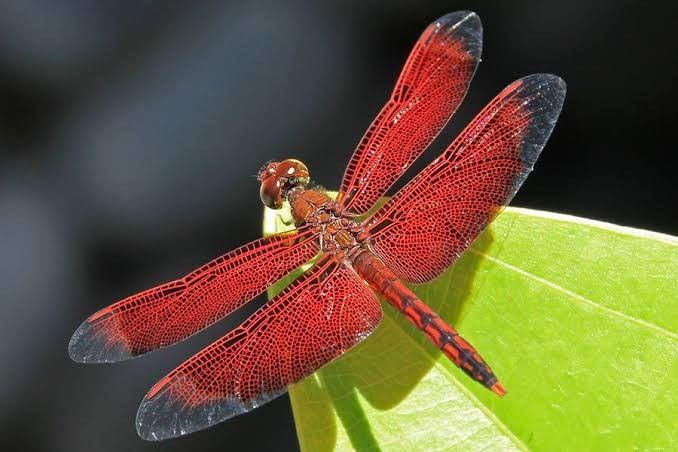
#### Edit image
Switching to an image with an alpha channel and removing parts of the image that you don't want on your chart will facilitate the process.
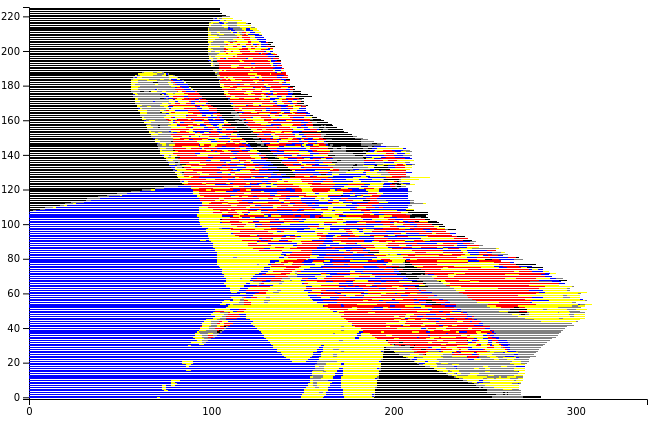
#### Image processing and chart generation
```js
const editproportion = 1/2
image.flip({horizontal: true})//Flip since charts only face right.
const chart = await new ChartMe({image: image, colorBundle:
[{tcolor: [50,51,50,255], fcolor: 'grey'},
{tcolor: [33,28,25,255], fcolor: 'black'},
{tcolor: [85,24,24,255], fcolor: 'red'},
{tcolor: [100, 100, 100, 255], fcolor: 'yellow'},
{tcolor: [150, 150, 150, 255], fcolor: 'blue'},
], height: image.height * newprop, width: image.width * newprop}).load()
chart.cleanData()
chart.splitColors({splits: 5})
chart.preprocess()
```
#### Final Chart
</br>
</br>
# Limitations
- Images may look better with some minimal external image editing.
- Graphing options are currently limited.
- Works best with images that have distinct color changes.