chartjs-chart-venn
Version:
Chart.js module for venn diagrams
186 lines (144 loc) • 5.54 kB
Markdown
# Chart.js Venn and Euler Diagram Chart
[![NPM Package][npm-image]][npm-url] [![Github Actions][github-actions-image]][github-actions-url]
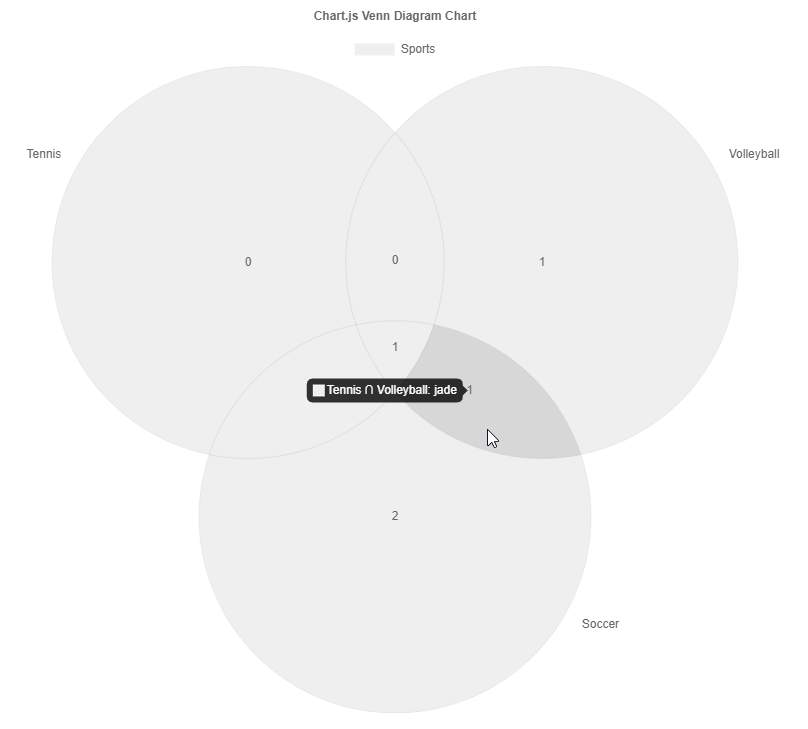
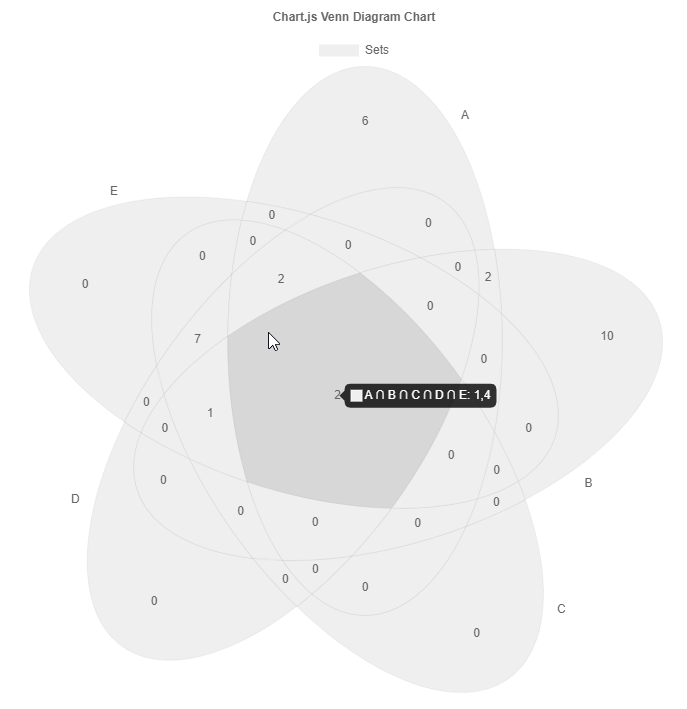
Chart.js module for charting venn diagrams with up to five sets. Adding new chart type: `venn` and `euler`.
## Related Plugins
Check out also my other chart.js plugins:
- [chartjs-chart-boxplot](https://github.com/sgratzl/chartjs-chart-boxplot) for rendering boxplots and violin plots
- [chartjs-chart-error-bars](https://github.com/sgratzl/chartjs-chart-error-bars) for rendering errors bars to bars and line charts
- [chartjs-chart-geo](https://github.com/sgratzl/chartjs-chart-geo) for rendering map, bubble maps, and choropleth charts
- [chartjs-chart-graph](https://github.com/sgratzl/chartjs-chart-graph) for rendering graphs, trees, and networks
- [chartjs-chart-pcp](https://github.com/sgratzl/chartjs-chart-pcp) for rendering parallel coordinate plots
- [chartjs-chart-wordcloud](https://github.com/sgratzl/chartjs-chart-wordcloud) for rendering word clouds
- [chartjs-plugin-hierarchical](https://github.com/sgratzl/chartjs-plugin-hierarchical) for rendering hierarchical categorical axes which can be expanded and collapsed
## Install
```bash
npm install --save chart.js chartjs-chart-venn
```
## Usage
see [Examples](https://upset.js.org/chartjs-chart-venn/examples/)
or at this [![Open in CodePen][codepen]](https://codepen.io/sgratzl/pen/ExPyZjG)
## Venn Diagram
### Data Structure
```ts
const config = {
type: 'venn',
data: ChartVenn.extractSets(
[
{ label: 'Soccer', values: ['alex', 'casey', 'drew', 'hunter'] },
{ label: 'Tennis', values: ['casey', 'drew', 'jade'] },
{ label: 'Volleyball', values: ['drew', 'glen', 'jade'] },
],
{
label: 'Sports',
}
),
options: {},
};
```
Alternative data structure
```ts
const config = {
type: 'venn',
data: {
labels: [
'Soccer',
'Tennis',
'Volleyball',
'Soccer ∩ Tennis',
'Soccer ∩ Volleyball',
'Tennis ∩ Volleyball',
'Soccer ∩ Tennis ∩ Volleyball',
],
datasets: [
{
label: 'Sports',
data: [
{ sets: ['Soccer'], value: 2 },
{ sets: ['Tennis'], value: 0 },
{ sets: ['Volleyball'], value: 1 },
{ sets: ['Soccer', 'Tennis'], value: 1 },
{ sets: ['Soccer', 'Volleyball'], value: 0 },
{ sets: ['Tennis', 'Volleyball'], value: 1 },
{ sets: ['Soccer', 'Tennis', 'Volleyball'], value: 1 },
],
},
],
},
options: {},
};
```
### Styling of elements
`ArcSlice` elements have the basic `backgroundColor`, `borderColor`, and `borderWidth` properties similar to a regular rectangle.
### Styling of labels
The `x` scale _ticks_ options are used to configure the _set value_ labels within the intersections.
The `y` scale _ticks_ options are used to configure the _set label_ labels next ot the set circles.
Changing the tick display options (e.g. `scales.x.ticks.display = false`) will disable the set value labels.
Similarly, its font spec and color are used to the styling of the labels.
## Euler Diagram
Euler diagrams are relaxed proportional venn diagrams such that the area of the circles and overlap try to fit the overlapping value.
It is a relaxed in a way that is just approximates the proportions using a numerical optimization process.
Moreover, only one and two set overlaps are used for the computation.
The library uses [venn.js](https://github.com/upsetjs/venn.js) in the background.
### Data Structure
```ts
const config = {
type: 'euler',
data: ChartVenn.extractSets(
[
{ label: 'A', values: [1, 2, 3, 4, 11, 12, 13, 14, 15, 16, 17, 18] },
{ label: 'B', values: [1, 2, 3, 4, 5, 6, 7, 8, 9, 10, 19, 20, 21, 22, 23] },
{ label: 'C', values: [1, 11, 12, 4, 5, 24, 25, 26, 27, 28, 29, 30] },
],
{
label: 'Sets',
}
),
options: {},
};
```
### Styling of elements
see Venn Diagram
## ESM and Tree Shaking
The ESM build of the library supports tree shaking thus having no side effects. As a consequence the chart.js library won't be automatically manipulated nor new controllers automatically registered. One has to manually import and register them.
Variant A:
```js
import { Chart, LinearScale } from 'chart.js';
import { VennDiagramController, ArcSlice } from 'chartjs-chart-venn';
Chart.register(VennDiagramController, ArcSlice, LinearScale);
...
new Chart(ctx, {
type: VennDiagramController.id,
data: [...],
});
```
Variant B:
```js
import { VennDiagramChart } from 'chartjs-chart-venn';
new VennDiagramChart(ctx, {
data: [...],
});
```
## Development Environment
```sh
npm i -g yarn
yarn install
yarn sdks vscode
```
### Common commands
```sh
yarn compile
yarn test
yarn lint
yarn fix
yarn build
yarn docs
```
[mit-image]: https://img.shields.io/badge/License-MIT-yellow.svg
[mit-url]: https://opensource.org/licenses/MIT
[npm-image]: https://badge.fury.io/js/chartjs-chart-venn.svg
[npm-url]: https://npmjs.org/package/chartjs-chart-venn
[github-actions-image]: https://github.com/upsetjs/chartjs-chart-venn/workflows/ci/badge.svg
[github-actions-url]: https://github.com/upsetjs/chartjs-chart-venn/actions
[codepen]: https://img.shields.io/badge/CodePen-open-blue?logo=codepen