chartjs-chart-geo
Version:
Chart.js module for charting maps
233 lines (158 loc) • 8.58 kB
Markdown
# Chart.js Geo
[![NPM Package][npm-image]][npm-url] [![Github Actions][github-actions-image]][github-actions-url]
Chart.js module for charting maps with legends. Adding new chart types: `choropleth` and `bubbleMap`.
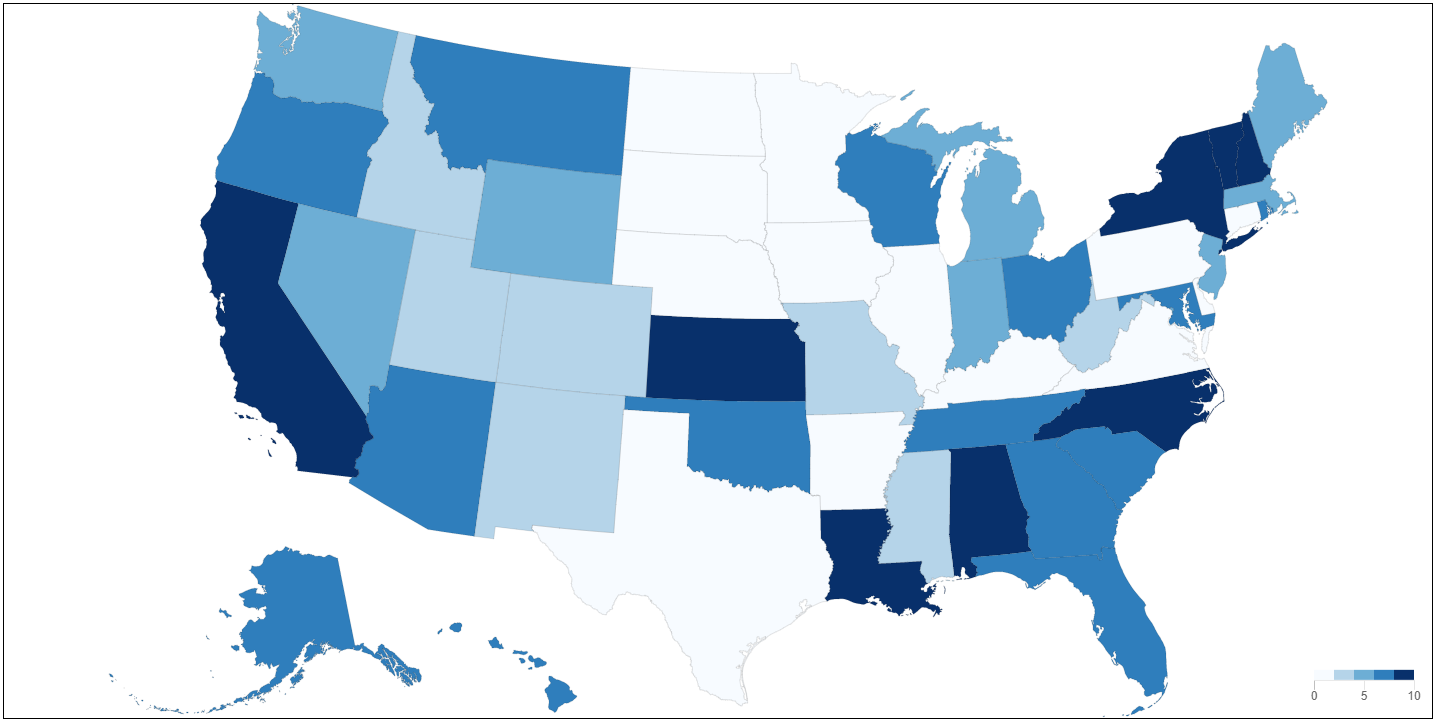
[![Open in CodePen][codepen]](https://codepen.io/sgratzl/pen/gOaBQep)
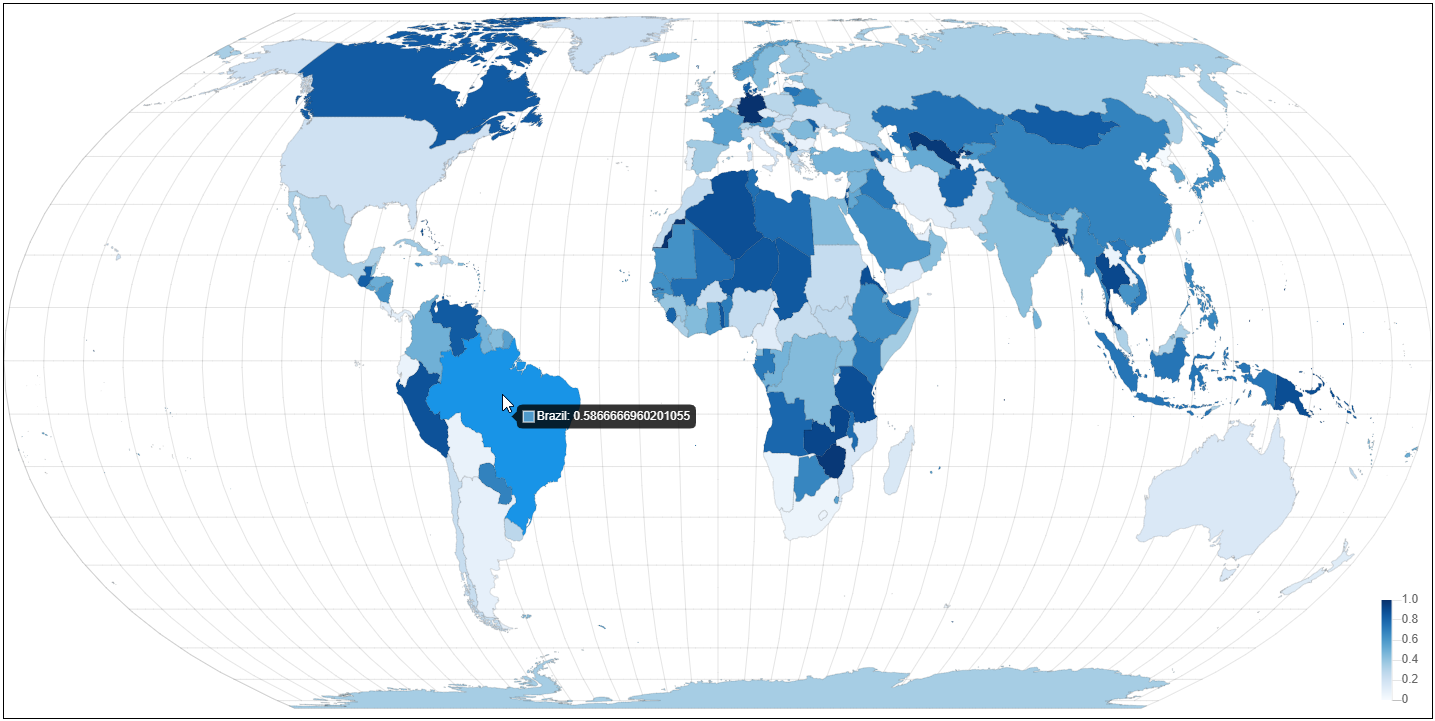
[![Open in CodePen][codepen]](https://codepen.io/sgratzl/pen/bGVmQKw)
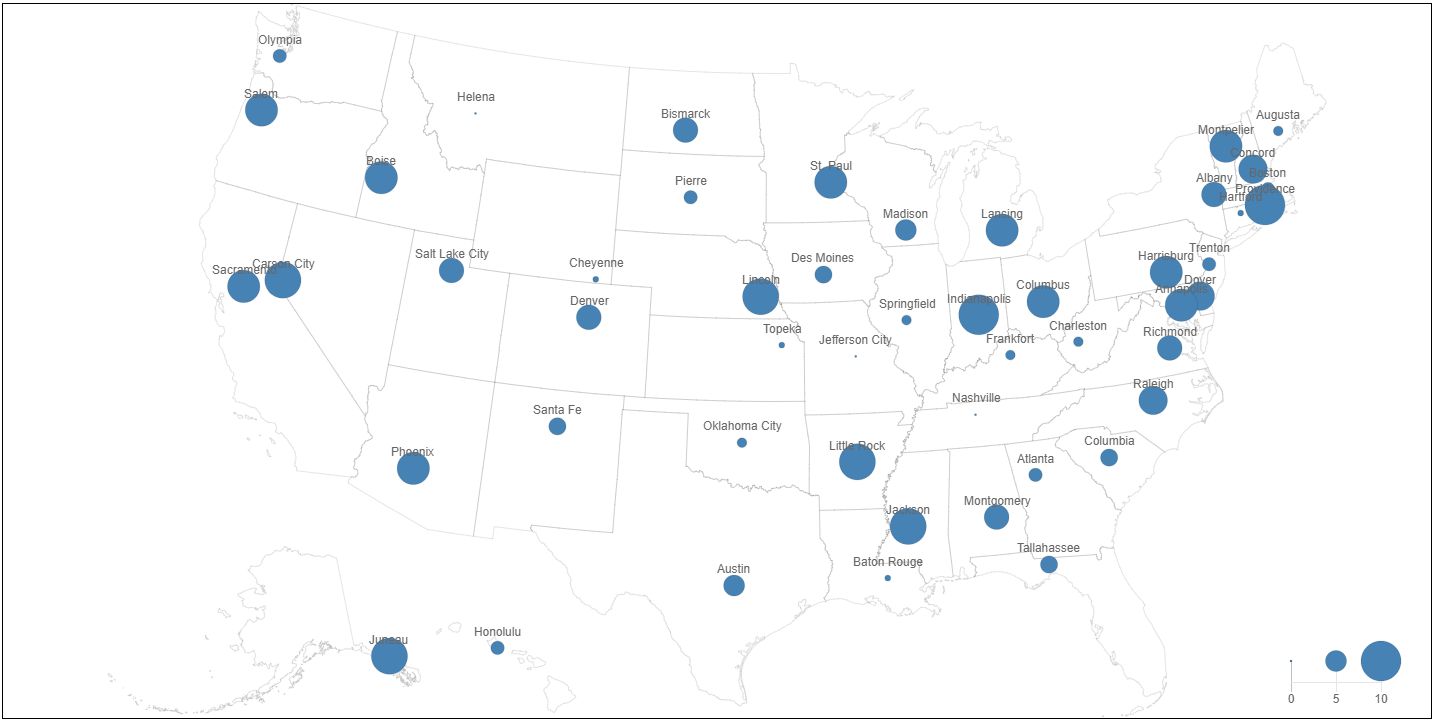
[![Open in CodePen][codepen]](https://codepen.io/sgratzl/pen/YzyJRvm)
works great with https://github.com/chartjs/chartjs-plugin-datalabels
## Related Plugins
Check out also my other chart.js plugins:
- [chartjs-chart-boxplot](https://github.com/sgratzl/chartjs-chart-boxplot) for rendering boxplots and violin plots
- [chartjs-chart-error-bars](https://github.com/sgratzl/chartjs-chart-error-bars) for rendering errors bars to bars and line charts
- [chartjs-chart-graph](https://github.com/sgratzl/chartjs-chart-graph) for rendering graphs, trees, and networks
- [chartjs-chart-pcp](https://github.com/sgratzl/chartjs-chart-pcp) for rendering parallel coordinate plots
- [chartjs-chart-venn](https://github.com/sgratzl/chartjs-chart-venn) for rendering venn and euler diagrams
- [chartjs-chart-wordcloud](https://github.com/sgratzl/chartjs-chart-wordcloud) for rendering word clouds
- [chartjs-plugin-hierarchical](https://github.com/sgratzl/chartjs-plugin-hierarchical) for rendering hierarchical categorical axes which can be expanded and collapsed
## Install
```bash
npm install --save chart.js chartjs-chart-geo
```
## Usage
see https://www.sgratzl.com/chartjs-chart-geo/ website
CodePens
- [Choropleth](https://codepen.io/sgratzl/pen/gOaBQep)
- [Earth Choropleth](https://codepen.io/sgratzl/pen/bGVmQKw)
- [Bubble Map](https://codepen.io/sgratzl/pen/YzyJRvm)
## Options
The option can be set globally or per dataset
see [https://github.com/sgratzl/chartjs-chart-geo/blob/main/src/controllers/GeoController.ts#L221](https://github.com/sgratzl/chartjs-chart-geo/blob/be3979117f8ae9a249969593c108d9b92b7e07fa/src/controllers/GeoController.ts#L225-L254)
## Choropleth
A Choropleth (chart type: `choropleth`) is used to render maps with the area filled according to some numerical value.

[![Open in CodePen][codepen]](https://codepen.io/sgratzl/pen/gOaBQep)

[![Open in CodePen][codepen]](https://codepen.io/sgratzl/pen/bGVmQKw)
### Data Structure
A data point has to have a `.feature` property containing the feature to render and a `.value` property containing the value for the coloring.
[TopoJson](https://github.com/topojson) is packaged with this plugin to convert data, it is exposed as `ChartGeo.topojson` in the global context. However, this plugin doesn't include any topojson files itself. Some useful resources I found so far:
- US map: https://www.npmjs.com/package/us-atlas
- World map: https://www.npmjs.com/package/world-atlas
- individual countries: https://github.com/markmarkoh/datamaps/tree/master/src/js/data (untested)
- topojson collection: https://github.com/deldersveld/topojson (untested)
```js
const us = await fetch('https://cdn.jsdelivr.net/npm/us-atlas/states-10m.json').then((r) => r.json());
// whole US for the outline
const nation = ChartGeo.topojson.feature(us, us.objects.nation).features[0];
// individual states
const states = ChartGeo.topojson.feature(us, us.objects.states).features;
const alaska = states.find((d) => d.properties.name === 'Alaska');
const california = states.find((d) => d.properties.name === 'California');
...
const config = {
data: {
labels: ['Alaska', 'California'],
datasets: [{
label: 'States',
outline: nation, // ... outline to compute bounds
showOutline: true,
data: [
{
value: 0.4,
feature: alaska // ... the feature to render
},
{
value: 0.3,
feature: california
}
]
}]
},
options: {
scales: {
projection: {
projection: 'albersUsa' // ... projection method
}
}
}
};
```
### Styling
The styling of the new element `GeoFeature` is based on [Bar Element](https://www.chartjs.org/docs/latest/configuration/elements.html#bar-configuration) with some additional options for the outline and graticule.
see https://github.com/sgratzl/chartjs-chart-geo/blob/main/src/elements/GeoFeature.ts#L41
### Legend and Color Scale
The coloring of the nodes will be done with a special color scale. The scale itself is based on a linear scale.
see
- https://github.com/sgratzl/chartjs-chart-geo/blob/main/src/scales/LegendScale.ts#L148
- https://github.com/sgratzl/chartjs-chart-geo/blob/main/src/scales/ColorScale.ts#L180
## Bubble Map
A Bubble Map (chart type: `bubbleMap`) aka Proportional Symbol is used to render maps with dots that are scaled according to some numerical value. It is based on a regular `bubble` chart where the positioning is done using latitude and longitude with an additional `sizeScale` to create a legend for the different radi.

[![Open in CodePen][codepen]](https://codepen.io/sgratzl/pen/YzyJRvm)
### Data Structure
see [Bubble Chart](https://www.chartjs.org/docs/latest/charts/bubble.html#data-structure). Alternatively to `x` and `y`, the following structure can be used:
```ts
interface IBubbleMapPoint {
longitude: number;
latitude: number;
value: number;
}
```
**Note**: instead of using the `r` attribute as in a regular bubble chart, the `value` attribute is used, which is picked up by the `sizeScale` to convert it to an actual pixel radius value.
### Styling
A regular point is used and thus supports the [Point Element](https://www.chartjs.org/docs/latest/configuration/elements.html#point-configuration) styling options. In addition, the `outline*` and `graticule*` are supported.
### Legend
Similar to the choropleth chart a new `sizeScale` is used to map the values to symbol radius size. The scale itself is based on a linear scale.
see
- https://github.com/sgratzl/chartjs-chart-geo/blob/main/src/scales/LegendScale.ts#L148
- https://github.com/sgratzl/chartjs-chart-geo/blob/main/src/scales/SizeScale.ts#L52
## Scales
A new scale `projection` is registered and used by default by Choropleth and BubbleMap. The available methods are the one from https://github.com/d3/d3-geo#projections. Just remove the `geo` prefix. Alternatively, the projection method instance can be directly given.
see https://github.com/sgratzl/chartjs-chart-geo/blob/main/src/scales/ProjectionScale.ts#L76
### ESM and Tree Shaking
The ESM build of the library supports tree shaking thus having no side effects. As a consequence the chart.js library won't be automatically manipulated nor new controllers automatically registered. One has to manually import and register them.
Variant A:
```js
import { Chart } from 'chart.js';
import { ChoroplethController, GeoFeature, ColorScale, ProjectionScale } from 'chartjs-chart-geo';
// register controller in chart.js and ensure the defaults are set
Chart.register(ChoroplethController, GeoFeature, ColorScale, ProjectionScale);
const chart = new Chart(document.getElementById('canvas').getContext('2d'), {
type: 'choropleth',
data: {
// ...
},
});
```
Variant B:
```js
import { ChoroplethChart } from 'chartjs-chart-geo';
const chart = new ChoroplethChart(document.getElementById('canvas').getContext('2d'), {
data: {
//...
},
});
```
## Development Environment
```sh
npm i -g yarn
yarn install
yarn sdks vscode
```
### Common commands
```sh
yarn compile
yarn test
yarn lint
yarn fix
yarn build
yarn docs
```
[npm-image]: https://badge.fury.io/js/chartjs-chart-geo.svg
[npm-url]: https://npmjs.org/package/chartjs-chart-geo
[github-actions-image]: https://github.com/sgratzl/chartjs-chart-geo/workflows/ci/badge.svg
[github-actions-url]: https://github.com/sgratzl/chartjs-chart-geo/actions
[codepen]: https://img.shields.io/badge/CodePen-open-blue?logo=codepen