angular-advance-chart
Version:
Angular Advance Chart provides chart solution for Angular.Currently supports Bar, Pie and Donut chart
160 lines (134 loc) • 4.7 kB
Markdown
# Angular Advance Chart


[](https://github.com/SomeshKb/Angular-Advance-Chart/stargazers)
[](https://github.com/SomeshKb/Angular-Advance-Chart/issues)
[](https://github.com/SomeshKb/Angular-Advance-Chart/network)


## Installation
To use angular-advance-chart in your project install it via [npm](https://www.npmjs.com/package/angular-advance-chart):
```bash
npm i angular-advance-chart
```
## Adding chart module to project
#### app.module.ts
```typescript
import { BrowserModule } from '@angular/platform-browser';
import { NgModule } from '@angular/core';
import { AppRoutingModule } from './app-routing.module';
import { AppComponent } from './app.component';
import { AngularAdvanceChartModule } from 'angular-advance-chart';
@NgModule({
declarations: [
AppComponent
],
imports: [
BrowserModule,
AppRoutingModule,
AngularAdvanceChartModule
],
providers: [],
bootstrap: [AppComponent]
})
export class AppModule { }
```
### Adding style for chart
#### styles.css
```css
@import "~angular-advance-chart/styles.css";
```
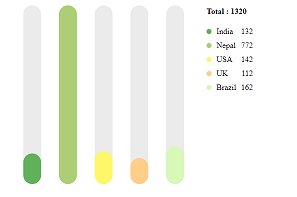
### Bar Chart Usage
#### bar-example.component.ts
```typescript
chartData: ChartData[] = [
{ name: "India", value: 132, color: "#61b15a" },
{ name: "Nepal", value: 772, color: "#adce74" },
{ name: "USA", value: 142, color: "#fff76a" },
{ name: "UK", value: 112, color: "#ffce89" },
{ name: "Brazil", value: 162, color: "#d8f8b7" }
];
chartOptions: BarChartOption = {
roundedCorners: false,
showLegend: true,
legendTitle: 'Total',
isHorizontal: false
}
barView: ChartView = {
height: 400,
width: 400
}
```
#### bar-example.component.html
```HTML
<ngx-bar-chart [chartData]='chartData' [chartOptions]='chartOptions' [view]='barView' ></ngx-bar-chart>
```
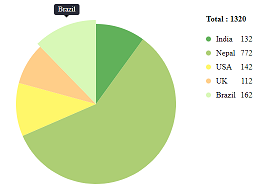
### Pie Chart Usage
#### pie-example.component.ts
```typescript
chartData: ChartData[] = [
{ name: "India", value: 132, color: "#61b15a" },
{ name: "Nepal", value: 772, color: "#adce74" },
{ name: "USA", value: 142, color: "#fff76a" },
{ name: "UK", value: 112, color: "#ffce89" },
{ name: "Brazil", value: 162, color: "#d8f8b7" }
];
pieView: PieChartView= {
height:400,
width:400,
radius:160
}
chartOptions: ChartOption = {
showLegend: true,
legendTitle: 'Total'
}
```
#### pie-example.component.html
```HTML
<ngx-pie-chart [chartData]='chartData' [view]='pieView' [chartOptions]='chartOptions'></ngx-pie-chart>
```
##### To add hover effect for pie-chart
```
.ngx-pie .chart-wrapper path:hover {
cursor: pointer;
transform-origin: center;
transform: scale(1.05);
}
```
### Donut Chart Usage
#### donut-example.component.ts
```typescript
chartData: ChartData[] = [
{ name: "India", value: 132, color: "#61b15a" },
{ name: "Nepal", value: 772, color: "#adce74" },
{ name: "USA", value: 142, color: "#fff76a" },
{ name: "UK", value: 112, color: "#ffce89" },
{ name: "Brazil", value: 162, color: "#d8f8b7" }
];
donutView: DonutChartView = {
height: 400,
width: 400,
radius: 160,
donutSize:40
}
chartOptions: ChartOption = {
showLegend: true,
legendTitle: 'Total'
}
```
#### donut-example.component.html
```HTML
<ngx-donut-chart [chartData]="chartData" [chartOptions]='chartOptions' [view]='donutView'></ngx-donut-chart>
```
##### To add hover effect for donut-chart
```
.ngx-donut .chart-wrapper path:hover {
cursor: pointer;
stroke-width: 55px;
}
```
## License
[](https://github.com/SomeshKb/Angular-Advance-Chart/blob/main/LICENSE)