@postlight/react-google-sheet-to-chart
Version:
Transform Google sheets to pretty charts!
140 lines (98 loc) • 4.44 kB
Markdown
# React Google Sheet to Chart
[Postlight](https://postlight.com)'s React Google Sheet to Chart React component transforms Google Sheets to attractive charts in your webapp with minimal effort. Read all about it in [this handy introduction](https://postlight.com/trackchanges/transform-google-sheets-into-beautiful-charts-with-postlights-new-react-component).
Try it now at the [demo site](https://robochart.netlify.com/) and check out the [demo site GitHub repository](https://github.com/postlight/robo-chart-web).
## Installation
The package can be installed via NPM:
```bash
npm install @postlight/react-google-sheet-to-chart --save
# or
yarn add @postlight/react-google-sheet-to-chart
```
## Usage
To use this component, you'll need a Google API key. First **enable** Google Sheets API and then generate the API Key [here](https://console.cloud.google.com/apis/credentials) and restrict it to HTTP referrers (web sites).
Second, you'll need a Google Sheet containing the data you wish to plot. (Be sure to check out [the spreadsheet format](#spreadsheet-format) guidelines.)
Finally, import the React component and initialize it with at least three required props:
- `id`: Spreadsheet ID, e.g. `1RE_JYUCXBXY2LNV5Tp5GegLnMue-CpfTVMxjdudZ8Js` (extractable from a Google sheet URL)
- `sheet`: Sheet name to parse data from, e.g. `Sheet1`
- `token`: The Google API key you created above
```javascript
import RoboChart from '@postlight/react-google-sheet-to-chart';
// ...your component code and then...
<RoboChart
id="GOOGLE_SPREADSHEET_ID"
sheet="Sheet1"
token="GENERATED_GOOGLE_API_KEY"
/>;
```
## Quick setup in an app
- [Create a React app](https://github.com/facebook/create-react-app):
```shell
yarn create react-app my-app
cd my-app
```
- Install the package
```shell
yarn add @postlight/react-google-sheet-to-chart
```
- Paste the following in `App.js` and replace `GOOGLE_SPREADSHEET_ID` and `GENERATED_GOOGLE_API_KEY` with appropriate values:
```javascript
import React, { Component } from 'react';
import RoboChart from '@postlight/react-google-sheet-to-chart';
import './App.css';
const style = { width: '1200px', margin: '0 auto' };
class App extends Component {
render() {
return (
<div style={style}>
<RoboChart
id="GOOGLE_SPREADSHEET_ID"
sheet="Sheet1"
token="GENERATED_GOOGLE_API_KEY"
/>
</div>
);
}
}
export default App;
```
- Start the project
```shell
yarn start
```
## Optional props
- `start` e.g. "A5" (`start` and `end` create a custom range for your data)
- `end` e.g. "E15"
- `title` This is the chart title, e.g. "My Accounts"
- `flipAxis` default: {false}
- `startFrom` default: {0}
- `stacked` Use only with type bar, default: {false}
- `type` default: "line", should be one of: "line", "bar", "horizontalBar", "pie", "semi-pie", "doughnut", "semi-doughnut"
- `colors` e.g. {['#a1a1a1', '#434343', '#ff0055']}
- `xsuffix` Add a suffix to x-Axis labels, e.g. " USD"
- `ysuffix` Add a suffix to y-Axis labels
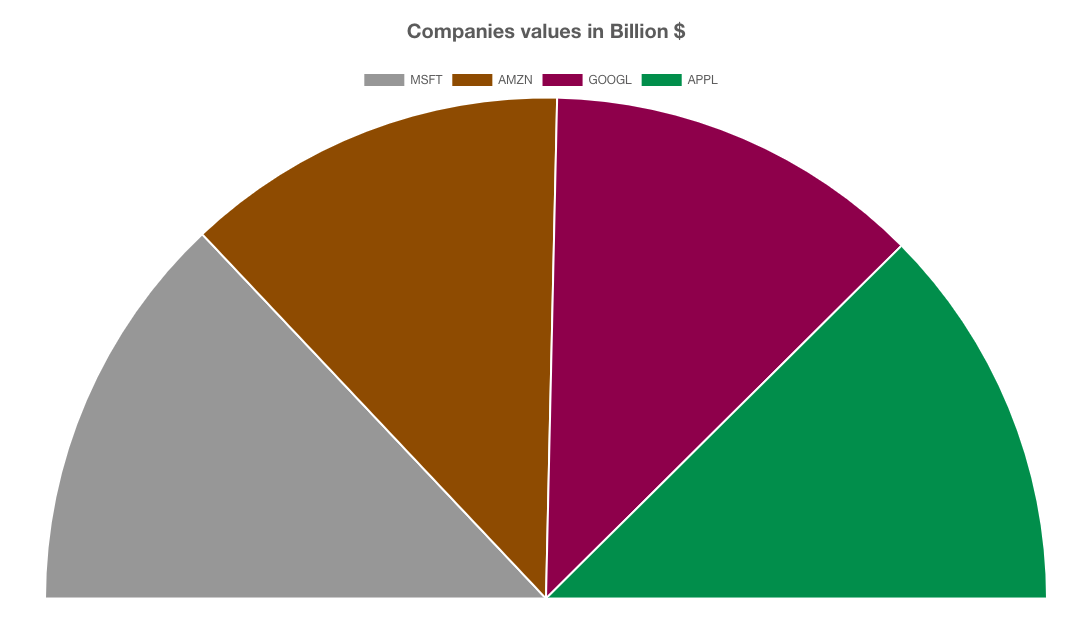
Example:
```javascript
<RoboChart
id="GOOGLE_SPREADSHEET_ID"
sheet="Companies Values"
token="GENERATED_GOOGLE_API_KEY"
type="semi-pie"
title="Companies values in Billion $"
colors={['#a1a1a1', '#995500', '#990055', '#009955']}
/>
```
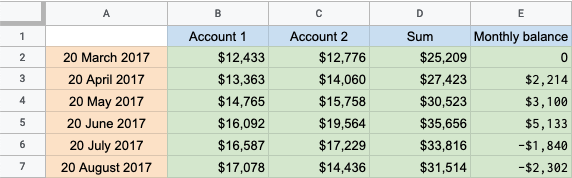
## Spreadsheet format
In order to successfuly generate a chart, the Spreadsheet should have Row titles, Column titles and Values, example:
## License
Licensed under either of the below, at your preference:
- Apache License, Version 2.0
([LICENSE-APACHE](LICENSE-APACHE) or http://www.apache.org/licenses/LICENSE-2.0)
- MIT license
([LICENSE-MIT](LICENSE-MIT) or http://opensource.org/licenses/MIT)
## Contributing
Unless it is explicitly stated otherwise, any contribution intentionally submitted for inclusion in the work, as defined in the Apache-2.0 license, shall be dual licensed as above without any additional terms or conditions.
---
🔬 A Labs project from your friends at [Postlight](https://postlight.com). Happy coding!