@eagleoutice/flowr
Version:
Static Dataflow Analyzer and Program Slicer for the R Programming Language
451 lines (352 loc) • 16.1 kB
Markdown
[](https://github.com/flowr-analysis/flowr/wiki)\
[](https://github.com/flowr-analysis/flowr/actions/workflows/qa.yaml)
[](https://codecov.io/gh/flowr-analysis/flowr)
[](https://hub.docker.com/r/eagleoutice/flowr)
[](https://github.com/flowr-analysis/flowr/releases/latest)
[](https://marketplace.visualstudio.com/items?itemName=code-inspect.vscode-flowr)
[](https://zenodo.org/doi/10.5281/zenodo.13319290)
_flowR_ is a sophisticated, static [dataflow analyzer](https://en.wikipedia.org/wiki/Data-flow_analysis) for the [R programming language](https://www.r-project.org/).
It offers a wide variety of features, for example:
* 🍕 **program slicing**\
Given a point of interest like the visualization of a plot, _flowR_ reduces the program to just the parts which are relevant
for the computation of the point of interest.
<details><summary style="">Example: Slicing with flowR</summary>
The simplest way to retrieve slices is with flowR's [Visual Studio Code extension](https://marketplace.visualstudio.com/items?itemName=code-inspect.vscode-flowr).
However, you can slice using the [REPL](https://github.com/flowr-analysis/flowr/wiki/Interface#using-the-repl) as well.
This can help you if you want to reuse specific parts of an existing analysis within another context or if you want to understand
what is happening in the code.
For this, let's have a look at the example file, located at [test/testfiles/example.R](https://github.com/flowr-analysis/flowr/tree/main//test/testfiles/example.R):
```r
sum <- 0
product <- 1
w <- 7
N <- 10
for (i in 1:(N-1)) {
sum <- sum + i + w
product <- product * i
}
cat("Sum:", sum, "\n")
cat("Product:", product, "\n")
```
Let's suppose we are interested only in the `sum` which is printed in line 11.
To get a slice for this, you can use the following command:
```shell
$ docker run -it --rm eagleoutice/flowr # or npm run flowr
flowR repl using flowR v2.2.11, R v4.4.3 (r-shell engine)
R> :slicer test/testfiles/example.R --criterion "11@sum"
```
<details>
<summary style='color:gray'>Output</summary>
```text
sum <- 0
w <- 7
N <- 10
for(i in 1:(N-1)) sum <- sum + i + w
sum
```
</details>
</details>
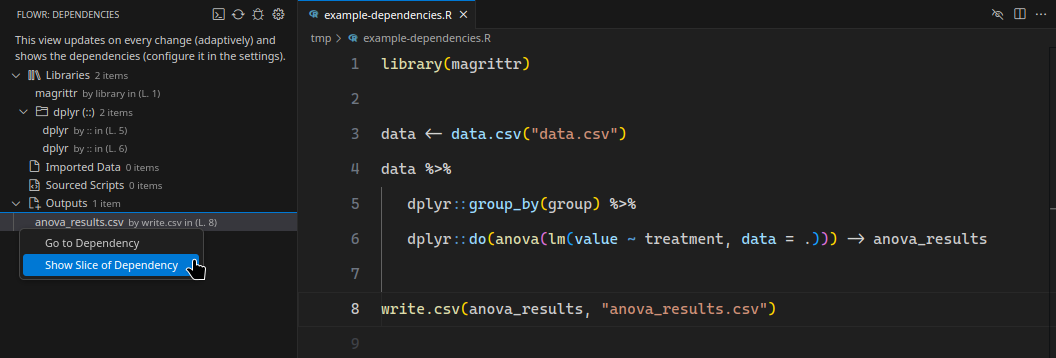
* 📚 **dependency analysis**\
Given your analysis project, flowR offers a plethora of so-called [queries](https://github.com/flowr-analysis/flowr/wiki/Query-API) to get more information about your code.
An important query is the [dependencies query](https://github.com/flowr-analysis/flowr/wiki/Query-API#dependencies-query), which shows you the library your project needs,
the data files it reads, the scripts it sources, and the data it outputs.
<details><summary style="">Example: Dependency Analysis with flowR</summary>
The following showcases the dependency view of the [Visual Studio Code extension](https://marketplace.visualstudio.com/items?itemName=code-inspect.vscode-flowr):
</details>
* 🚀 **fast data- and control-flow graphs**\
Within just <i><span title="This measurement is automatically fetched from the latest benchmark!">117.9 ms</span></i> (as of Mar 2, 2025),
_flowR_ can analyze the data- and control-flow of the average real-world R script. See the [benchmarks](https://flowr-analysis.github.io/flowr/wiki/stats/benchmark) for more information,
and consult the [wiki pages](https://github.com/flowr-analysis/flowr/wiki/Dataflow-Graph) for more details on the dataflow graph.
<details><summary style="">Example: Generating a dataflow graph with flowR</summary>
You can investigate flowR's analyses using the [REPL](https://github.com/flowr-analysis/flowr/wiki/Interface#using-the-repl).
Commands like <span title="Description (Repl Command, starred version): Returns the URL to mermaid.live; Base Command: Get mermaid code for the dataflow graph of R code, start with 'file://' to indicate a file (aliases: :d*, :df*)">`:dataflow*`</span> allow you to view a dataflow graph for a given R script.
Let's have a look at the following example:
```r
sum <- 0
product <- 1
w <- 7
N <- 10
for (i in 1:(N-1)) {
sum <- sum + i + w
product <- product * i
}
cat("Sum:", sum, "\n")
cat("Product:", product, "\n")
```
To get the dataflow graph for this script, you can use the following command:
```shell
$ docker run -it --rm eagleoutice/flowr # or npm run flowr
flowR repl using flowR v2.2.11, R v4.4.3 (r-shell engine)
R> :dataflow* test/testfiles/example.R
```
<details>
<summary style='color:gray'>Output</summary>
```text
https://mermaid.live/view#base64:eyJjb2RlIjoiZmxvd2NoYXJ0IEJUXG4gICAgMChbXCJgIzkxO1JTeW1ib2wjOTM7IHRlc3RcbiAgICAgICgwKVxuICAgICAgKjEuMS00KmBcIl0pXG4gICAgMShbXCJgIzkxO1JTeW1ib2wjOTM7IHRlc3RmaWxlc1xuICAgICAgKDEpXG4gICAgICAqMS42LTE0KmBcIl0pXG4gICAgMltbXCJgIzkxO1JCaW5hcnlPcCM5MzsgL1xuICAgICAgKDIpXG4gICAgICAqMS4xLTE0KlxuICAgICgwLCAxKWBcIl1dXG4gICAgMyhbXCJgIzkxO1JTeW1ib2wjOTM7IGV4YW1wbGUuUlxuICAgICAgKDMpXG4gICAgICAqMS4xNi0yNCpgXCJdKVxuICAgIDRbW1wiYCM5MTtSQmluYXJ5T3AjOTM7IC9cbiAgICAgICg0KVxuICAgICAgKjEuMS0yNCpcbiAgICAoMiwgMylgXCJdXVxuICAgIDIgLS0+fFwicmVhZHMsIGFyZ3VtZW50XCJ8IDBcbiAgICAyIC0tPnxcInJlYWRzLCBhcmd1bWVudFwifCAxXG4gICAgNCAtLT58XCJyZWFkcywgYXJndW1lbnRcInwgMlxuICAgIDQgLS0+fFwicmVhZHMsIGFyZ3VtZW50XCJ8IDMiLCJtZXJtYWlkIjp7ImF1dG9TeW5jIjp0cnVlfX0=
```
Following the link output should show the following:
```mermaid
flowchart LR
1{{"`#91;RNumber#93; 0
(1)
*1.8*`"}}
0["`#91;RSymbol#93; sum
(0)
*1.1-3*`"]
2[["`#91;RBinaryOp#93; #60;#45;
(2)
*1.1-8*
(0, 1)`"]]
4{{"`#91;RNumber#93; 1
(4)
*2.12*`"}}
3["`#91;RSymbol#93; product
(3)
*2.1-7*`"]
5[["`#91;RBinaryOp#93; #60;#45;
(5)
*2.1-12*
(3, 4)`"]]
7{{"`#91;RNumber#93; 7
(7)
*3.6*`"}}
6["`#91;RSymbol#93; w
(6)
*3.1*`"]
8[["`#91;RBinaryOp#93; #60;#45;
(8)
*3.1-6*
(6, 7)`"]]
10{{"`#91;RNumber#93; 10
(10)
*4.6-7*`"}}
9["`#91;RSymbol#93; N
(9)
*4.1*`"]
11[["`#91;RBinaryOp#93; #60;#45;
(11)
*4.1-7*
(9, 10)`"]]
12["`#91;RSymbol#93; i
(12)
*6.6*`"]
13{{"`#91;RNumber#93; 1
(13)
*6.11*`"}}
16(["`#91;RSymbol#93; N
(16)
*6.14*`"])
17{{"`#91;RNumber#93; 1
(17)
*6.16*`"}}
18[["`#91;RBinaryOp#93; #45;
(18)
*6.14-16*
(16, 17)`"]]
19[["`#91;RExpressionList#93; (
(19)
*6.13*
(18)`"]]
20[["`#91;RBinaryOp#93; #58;
(20)
*6.11-17*
(13, 19)`"]]
24(["`#91;RSymbol#93; sum
(24, :may:36+)
*7.10-12*`"])
25(["`#91;RSymbol#93; i
(25, :may:36+)
*7.16*`"])
26[["`#91;RBinaryOp#93; #43;
(26, :may:36+)
*7.10-16*
(24, 25)`"]]
27(["`#91;RSymbol#93; w
(27, :may:36+)
*7.20*`"])
28[["`#91;RBinaryOp#93; #43;
(28, :may:36+)
*7.10-20*
(26, 27)`"]]
23["`#91;RSymbol#93; sum
(23, :may:)
*7.3-5*`"]
29[["`#91;RBinaryOp#93; #60;#45;
(29, :may:36+)
*7.3-20*
(23, 28)`"]]
31(["`#91;RSymbol#93; product
(31, :may:36+)
*8.14-20*`"])
32(["`#91;RSymbol#93; i
(32, :may:36+)
*8.24*`"])
33[["`#91;RBinaryOp#93; #42;
(33, :may:36+)
*8.14-24*
(31, 32)`"]]
30["`#91;RSymbol#93; product
(30, :may:)
*8.3-9*`"]
34[["`#91;RBinaryOp#93; #60;#45;
(34, :may:36+)
*8.3-24*
(30, 33)`"]]
35[["`#91;RExpressionList#93; #123;
(35, :may:36+)
*6.20*
(29, 34)`"]]
36[["`#91;RForLoop#93; for
(36)
*6.1-9.1*
(12, 20, 35)`"]]
38{{"`#91;RString#93; #34;Sum#58;#34;
(38)
*11.5-10*`"}}
40(["`#91;RSymbol#93; sum
(40)
*11.13-15*`"])
42{{"`#91;RString#93; #34;
#34;
(42)
*11.18-21*`"}}
44[["`#91;RFunctionCall#93; cat
(44)
*11.1-22*
(38, 40, 42)`"]]
46{{"`#91;RString#93; #34;Product#58;#34;
(46)
*12.5-14*`"}}
48(["`#91;RSymbol#93; product
(48)
*12.17-23*`"])
50{{"`#91;RString#93; #34;
#34;
(50)
*12.26-29*`"}}
52[["`#91;RFunctionCall#93; cat
(52)
*12.1-30*
(46, 48, 50)`"]]
0 -->|"defined-by"| 1
0 -->|"defined-by"| 2
2 -->|"argument"| 1
2 -->|"returns, argument"| 0
3 -->|"defined-by"| 4
3 -->|"defined-by"| 5
5 -->|"argument"| 4
5 -->|"returns, argument"| 3
6 -->|"defined-by"| 7
6 -->|"defined-by"| 8
8 -->|"argument"| 7
8 -->|"returns, argument"| 6
9 -->|"defined-by"| 10
9 -->|"defined-by"| 11
11 -->|"argument"| 10
11 -->|"returns, argument"| 9
12 -->|"defined-by"| 20
16 -->|"reads"| 9
18 -->|"reads, argument"| 16
18 -->|"reads, argument"| 17
19 -->|"returns, argument"| 18
20 -->|"reads, argument"| 13
20 -->|"reads, argument"| 19
24 -->|"reads"| 0
24 -->|"reads"| 23
24 -->|"CD-True"| 36
linkStyle 25 stroke:gray,color:gray;
25 -->|"reads"| 12
25 -->|"CD-True"| 36
linkStyle 27 stroke:gray,color:gray;
26 -->|"reads, argument"| 24
26 -->|"reads, argument"| 25
26 -->|"CD-True"| 36
linkStyle 30 stroke:gray,color:gray;
27 -->|"reads"| 6
27 -->|"CD-True"| 36
linkStyle 32 stroke:gray,color:gray;
28 -->|"reads, argument"| 26
28 -->|"reads, argument"| 27
28 -->|"CD-True"| 36
linkStyle 35 stroke:gray,color:gray;
23 -->|"defined-by"| 28
23 -->|"defined-by"| 29
29 -->|"argument"| 28
29 -->|"returns, argument"| 23
29 -->|"CD-True"| 36
linkStyle 40 stroke:gray,color:gray;
31 -->|"reads"| 3
31 -->|"reads"| 30
31 -->|"CD-True"| 36
linkStyle 43 stroke:gray,color:gray;
32 -->|"reads"| 12
32 -->|"CD-True"| 36
linkStyle 45 stroke:gray,color:gray;
33 -->|"reads, argument"| 31
33 -->|"reads, argument"| 32
33 -->|"CD-True"| 36
linkStyle 48 stroke:gray,color:gray;
30 -->|"defined-by"| 33
30 -->|"defined-by"| 34
34 -->|"argument"| 33
34 -->|"returns, argument"| 30
34 -->|"CD-True"| 36
linkStyle 53 stroke:gray,color:gray;
35 -->|"argument"| 29
35 -->|"returns, argument"| 34
35 -->|"CD-True"| 36
linkStyle 56 stroke:gray,color:gray;
36 -->|"reads, argument"| 12
36 -->|"reads, argument"| 20
36 -->|"argument, non-standard-evaluation"| 35
40 -->|"reads"| 0
40 -->|"reads"| 23
44 -->|"argument"| 38
44 -->|"reads, argument"| 40
44 -->|"argument"| 42
48 -->|"reads"| 3
48 -->|"reads"| 30
52 -->|"argument"| 46
52 -->|"reads, argument"| 48
52 -->|"argument"| 50
```
(The analysis required _22.14 ms_ (including parse and normalize, using the [r-shell](https://github.com/flowr-analysis/flowr/wiki/Engines) engine) within the generation environment.)
</details>
</details>
If you want to use flowR and the features it provides, feel free to check out the:
- [Visual Studio Code extension](https://marketplace.visualstudio.com/items?itemName=code-inspect.vscode-flowr): provides access to flowR directly in VS Code (or [vscode.dev](https://vscode.dev/))
- [RStudio Addin](https://github.com/flowr-analysis/rstudio-addin-flowr): integrates flowR into [RStudio](https://posit.co/downloads/)
- [R package](https://github.com/flowr-analysis/flowr-r-adapter): use flowR in your R scripts
- [Docker image](https://hub.docker.com/r/eagleoutice/flowr): run flowR in a container, this also includes [flowR's server](https://github.com/flowr-analysis/flowr/wiki/Interface#communicating-with-the-server)
- [NPM package](https://www.npmjs.com/package/@eagleoutice/flowr): include flowR in your TypeScript and JavaScript projects
## ⭐ Getting Started
To get started with _flowR_ and its features, please check out the [Overview](https://github.com/flowr-analysis/flowr/wiki/Overview) wiki page.
The [Setup](https://github.com/flowr-analysis/flowr/wiki/Setup) wiki page explains how you can download and setup _flowR_ on your system.
With docker 🐳️, the following line should be enough (and drop you directly into the read-eval-print loop):
```shell
docker run -it --rm eagleoutice/flowr
```
You can enter <span title="Description (Repl Command): Show help information (aliases: :h, :?)">`:help`</span> to gain more information on its capabilities.
<details>
<summary>Example REPL session</summary>

</details>
## 📜 More Information
For more details on how to use _flowR_ please refer to the [wiki pages](https://github.com/flowr-analysis/flowr/wiki),
as well as the deployed [code documentation](https://flowr-analysis.github.io/flowr/doc/).
## 🚀 Contributing
We welcome every contribution! Please check out the [contributing guidelines](https://github.com/flowr-analysis/flowr/tree/main/.github/CONTRIBUTING.md) for more information.
### Contributors
<a href="https://github.com/flowr-analysis/flowr/graphs/contributors">
<img src="https://contrib.rocks/image?repo=flowr-analysis/flowr" alt="flowR Contributors"/>
</a>
----
*flowr* is actively developed by [Florian Sihler](https://eagleoutice.github.io/portfolio/) under the
[GPLv3 License](LICENSE).\
It is partially supported by the German Research Foundation (DFG) under the grant [504226141](https://gepris.dfg.de/gepris/projekt/504226141) ("CodeInspector").
----
### Generation Notice
Please notice that this file was generated automatically using the file [src/documentation/print-readme.ts](https://github.com/flowr-analysis/flowr/tree/main//src/documentation/print-readme.ts) as a source.\
If you want to make changes please edit the source file (the CI will take care of the rest).
In fact, many files in the [wiki](https://github.com/flowr-analysis/flowr/wiki) are generated, so make sure to check for the source file if you want to make changes.