@douyinfe/semi-ui
Version:
A modern, comprehensive, flexible design system and UI library. Connect DesignOps & DevOps. Quickly build beautiful React apps. Maintained by Douyin-fe team.
70 lines (50 loc) • 3.06 kB
Markdown
localeCode: en-US
order: 86
category: Show
title: Data Visualization
icon: doc-vchart
dir: column
brief: Semi DV is a data visualization solution for Semi design systems.
Semi DV is a data visualization solution built on top of ByteDance's open-source library [VChart](https://visactor.io/vchart), packaged with styles that match the Semi Design system.
VChart itself is built using the visualization grammar library VGrammar and the rendering engine VRender. VChart not only supports high-quality data presentation, but also provides animation sequencing for storytelling, rich interactive capabilities, and customizable chart styles. On top of this, Semi DV supports chart theme configuration, helping users maintain a consistent UI while enabling flexible and personalized data visualization.
Semi DV supports two configuration modes:
- Simple Mode: Easily customize a chart theme by setting theme colors, choosing a palette, and adjusting corner radius, spacing, and line thickness.
- Advanced Mode: Fine-tune your chart from the ground up, customizing tokens (color, font, radius, spacing, lines, animations), elements (title, axes, legend, interactive elements), and charts (bar, line, area, pie, funnel, etc.) for full control and precision.
### Create a Chart Theme
Go to [Design System Creation](https://semi.design/dsm/design_system_list?type=vcharts) and click the "Create a chart design system" Button. After finishing your configuration, with a single click, you can publish the theme to npm.
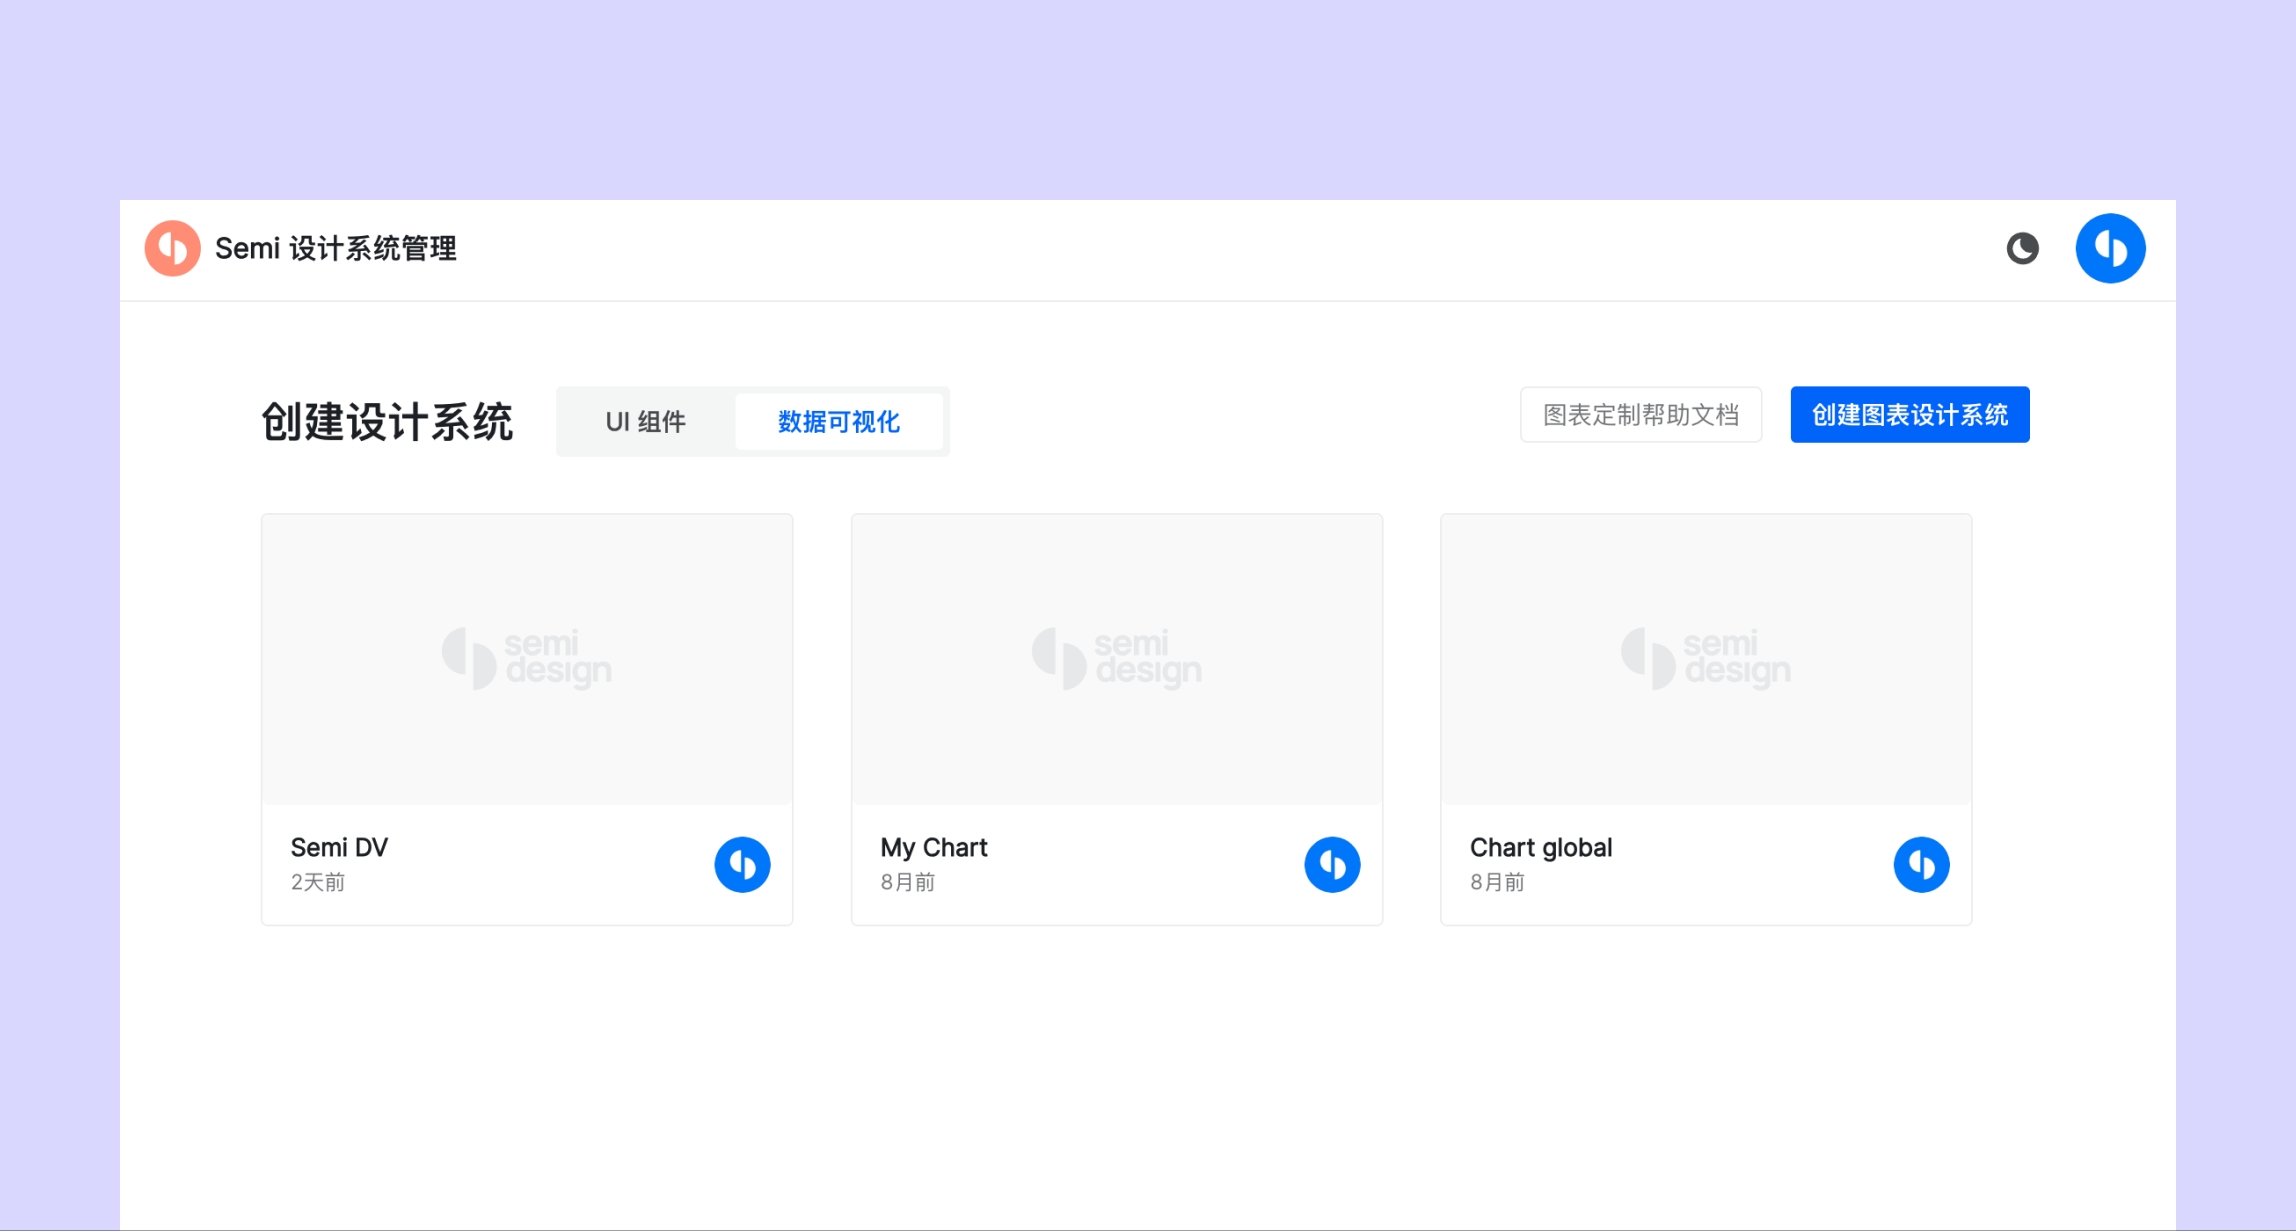
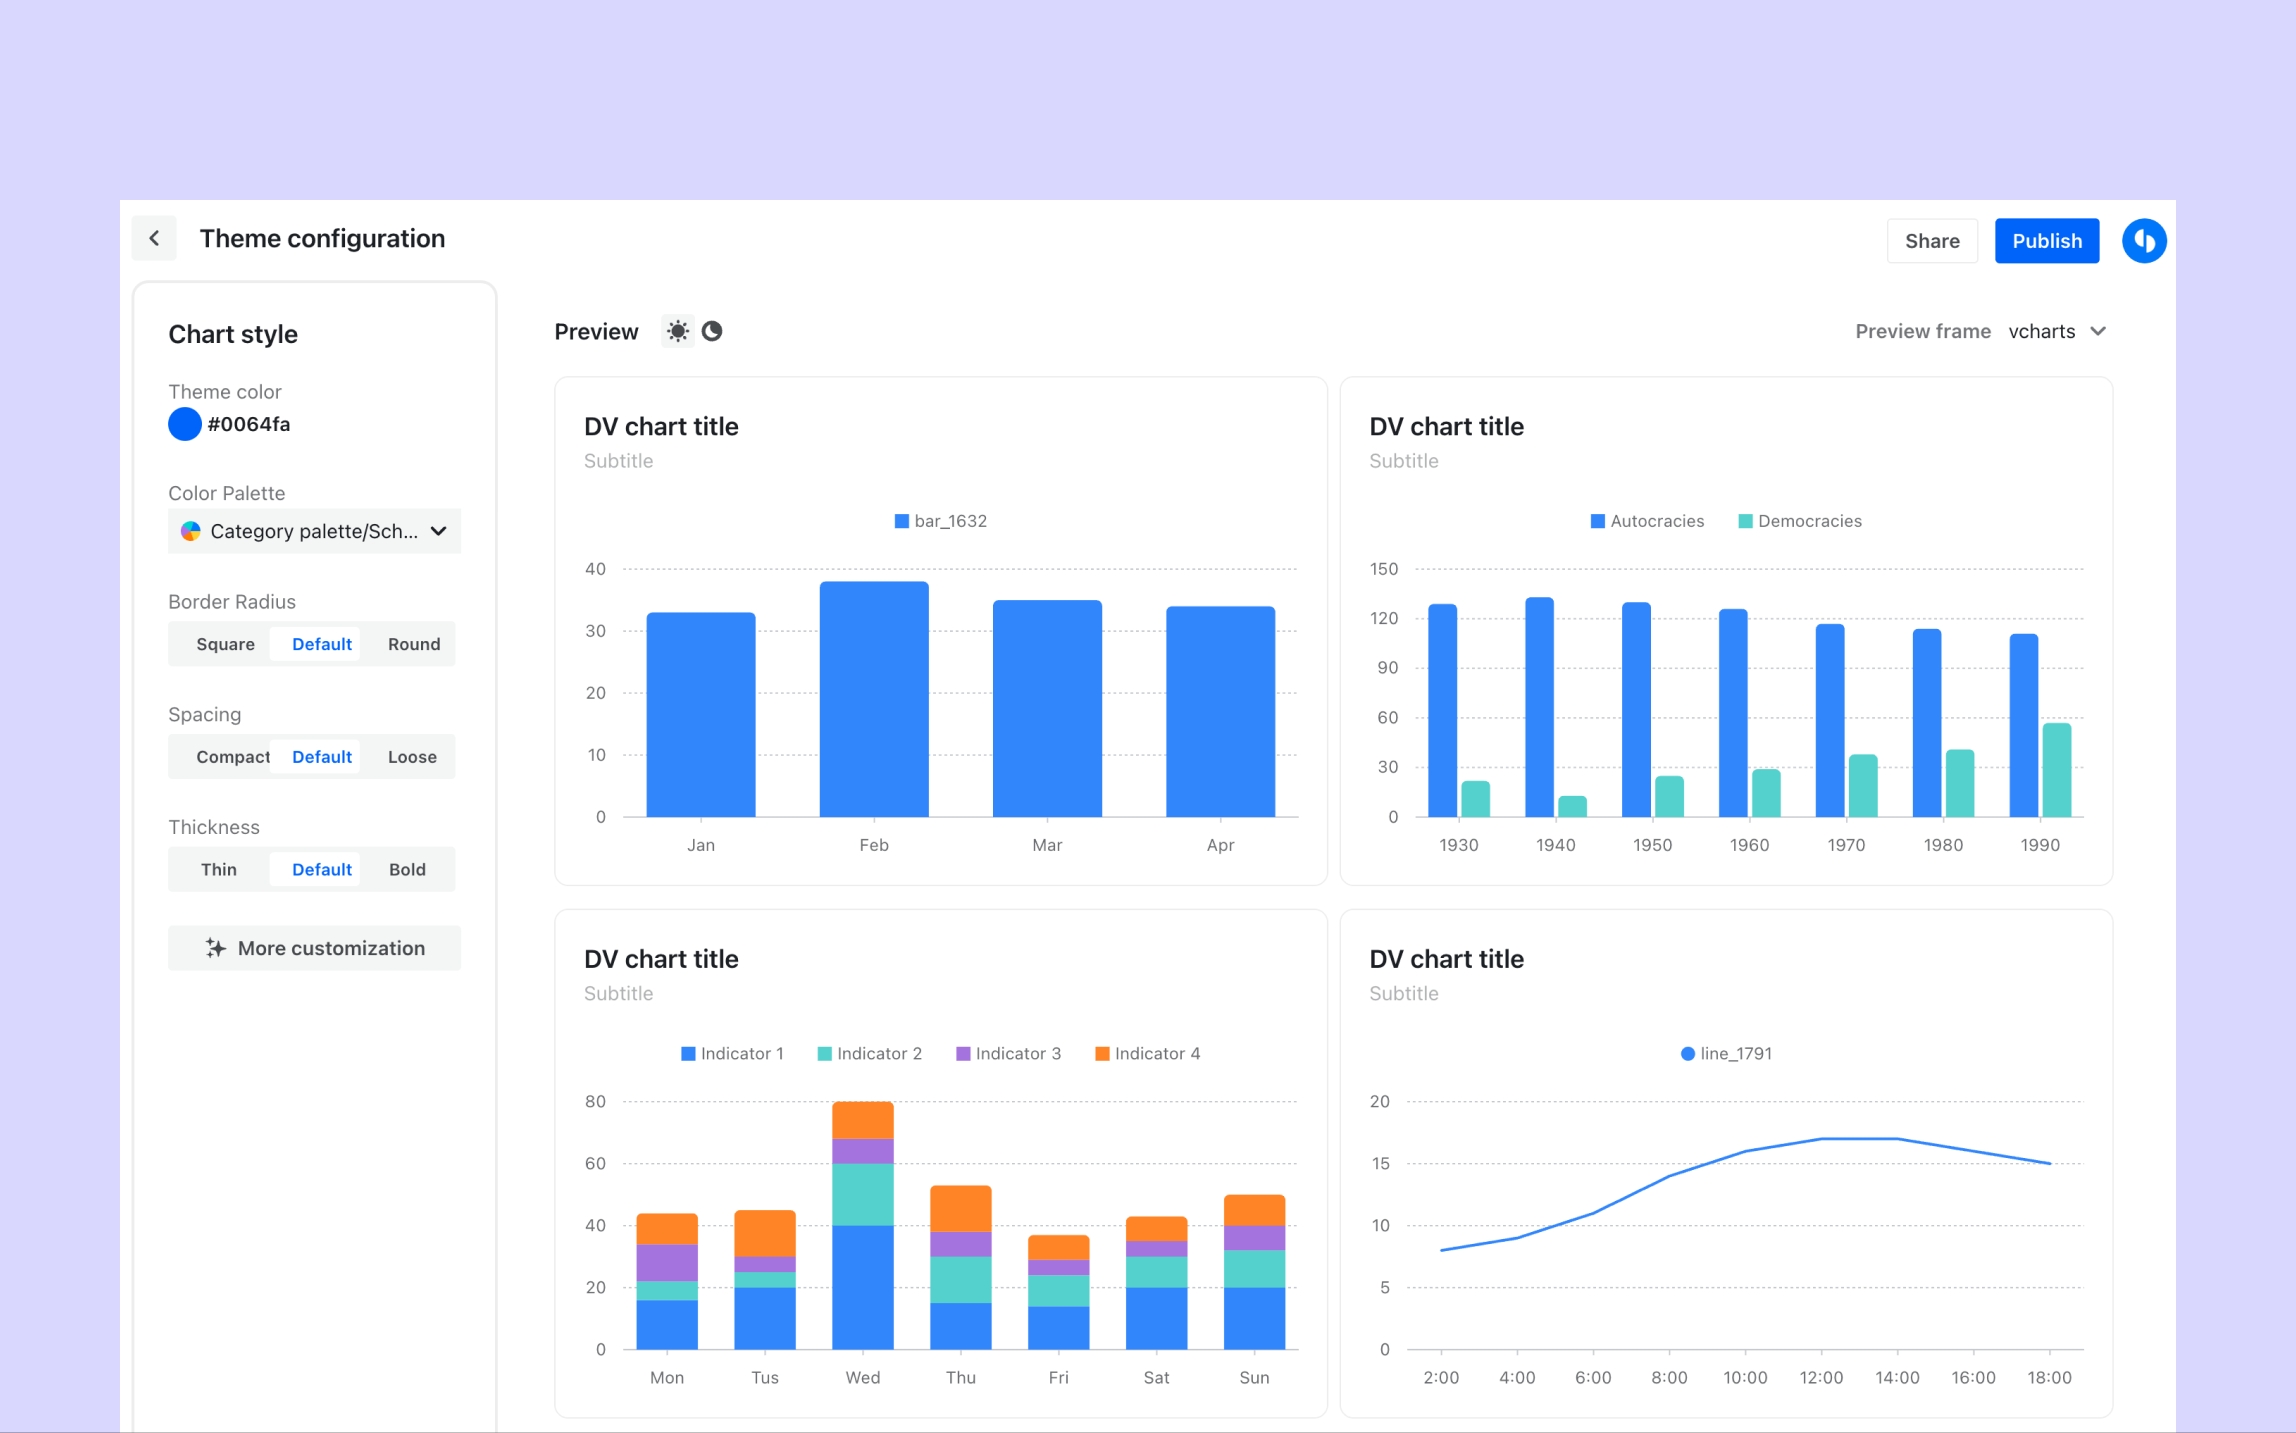
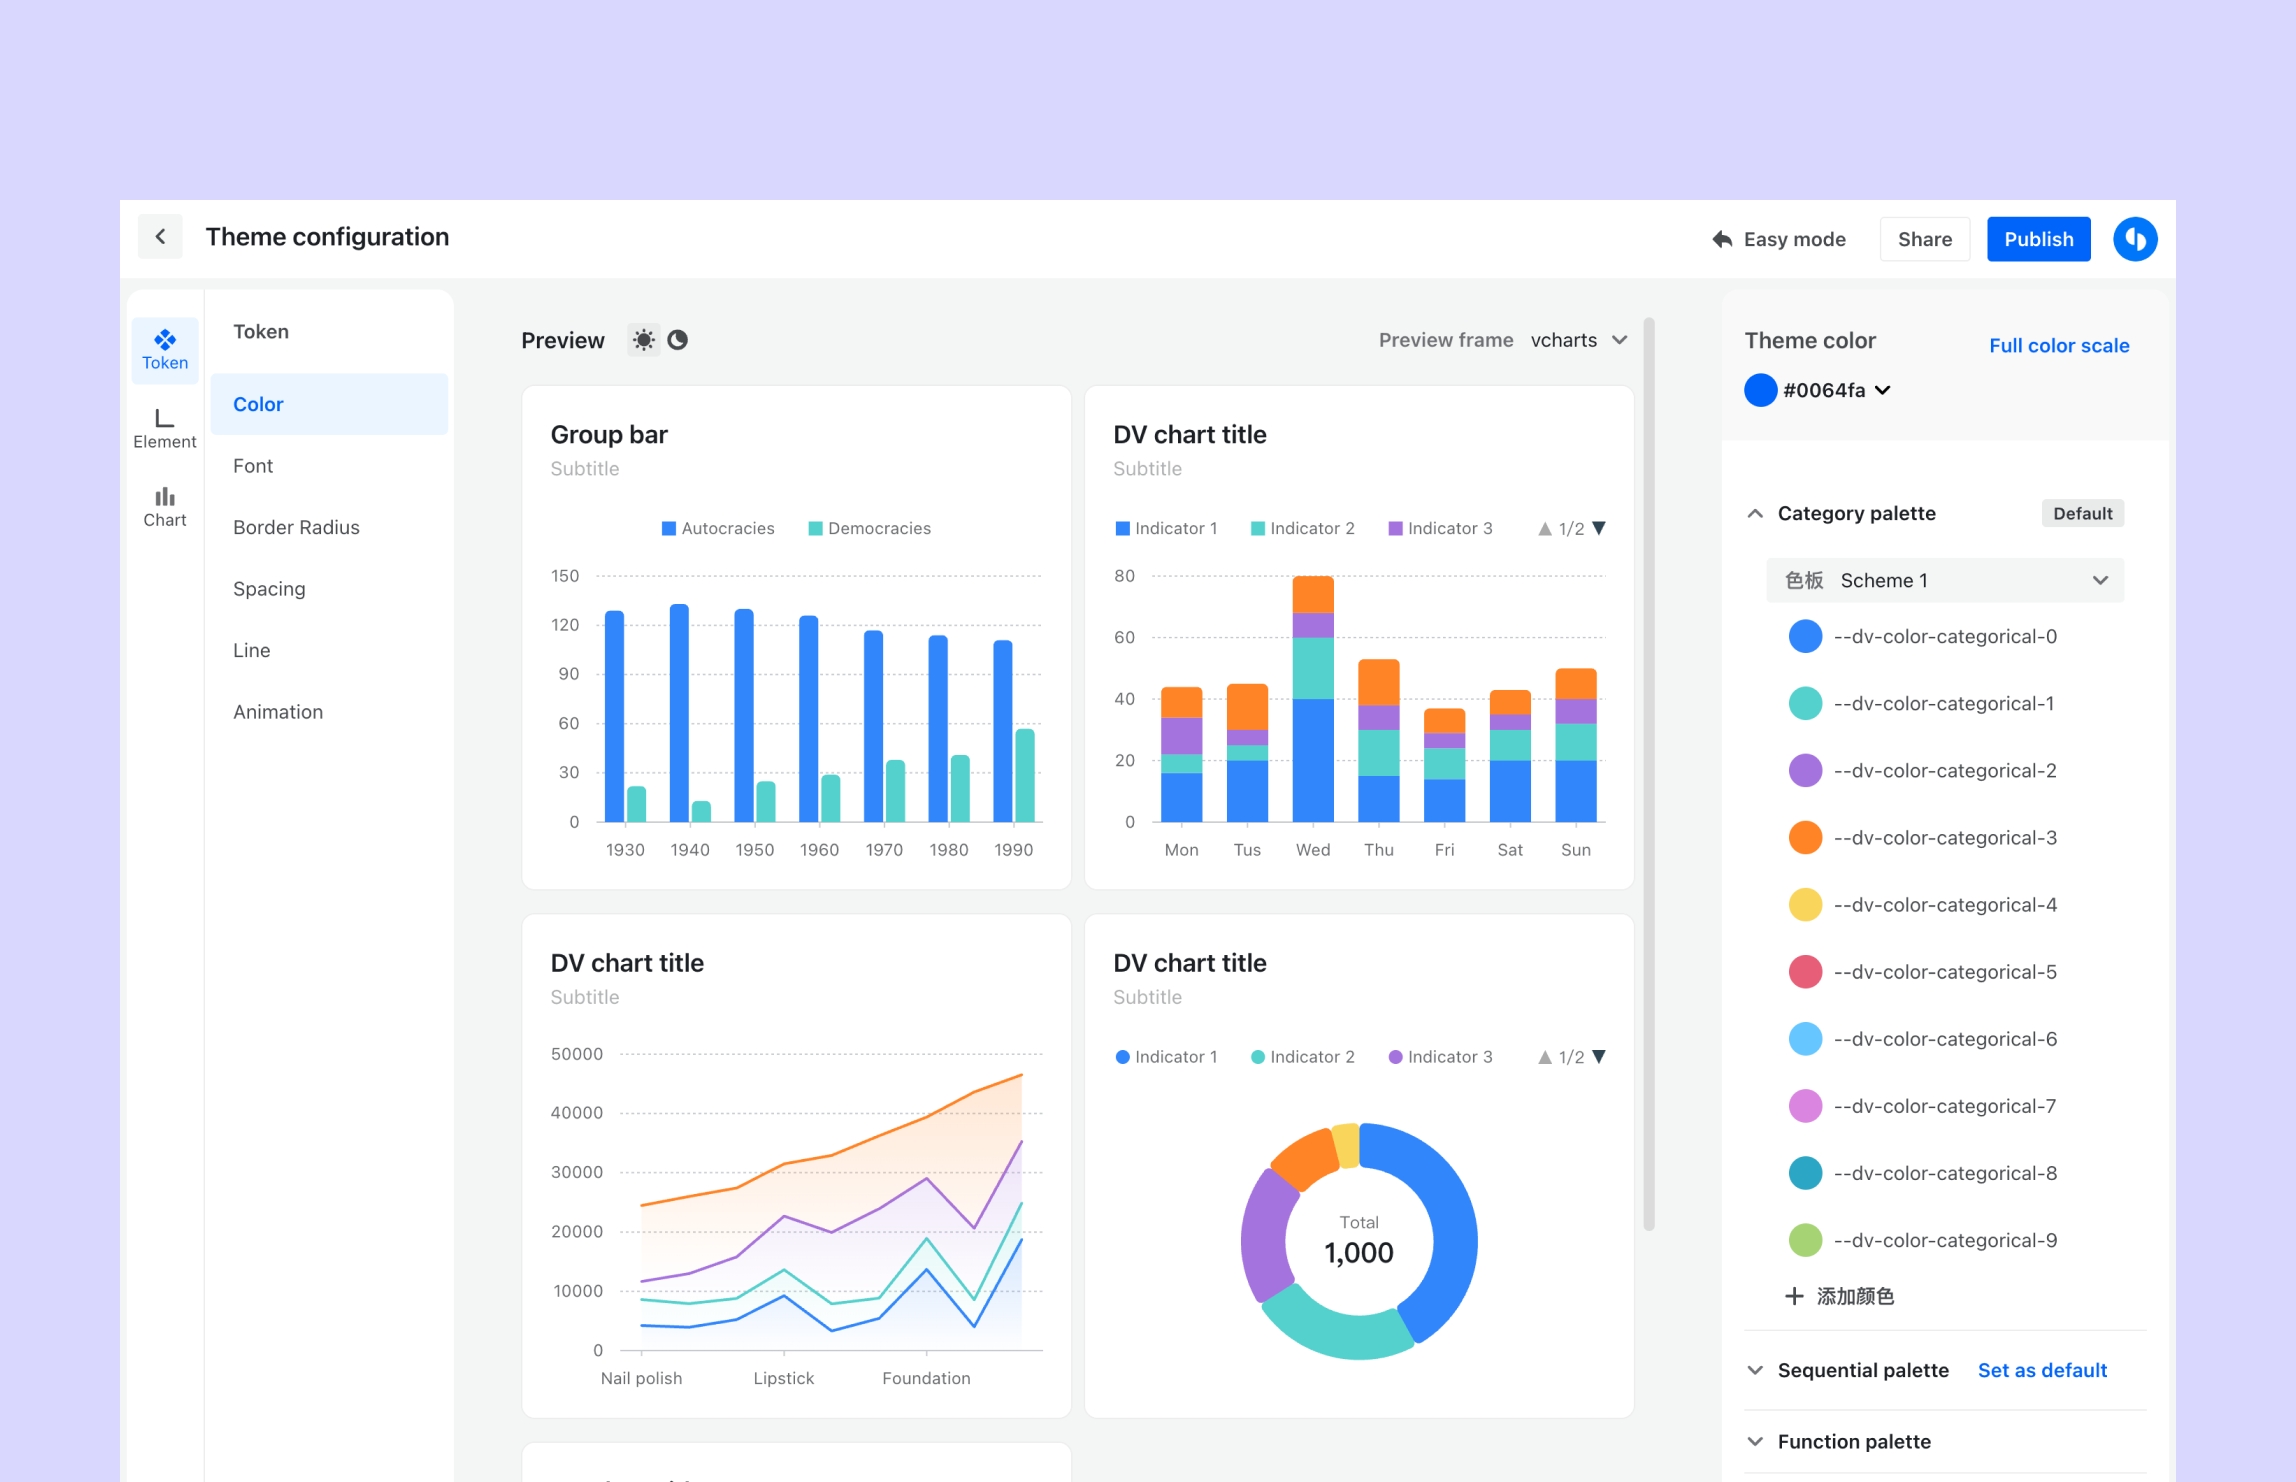
For more detailed documentation on customizing themes, see [Theme Creation Guide](https://semi.design/dsm_vchart/doc/en-US/introduction/start#dsm_Customizethetheme)
### Using a Theme
Install VChart
```shell
# Using npm
npm install @visactor/react-vchart
# Using yarn
yarn add @visactor/react-vchart
```
The theme package will be published by your designer via Semi DV. Please check with the designer for the correct package name. Assuming the package is called `@ies/semi-vchart-theme-test`, you can install it as follows:
```shell
npm install @ies/semi-vchart-theme-test
# or
yarn add @ies/semi-vchart-theme-test
```
Import the Theme
```js
// VChart light theme
import vchartLight from "@ies/semi-vchart-theme-test/light.json";
// VChart dark theme
import vchartDark from "@ies/semi-vchart-theme-test/dark.json";
```
Register the Theme
```js
import VChart from '@visactor/vchart';
VChart.ThemeManager.registerTheme("myLightTheme", vchartLight);
// Apply a theme
VChart.ThemeManager.setCurrentTheme('myLightTheme');
```
### Using Chart Themes in Figma
Install the [Figma plugin](/en-US/start/design-source) to select a theme and draw themed charts directly within your designs.