@arcgis/map-components
Version:
ArcGIS Map Components
461 lines (460 loc) • 27.3 kB
TypeScript
/// <reference path="../../index.d.ts" />
import type ColorSizeStop from "@arcgis/core/renderers/visualVariables/support/ColorSizeStop.js";
import type { VisualVariable } from "@arcgis/core/widgets/smartMapping/ColorSizeSlider.js";
import type { PublicLitElement as LitElement } from "@arcgis/lumina";
import type { HistogramResult } from "@arcgis/core/smartMapping/statistics/types.js";
import type { RendererResult } from "@arcgis/core/smartMapping/renderers/univariateColorSize.js";
import type { ArcgisReferenceElement, IconName } from "../types.js";
import type { ThumbDragEvent, ThumbChangeEvent } from "@arcgis/core/widgets/Slider/types.js";
import type { HistogramConfig, ZoomOptions } from "@arcgis/core/widgets/smartMapping/types.js";
import type { LabelFormatFunction, InputParseFunction } from "@arcgis/core/widgets/types.js";
import type { SmartMappingSliderBaseState } from "@arcgis/core/widgets/smartMapping/SmartMappingSliderBase.js";
/**
* > [!WARNING]
* >
* > This is a **legacy component**. It relies on an underlying widget as part of our migration to native web components.
* >
* > A fully native replacement for this component is in development. Once it reaches feature parity, the legacy component will be deprecated and no longer maintained. At that point, development should use the native component.
*
* The Color Size Slider component is intended for authoring and exploring data-driven visualizations in any
* layer that can be rendered with a [ColorVariable](https://developers.arcgis.com/javascript/latest/references/core/renderers/visualVariables/ColorVariable/) and
* a [SizeVariable](https://developers.arcgis.com/javascript/latest/references/core/renderers/visualVariables/SizeVariable/). Both visual variables should be used
* to visualize the same data variable.
*
* This slider and visualization style is designed specifically for
* 3D thematic visualizations where both size and color are used to visualize the same data variable in order
* to minimize confusion because of distortion in perception. For example, a visualization of extruded points
* may be difficult to understand if two features of similar sizes (and therefore data values) are located
* far apart from one another; the feature furthest from the [Camera](https://developers.arcgis.com/javascript/latest/references/core/Camera/) will appear smaller than
* the feature closer to the camera. The color variable can help the user understand that both features have similar values.
*
* 
*
* See the image below for a summary of the configurable options available on this slider.
*
* 
*
* The [updateFromRendererResult()](https://developers.arcgis.com/javascript/latest/references/map-components/components/arcgis-slider-color-size-legacy/#updateFromRendererResult) method can be used to intelligently populate slider properties including
* [max](https://developers.arcgis.com/javascript/latest/references/map-components/components/arcgis-slider-color-size-legacy/#max), [min](https://developers.arcgis.com/javascript/latest/references/map-components/components/arcgis-slider-color-size-legacy/#min), [size visual variable](https://developers.arcgis.com/javascript/latest/references/core/renderers/visualVariables/SizeVariable/) configuration,
* [color visual variable](https://developers.arcgis.com/javascript/latest/references/core/renderers/visualVariables/ColorVariable/) configuration, and the slider's histogram after the
* renderer has been created from the result of the [createContinuousRenderer()](https://developers.arcgis.com/javascript/latest/references/core/smartMapping/renderers/univariateColorSize/#createContinuousRenderer) method.
*
* ```js
* const colorAndSizeRendererCreator = await import("@arcgis/core/smartMapping/renderers/univariateColorSize.js");
* const viewElement = document.querySelector("arcgis-map")!;
* const colorSizeSlider = document.querySelector("arcgis-slider-color-size-legacy")!;
*
* const featureLayer = new FeatureLayer({
* url: "https://services.arcgis.com/P3ePLMYs2RVChkJx/arcgis/rest/services/ACS_Poverty_by_Age_Boundaries/FeatureServer/1",
* });
*
* await viewElement.viewOnReady();
* viewElement.map?.add(featureLayer);
*
* const params = {
* layer: featureLayer,
* field: "B17020_calc_pctPovE",
* view: viewElement.view,
* };
*
* const rendererResult = await colorAndSizeRendererCreator.createContinuousRenderer(params);
*
* featureLayer.renderer = rendererResult.renderer;
*
* const histogramResult = await histogram({
* ...params,
* numBins: 30,
* });
*
* await colorSizeSlider?.updateFromRendererResult(rendererResult, histogramResult);
* ```
*
* This slider should be used to update the corresponding [color](https://developers.arcgis.com/javascript/latest/references/core/renderers/visualVariables/ColorVariable/)
* and [size](https://developers.arcgis.com/javascript/latest/references/core/renderers/visualVariables/SizeVariable/) visual variables in a layer's renderer. It is the responsibility of the app developer
* to set up event listeners on this slider that update these variables in the appropriate renderer.
*
* ```js
* const updateRendererFromSlider = () => {
* const renderer = featureLayer?.renderer?.clone();
* if (!renderer || !("visualVariables" in renderer) || !renderer.visualVariables?.[0]) {
* return;
* }
* renderer.visualVariables = colorSizeSlider.updateVisualVariables(
* renderer.visualVariables as VisualVariable[],
* );
* featureLayer.renderer = renderer;
* };
*
* colorSizeSlider.addEventListener("arcgisThumbChange", updateRendererFromSlider);
* colorSizeSlider.addEventListener("arcgisThumbDrag", updateRendererFromSlider);
* colorSizeSlider.addEventListener("arcgisPropertyChange", updateRendererFromSlider);
* ```
*
* @since 5.0
* @see [univariateColorSizeRendererCreator](https://developers.arcgis.com/javascript/latest/references/core/smartMapping/renderers/univariateColorSize/)
*/
export abstract class ArcgisSliderColorSizeLegacy extends LitElement {
/**
* If true, the component will not be destroyed automatically when it is
* disconnected from the document. This is useful when you want to move the
* component to a different place on the page, or temporarily hide it. If this
* is set, make sure to call the [destroy()](https://developers.arcgis.com/javascript/latest/references/map-components/components/arcgis-slider-color-size-legacy/#destroy) method when you are done to
* prevent memory leaks.
*
* @default false
*/
accessor autoDestroyDisabled: boolean;
/**
* Only applicable when three thumbs (i.e. handles) are set on the
* slider (i.e. when [primaryHandleEnabled](https://developers.arcgis.com/javascript/latest/references/map-components/components/arcgis-slider-color-size-legacy/#primaryHandleEnabled) is `true`). This property
* indicates whether the position of the outside handles are synced with the middle, or primary,
* handle. When enabled, if the primary handle is moved then the outside handle positions are updated
* while maintaining a fixed distance from the primary handle.
*
* @default true
* @see [primaryHandleEnabled](https://developers.arcgis.com/javascript/latest/references/core/widgets/smartMapping/ColorSizeSlider/#primaryHandleEnabled)
* @example
* ```js
* // enables the primary handles and syncs it with the others
* colorSizeSlider.primaryHandleEnabled = true;
* colorSizeSlider.handlesSyncedToPrimary = true;
* colorSizeSlider.persistSizeRangeEnabled = true;
* ```
*/
accessor handlesSyncedToPrimary: boolean;
/**
* The histogram associated with the data represented on the slider. The bins are typically
* generated using the [histogram](https://developers.arcgis.com/javascript/latest/references/core/smartMapping/statistics/histogram/) statistics function.
*
* @example
* ```js
* const histogramResult = await histogram({
* layer: featureLayer,
* field: "fieldName",
* numBins: 30,
* });
*
* slider.histogramConfig = {
* bins: histogramResult.bins
* };
* ```
* @see [histogram](https://developers.arcgis.com/javascript/latest/references/core/smartMapping/statistics/histogram/)
*/
accessor histogramConfig: HistogramConfig | null | undefined;
/**
* Icon which represents the component.
* Typically used when the component is controlled by another component (e.g. by the Expand component).
*
* @see [Calcite Icons](https://developers.arcgis.com/calcite-design-system/icons/)
*/
accessor icon: IconName;
/**
* A function used to format user inputs. As opposed to [labelFormatFunction](https://developers.arcgis.com/javascript/latest/references/map-components/components/arcgis-slider-color-size-legacy/#labelFormatFunction), which formats
* thumb labels, the `inputFormatFunction` formats thumb values in the input element when the user begins
* to edit them.
*
* The image below demonstrates how slider input values resemble corresponding slider values by default
* and won't match the formatting set in `labelFormatFunction`.
*
* 
*
* If you want to format slider input values so they match thumb labels, you can pass the same function set in `labelFormatFunction` to
* `inputFormatFunction` for consistent formatting.
*
* 
*
* However, if an `inputFormatFunction` is specified, you must also write a corresponding
* [inputParseFunction](https://developers.arcgis.com/javascript/latest/references/map-components/components/arcgis-slider-color-size-legacy/#inputParseFunction) to parse user inputs to understandable slider values. In most cases, if
* you specify an `inputFormatFunction`, you should set the [labelFormatFunction](https://developers.arcgis.com/javascript/latest/references/map-components/components/arcgis-slider-color-size-legacy/#labelFormatFunction) to the same value
* for consistency between labels and inputs.
*
* This property overrides the default input formatter, which formats by calling `toString()` on the input value.
*
*
* @see [inputParseFunction](https://developers.arcgis.com/javascript/latest/references/map-components/components/arcgis-slider-color-size-legacy/#inputParseFunction)
* @example
* ```js
* // Formats the slider input to abbreviated numbers with units
* // e.g. a thumb at position 1500 will render with an input label of 1.5k
* slider.inputFormatFunction = (value: number): string => {
* if (value >= 1000000) {
* return (value / 1000000).toPrecision(3) + "m";
* }
* if (value >= 100000) {
* return (value / 1000).toPrecision(3) + "k";
* }
* if (value >= 1000) {
* return (value / 1000).toPrecision(2) + "k";
* }
* return value.toFixed(0);
* };
* ```
*/
accessor inputFormatFunction: LabelFormatFunction | null | undefined;
/**
* Function used to parse slider inputs formatted by the [inputFormatFunction](https://developers.arcgis.com/javascript/latest/references/map-components/components/arcgis-slider-color-size-legacy/#inputFormatFunction).
* This property must be set if an `inputFormatFunction` is set. Otherwise the slider values will
* likely not update to their expected positions.
*
* Overrides the default input parses, which is a parsed floating point number.
*
* @see [inputFormatFunction](https://developers.arcgis.com/javascript/latest/references/map-components/components/arcgis-slider-color-size-legacy/#inputFormatFunction)
* @example
* ```js
* // Parses the slider input (a string value) to a number value understandable to the slider
* // This assumes the slider was already configured with an inputFormatFunction
* // For example, if the input is 1.5k this function will parse
* // it to a value of 1500
* colorSlider.inputParseFunction = (value: string): number => {
* const charLength = value.length;
* const valuePrefix = parseFloat(value.substring(0, charLength - 1));
* const finalChar = value.substring(charLength - 1);
*
* if (parseFloat(finalChar) >= 0) {
* return parseFloat(value);
* }
* if (finalChar === "k") {
* return valuePrefix * 1000;
* }
* if (finalChar === "m") {
* return valuePrefix * 1000000;
* }
* return parseFloat(value);
* };
* ```
*/
accessor inputParseFunction: InputParseFunction | null | undefined;
/**
* A function used to format labels on the thumbs, min, max, and average values. Overrides the default label formatter. This function also supports date formatting.
*
* @example
* ```js
* // For thumb values, rounds each label to whole numbers
* slider.labelFormatFunction = (value: number, type?: SliderFormatType): string => {
* return (type === "value") ? value.toFixed(0) : value.toString();
* };
* ```
*/
accessor labelFormatFunction: LabelFormatFunction | null | undefined;
/**
* The maximum value or upper bound of the slider. Once the slider has rendered with the [updateFromRendererResult()](https://developers.arcgis.com/javascript/latest/references/map-components/components/arcgis-slider-color-size-legacy/#updateFromRendererResult) method,
* the user may change this property by selecting the label containing the max value on the slider UI. It is the responsibility of the app developer
* to set up event listeners that update the color and size variables of the appropriate renderer.
*
* @example
* ```js
* colorSizeSlider.max = 150;
* ```
*/
accessor max: number;
/**
* The minimum value or lower bound of the slider. Once the slider has rendered with the [updateFromRendererResult()](https://developers.arcgis.com/javascript/latest/references/map-components/components/arcgis-slider-color-size-legacy/#updateFromRendererResult) method,
* the user may change this property by selecting the label containing the min value on the slider UI. It is the responsibility of the app developer
* to set up event listeners that update the color and size variables of the appropriate renderer.
*
* @example
* ```js
* colorSizeSlider.min = -150;
*/
accessor min: number;
/**
* Only applicable when three thumbs (i.e. handles) are set on the
* slider (i.e. when [primaryHandleEnabled](https://developers.arcgis.com/javascript/latest/references/map-components/components/arcgis-slider-color-size-legacy/#primaryHandleEnabled) is `true`).
* This property is typically used in diverging, or `above-and-below` renderer configurations.
*
* When `true`, ensures symbol sizes in the `above` range
* are consistent with symbol sizes in the `below` range for all slider thumb positions.
* In other words, the size values in the [stops](https://developers.arcgis.com/javascript/latest/references/map-components/components/arcgis-slider-color-size-legacy/#stops) will adjust
* proportionally according to the positions of the data values within the
* constraints of the size range (maxSize - minSize) as the slider thumbs update.
* When `false`, size values in the stops will remain the same even when slider thumb values
* change.
*
* In most cases, this should be set to `true` to keep sizes in the `above` range consistent with
* sizes in the `below` range to avoid map misinterpretation.
*
* @default false
* @see [primaryHandleEnabled](https://developers.arcgis.com/javascript/latest/references/core/widgets/smartMapping/ColorSizeSlider/#primaryHandleEnabled)
* @example
* ```js
* colorSizeSlider.primaryHandleEnabled = true;
* colorSizeSlider.persistSizeRangeEnabled = true;
* ```
*/
accessor persistSizeRangeEnabled: boolean;
/**
* Defines how slider thumb values should be rounded. This number indicates the number
* of decimal places slider thumb _values_ should round to when they have been moved.
*
* Keep in mind this property rounds thumb values and shouldn't be used exclusively for formatting purposes.
*
* @default 4
* @example
* ```js
* // Rounds slider thumb values to 7 decimal places
* slider.precision = 7;
* ```
*/
accessor precision: number;
/**
* When `true`, the slider will render a third handle between the
* two handles already provided by default. This is the primary handle.
* Three or five [stops](https://developers.arcgis.com/javascript/latest/references/map-components/components/arcgis-slider-color-size-legacy/#stops) must be defined for the primary handle to render.
* The primary handle represents the middle stop.
*
* When [handlesSyncedToPrimary](https://developers.arcgis.com/javascript/latest/references/map-components/components/arcgis-slider-color-size-legacy/#handlesSyncedToPrimary) is `true`, then
* this handle will control the position of the others when moved.
*
* This is typically used in diverging, or `above-and-below` renderer configurations.
*
* @default false
* @see [handlesSyncedToPrimary](https://developers.arcgis.com/javascript/latest/references/core/widgets/smartMapping/ColorSizeSlider/#handlesSyncedToPrimary)
* @see [persistSizeRangeEnabled](https://developers.arcgis.com/javascript/latest/references/core/widgets/smartMapping/ColorSizeSlider/#persistSizeRangeEnabled)
* @example
* ```js
* // enables the primary handles and syncs it with the others
* colorSizeSlider.primaryHandleEnabled = true;
* colorSizeSlider.handlesSyncedToPrimary = true;
* colorSizeSlider.persistSizeRangeEnabled = true;
* ```
*/
accessor primaryHandleEnabled: boolean;
/**
* By assigning the `id` attribute of the Map or Scene component to this property, you can position a child component anywhere in the DOM while still maintaining a connection to the Map or Scene.
*
* @see [Associate components with a Map or Scene component](https://developers.arcgis.com/javascript/latest/programming-patterns/#associate-components-with-a-map-or-scene-component)
*/
accessor referenceElement: ArcgisReferenceElement | string | undefined;
/** The current state of the component. */
get state(): SmartMappingSliderBaseState;
/**
* The colors and sizes corresponding with data values in the [ColorVariable](https://developers.arcgis.com/javascript/latest/references/core/renderers/visualVariables/ColorVariable/)
* and [SizeVariable](https://developers.arcgis.com/javascript/latest/references/core/renderers/visualVariables/SizeVariable/) of the renderer associated with the slider.
*
* Use the [updateFromRendererResult()](https://developers.arcgis.com/javascript/latest/references/map-components/components/arcgis-slider-color-size-legacy/#updateFromRendererResult) method to conveniently construct these stops from a renderer generated from the [createContinuousRenderer()](https://developers.arcgis.com/javascript/latest/references/core/smartMapping/renderers/univariateColorSize/#createContinuousRenderer) smart mapping module.
*
* Use [updateVisualVariables()](https://developers.arcgis.com/javascript/latest/references/map-components/components/arcgis-slider-color-size-legacy/#updateVisualVariables) to update the renderer's visual variables with the values matching the slider thumb positions.
*
* @see [updateFromRendererResult()](https://developers.arcgis.com/javascript/latest/references/map-components/components/arcgis-slider-color-size-legacy/#updateFromRendererResult)
* @see [updateVisualVariables()](https://developers.arcgis.com/javascript/latest/references/map-components/components/arcgis-slider-color-size-legacy/#updateVisualVariables)
* @example
* ```js
* colorSizeSlider.stops = [
* { size: 2, value: colorSizeSlider.min, color: new Color([240, 240, 240, 1]) },
* { size: 24, value: colorSizeSlider.max, color: new Color([0, 0, 255, 1]) },
* ]
* ```
*/
accessor stops: Array<ColorSizeStop>;
/**
* Zooms the slider track to the bounds provided in this property. When min and/or max zoom values are provided, the absolute [min](https://developers.arcgis.com/javascript/latest/references/map-components/components/arcgis-slider-color-size-legacy/#min) and
* [max](https://developers.arcgis.com/javascript/latest/references/map-components/components/arcgis-slider-color-size-legacy/#max) slider values are preserved and rendered at their typical positions on the slider. However, the
* slider track itself is zoomed so that thumbs cannot be moved above or below the provided min and max zoomed values.
*
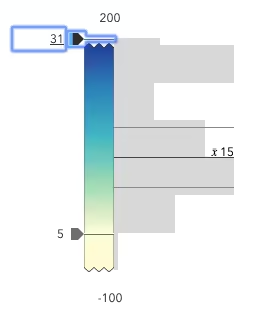
* When a slider is in a zoomed state, the zoomed ends of the track will appear jagged. In the image below, notice how the
* top thumb cannot be moved past the zoom max of `31` even though the slider max is `200`.
*
* 
*
* To exit a zoomed state, the user can click the jagged line or the developer can set the `zoomOptions` to `null`. It
* is up to the developer to provide a UI option for end users to enable zooming on the slider.
*
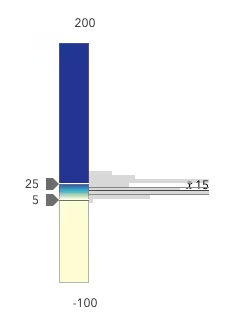
* Setting the `zoomOptions` is useful when the slider is tied to heavily skewed datasets where the histogram renders only one or two bars because of outliers.
*
* 
*
* You can remove the influence of outliers by zooming the slider and regenerating a histogram based on the zoomed min and max. This will provide a better view of the data
* and make the slider more useful to the end user.
*
* @example
* ```js
* // zooms the slider so thumbs can only be moved to positions between
* // values of 10 and 25 while maintaining the slider's absolute min and max values
* slider.zoomOptions = {
* min: 10,
* max: 25
* };
* ```
* @example
* ```js
* // disables zooming on the slider
* slider.zoomOptions = null;
* ```
* @example
* ```js
* // zooms the slider so thumbs can only be moved to positions above
* // value of 10 while maintaining the slider's absolute min value
* slider.zoomOptions = {
* min: 10
* };
* ```
* @example
* ```js
* // zooms the slider so thumbs can only be moved to positions below
* // value of 25 while maintaining the slider's absolute max value
* slider.zoomOptions = {
* max: 25
* };
* ```
*/
accessor zoomOptions: ZoomOptions | null | undefined;
/** Permanently destroy the component. */
destroy(): Promise<void>;
/**
* A convenience function used to update the properties of a Slider Color Size component instance from the
* [result](https://developers.arcgis.com/javascript/latest/references/core/smartMapping/renderers/univariateColorSize/#RendererResult) of
* the [createContinuousRenderer()](https://developers.arcgis.com/javascript/latest/references/core/smartMapping/renderers/univariateColorSize/#createContinuousRenderer)
* method. Note that this method always expects `rendererResult` to be defined for the slider to function, but `histogramResult` is optional.
*
* @param rendererResult - The result object from the [createContinuousRenderer()](https://developers.arcgis.com/javascript/latest/references/core/smartMapping/renderers/univariateColorSize/#createContinuousRenderer)
* method.
* @param histogramResult - The result histogram object from the [histogram()](https://developers.arcgis.com/javascript/latest/references/core/smartMapping/statistics/histogram/#histogram)
* method.
* @example
* ```js
* const rendererResult = await colorAndSizeRendererCreator.createContinuousRenderer(params);
*
* featureLayer.renderer = rendererResult.renderer;
*
* const histogramResult = await histogram({
* ...params,
* numBins: 30,
* });
*
* await colorSizeSlider?.updateFromRendererResult(rendererResult, histogramResult);
* ```
*/
updateFromRendererResult(rendererResult: RendererResult, histogramResult?: HistogramResult): Promise<void>;
/**
* A convenience function used to update the visual variables of a renderer generated with the
* [createContinuousRenderer()](https://developers.arcgis.com/javascript/latest/references/core/smartMapping/renderers/univariateColorSize/#createContinuousRenderer)
* method with the values obtained from the slider. This method is useful for cases when the app allows the end user to switch data variables
* used to render the data.
*
* @param variables - The visual variables to update from the renderer associated with the slider. The properties of the
* color and size variables will update based on the slider thumb values.
* @returns Returns the input visual variables updated to match the current slider values. These should be set directly
* back to the renderer where they came from.
* @example
* ```js
* const renderer = featureLayer?.renderer?.clone();
* renderer.visualVariables = colorSizeSlider.updateVisualVariables(renderer.visualVariables as VisualVariable[]);
* featureLayer.renderer = renderer;
* ```
*/
updateVisualVariables(variables: VisualVariable[]): VisualVariable[];
/** Emitted when the value of a property is changed. Use this to listen to changes to properties. */
readonly arcgisPropertyChange: import("@arcgis/lumina").TargetedEvent<this, { name: "histogramConfig" | "max" | "min" | "precision" | "state" | "stops" | "zoomOptions"; }>;
/** Emitted when the component associated with a map or scene view is ready to be interacted with. */
readonly arcgisReady: import("@arcgis/lumina").TargetedEvent<this, void>;
/** Fires when a user changes the value of a thumb via the arrow keys or by keyboard editing of the label on the slider. */
readonly arcgisThumbChange: import("@arcgis/lumina").TargetedEvent<this, ThumbChangeEvent>;
/** Fires when a user drags a thumb on the component. */
readonly arcgisThumbDrag: import("@arcgis/lumina").TargetedEvent<this, ThumbDragEvent>;
readonly "@eventTypes": {
arcgisPropertyChange: ArcgisSliderColorSizeLegacy["arcgisPropertyChange"]["detail"];
arcgisReady: ArcgisSliderColorSizeLegacy["arcgisReady"]["detail"];
arcgisThumbChange: ArcgisSliderColorSizeLegacy["arcgisThumbChange"]["detail"];
arcgisThumbDrag: ArcgisSliderColorSizeLegacy["arcgisThumbDrag"]["detail"];
};
}