@arcgis/map-components
Version:
ArcGIS Map Components
418 lines (417 loc) • 22.6 kB
TypeScript
/// <reference path="../../index.d.ts" />
import type ClassBreaksRenderer from "@arcgis/core/renderers/ClassBreaksRenderer.js";
import type SizeStop from "@arcgis/core/renderers/visualVariables/support/SizeStop.js";
import type { PublicLitElement as LitElement } from "@arcgis/lumina";
import type { RendererResult } from "@arcgis/core/smartMapping/renderers/univariateColorSize.js";
import type { HistogramResult } from "@arcgis/core/smartMapping/statistics/types.js";
import type { ArcgisReferenceElement, IconName } from "../types.js";
import type { ThumbDragEvent, ThumbChangeEvent } from "@arcgis/core/widgets/Slider/types.js";
import type { HistogramConfig, ZoomOptions } from "@arcgis/core/widgets/smartMapping/types.js";
import type { LabelFormatFunction, InputParseFunction } from "@arcgis/core/widgets/types.js";
import type { BinaryColorSizeSliderStyle } from "@arcgis/core/widgets/smartMapping/BinaryColorSizeSlider.js";
import type { SmartMappingSliderBaseState } from "@arcgis/core/widgets/smartMapping/SmartMappingSliderBase.js";
/**
* > [!WARNING]
* >
* > This is a **legacy component**. It relies on an underlying widget as part of our migration to native web components.
* >
* > A fully native replacement for this component is in development. Once it reaches feature parity, the legacy component will be deprecated and no longer maintained.
* At that point, development should use the native component.
*
* The Binary Color Size Slider component is intended for authoring and exploring diverging data-driven visualizations in any
* layer that can be rendered with an above and below theme for a [SizeVariable](https://developers.arcgis.com/javascript/latest/references/core/renderers/visualVariables/SizeVariable/).
*
* The [updateFromRendererResult()](https://developers.arcgis.com/javascript/latest/references/core/widgets/smartMapping/BinaryColorSizeSlider/#fromRendererResult)
* method can be used to intelligently populate slider properties including [max](https://developers.arcgis.com/javascript/latest/references/map-components/components/arcgis-slider-binary-color-size-legacy/#max), [min](https://developers.arcgis.com/javascript/latest/references/map-components/components/arcgis-slider-binary-color-size-legacy/#min), [size visual variable](https://developers.arcgis.com/javascript/latest/references/core/renderers/visualVariables/SizeVariable/)
* configuration, and the slider's histogram after the renderer has been created from the result of the
* [createContinuousRenderer()](https://developers.arcgis.com/javascript/latest/references/core/smartMapping/renderers/univariateColorSize/#createContinuousRenderer) method.
*
* ```js
* const univariateColorSizeRendererCreator = await import(
* "@arcgis/core/smartMapping/renderers/univariateColorSize.js"
* );
* const viewElement = document.querySelector("arcgis-map")!;
* const binaryColorSizeSlider = document.querySelector("arcgis-slider-binary-color-size-legacy");
*
* const featureLayer = new FeatureLayer({
* url: "https://services.arcgis.com/P3ePLMYs2RVChkJx/arcgis/rest/services/ACS_Poverty_by_Age_Boundaries/FeatureServer/1",
* });
*
* await viewElement.viewOnReady();
* viewElement.map?.add(featureLayer);
*
* const params = {
* layer: featureLayer,
* field: "B17020_calc_pctPovE",
* view: viewElement.view,
* theme: "above-and-below",
* };
*
* const rendererResult = await univariateColorSizeRendererCreator.createContinuousRenderer(params);
*
* featureLayer.renderer = rendererResult.renderer;
*
* const histogramResult = await histogram({
* ...params,
* numBins: 30,
* });
*
* await binaryColorSizeSlider?.updateFromRendererResult(rendererResult, histogramResult);
* ```
*
* This slider should be used to update an above and below (diverging) visualization in a layer's renderer.
* It is the responsibility of the app developer to set up event listeners on that update the size variable of the appropriate renderer.
*
* ```js
* const updateRendererFromSlider = async () => {
* const result = await binaryColorSizeSlider.updateRenderer(featureLayer.renderer);
* featureLayer.renderer = result;
* };
*
* binaryColorSizeSlider.addEventListener("arcgisThumbChange", updateRendererFromSlider);
* binaryColorSizeSlider.addEventListener("arcgisThumbDrag", updateRendererFromSlider);
* binaryColorSizeSlider.addEventListener("arcgisPropertyChange", updateRendererFromSlider);
* ```
*
* @since 5.0
* @see [univariateColorSizeRendererCreator](https://developers.arcgis.com/javascript/latest/references/core/smartMapping/renderers/univariateColorSize/)
*/
export abstract class ArcgisSliderBinaryColorSizeLegacy extends LitElement {
/**
* If true, the component will not be destroyed automatically when it is
* disconnected from the document. This is useful when you want to move the
* component to a different place on the page, or temporarily hide it. If this
* is set, make sure to call the [destroy()](https://developers.arcgis.com/javascript/latest/references/map-components/components/arcgis-slider-binary-color-size-legacy/#destroy) method when you are done to
* prevent memory leaks.
*
* @default false
*/
accessor autoDestroyDisabled: boolean;
/**
* This property indicates whether the position of the outside handles are synced with the middle, or primary,
* handle. When enabled, if the primary handle is moved then the outside handle positions are updated
* while maintaining a fixed distance from the primary handle.
*
* @default true
* @example
* ```js
* // enables the primary handles and syncs it with the others
* binaryColorSizeSlider.handlesSyncedToPrimary = true;
* ```
*/
accessor handlesSyncedToPrimary: boolean;
/**
* The histogram associated with the data represented on the slider. The bins are typically
* generated using the [histogram](https://developers.arcgis.com/javascript/latest/references/core/smartMapping/statistics/histogram/) statistics function.
*
* @example
* ```js
* const histogramResult = await histogram({
* layer: featureLayer,
* field: "fieldName",
* numBins: 30,
* });
*
* slider.histogramConfig = {
* bins: histogramResult.bins
* };
* ```
* @see [histogram](https://developers.arcgis.com/javascript/latest/references/core/smartMapping/statistics/histogram/)
*/
accessor histogramConfig: HistogramConfig | null | undefined;
/**
* Icon which represents the component.
* Typically used when the component is controlled by another component (e.g. by the Expand component).
*
* @see [Calcite Icons](https://developers.arcgis.com/calcite-design-system/icons/)
*/
accessor icon: IconName;
/**
* A function used to format user inputs. As opposed to [labelFormatFunction](https://developers.arcgis.com/javascript/latest/references/map-components/components/arcgis-slider-binary-color-size-legacy/#labelFormatFunction), which formats
* thumb labels, the `inputFormatFunction` formats thumb values in the input element when the user begins
* to edit them.
*
* The image below demonstrates how slider input values resemble corresponding slider values by default
* and won't match the formatting set in `labelFormatFunction`.
*
* 
*
* If you want to format slider input values so they match thumb labels, you can pass the same function set in `labelFormatFunction` to
* `inputFormatFunction` for consistent formatting.
*
* 
*
* However, if an `inputFormatFunction` is specified, you must also write a corresponding
* [inputParseFunction](https://developers.arcgis.com/javascript/latest/references/map-components/components/arcgis-slider-binary-color-size-legacy/#inputParseFunction) to parse user inputs to understandable slider values. In most cases, if
* you specify an `inputFormatFunction`, you should set the [labelFormatFunction](https://developers.arcgis.com/javascript/latest/references/map-components/components/arcgis-slider-binary-color-size-legacy/#labelFormatFunction) to the same value
* for consistency between labels and inputs.
*
* This property overrides the default input formatter, which formats by calling `toString()` on the input value.
*
*
* @see [inputParseFunction](https://developers.arcgis.com/javascript/latest/references/map-components/components/arcgis-slider-binary-color-size-legacy/#inputParseFunction)
* @example
* ```js
* // Formats the slider input to abbreviated numbers with units
* // e.g. a thumb at position 1500 will render with an input label of 1.5k
* slider.inputFormatFunction = (value: number): string => {
* if (value >= 1000000) {
* return (value / 1000000).toPrecision(3) + "m";
* }
* if (value >= 100000) {
* return (value / 1000).toPrecision(3) + "k";
* }
* if (value >= 1000) {
* return (value / 1000).toPrecision(2) + "k";
* }
* return value.toFixed(0);
* };
* ```
*/
accessor inputFormatFunction: LabelFormatFunction | null | undefined;
/**
* Function used to parse slider inputs formatted by the [inputFormatFunction](https://developers.arcgis.com/javascript/latest/references/map-components/components/arcgis-slider-binary-color-size-legacy/#inputFormatFunction).
* This property must be set if an `inputFormatFunction` is set. Otherwise the slider values will
* likely not update to their expected positions.
*
* Overrides the default input parses, which is a parsed floating point number.
*
* @see [inputFormatFunction](https://developers.arcgis.com/javascript/latest/references/map-components/components/arcgis-slider-binary-color-size-legacy/#inputFormatFunction)
* @example
* ```js
* // Parses the slider input (a string value) to a number value understandable to the slider
* // This assumes the slider was already configured with an inputFormatFunction
* // For example, if the input is 1.5k this function will parse
* // it to a value of 1500
* colorSlider.inputParseFunction = (value: string): number => {
* const charLength = value.length;
* const valuePrefix = parseFloat(value.substring(0, charLength - 1));
* const finalChar = value.substring(charLength - 1);
*
* if (parseFloat(finalChar) >= 0) {
* return parseFloat(value);
* }
* if (finalChar === "k") {
* return valuePrefix * 1000;
* }
* if (finalChar === "m") {
* return valuePrefix * 1000000;
* }
* return parseFloat(value);
* };
* ```
*/
accessor inputParseFunction: InputParseFunction | null | undefined;
/**
* A function used to format labels on the thumbs, min, max, and average values. Overrides the default label formatter. This function also supports date formatting.
*
* @example
* ```js
* // For thumb values, rounds each label to whole numbers
* slider.labelFormatFunction = (value: number, type?: SliderFormatType): string => {
* return (type === "value") ? value.toFixed(0) : value.toString();
* };
* ```
*/
accessor labelFormatFunction: LabelFormatFunction | null | undefined;
/**
* The maximum value or upper bound of the slider. Once the slider has rendered with the [updateFromRendererResult()](https://developers.arcgis.com/javascript/latest/references/map-components/components/arcgis-slider-binary-color-size-legacy/#updateFromRendererResult) method,
* the user may change this property by selecting the label containing the max value on the slider UI. It is the responsibility of the app developer
* to set up event listeners that update the size variable of the appropriate renderer.
*
* @example
* ```js
* binaryColorSizeSlider.max = 150;
* ```
*/
accessor max: number;
/**
* The minimum value or lower bound of the slider. Once the slider has rendered with the [updateFromRendererResult()](https://developers.arcgis.com/javascript/latest/references/map-components/components/arcgis-slider-binary-color-size-legacy/#updateFromRendererResult) method,
* the user may change this property by selecting the label containing the min value on the slider UI. It is the responsibility of the app developer
* to set up event listeners that update the size variable of the appropriate renderer.
*
* @example
* ```js
* binaryColorSizeSlider.min = -150;
* ```
*/
accessor min: number;
/**
* When `true`, ensures symbol sizes in the `above` range
* are consistent with symbol sizes in the `below` range for all slider thumb positions.
* In other words, the size values in the [stops](https://developers.arcgis.com/javascript/latest/references/map-components/components/arcgis-slider-binary-color-size-legacy/#stops) will adjust
* proportionally according to the positions of the data values within the
* constraints of the size range (maxSize - minSize) as the slider thumbs update.
* When `false`, size values in the stops will remain the same even when slider thumb values
* change.
*
* In most cases, this should be set to `true` to keep sizes in the `above` range consistent with
* sizes in the `below` range to avoid map misinterpretation.
*
* @default false
* @example
* ```js
* binaryColorSizeSlider.persistSizeRangeEnabled = true;
* ```
*/
accessor persistSizeRangeEnabled: boolean;
/**
* Defines how slider thumb values should be rounded. This number indicates the number
* of decimal places slider thumb _values_ should round to when they have been moved.
*
* Keep in mind this property rounds thumb values and shouldn't be used exclusively for formatting purposes.
*
* @default 4
* @example
* ```js
* // Rounds slider thumb values to 7 decimal places
* slider.precision = 7;
* ```
*/
accessor precision: number;
/**
* By assigning the `id` attribute of the Map or Scene component to this property, you can position a child component anywhere in the DOM while still maintaining a connection to the Map or Scene.
*
* @see [Associate components with a Map or Scene component](https://developers.arcgis.com/javascript/latest/programming-patterns/#associate-components-with-a-map-or-scene-component)
*/
accessor referenceElement: ArcgisReferenceElement | string | undefined;
/**
* Exposes various properties of the widget that can be styled. The result object from the [createContinuousRenderer()](https://developers.arcgis.com/javascript/latest/references/core/smartMapping/renderers/univariateColorSize/#createContinuousRenderer)
* method can be used to match the `trackBelowFillColor` and `trackAboveFillColor` to the current layer symbology.
*
* @example
* ```js
* binaryColorSizeSlider.sliderStyle = {
* trackAboveFillColor: rendererResult.renderer.classBreakInfos[1].symbol.color ?? new Color([149, 149, 149]),
* trackBackgroundColor: new Color([224, 224, 224]),
* trackBelowFillColor: rendererResult.renderer.classBreakInfos[0].symbol.color ?? new Color([149, 149, 149]),
* };
* ```
*/
accessor sliderStyle: BinaryColorSizeSliderStyle;
/** The current state of the component. */
get state(): SmartMappingSliderBaseState;
/**
* The size stops from the [SizeVariable](https://developers.arcgis.com/javascript/latest/references/core/renderers/visualVariables/SizeVariable/)
* to link to the slider. You must provide either three or five stops. The minimum size
* should be represented in the size property of the middle stop. The maximum size should be represented in either first or last stops.
*
* @example
* ```js
* binaryColorSizeSlider.stops = [
* { value: 8, size: 7 },
* { value: 15, size: 3 },
* { value: 40, size: 17 },
* { value: 64, size: 30 }
* ];
* ```
*/
accessor stops: Array<SizeStop>;
/**
* Zooms the slider track to the bounds provided in this property. When min and/or max zoom values are provided, the absolute [min](https://developers.arcgis.com/javascript/latest/references/map-components/components/arcgis-slider-binary-color-size-legacy/#min) and
* [max](https://developers.arcgis.com/javascript/latest/references/map-components/components/arcgis-slider-binary-color-size-legacy/#max) slider values are preserved and rendered at their typical positions on the slider. However, the
* slider track itself is zoomed so that thumbs cannot be moved above or below the provided min and max zoomed values.
*
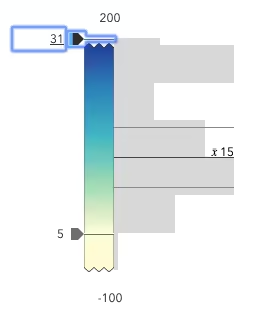
* When a slider is in a zoomed state, the zoomed ends of the track will appear jagged. In the image below, notice how the
* top thumb cannot be moved past the zoom max of `31` even though the slider max is `200`.
*
* 
*
* To exit a zoomed state, the user can click the jagged line or the developer can set the `zoomOptions` to `null`. It
* is up to the developer to provide a UI option for end users to enable zooming on the slider.
*
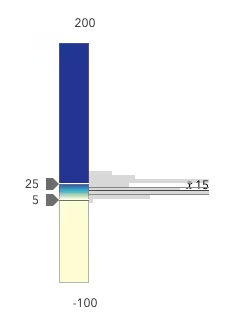
* Setting the `zoomOptions` is useful when the slider is tied to heavily skewed datasets where the histogram renders only one or two bars because of outliers.
*
* 
*
* You can remove the influence of outliers by zooming the slider and regenerating a histogram based on the zoomed min and max. This will provide a better view of the data
* and make the slider more useful to the end user.
*
* @example
* ```js
* // zooms the slider so thumbs can only be moved to positions between
* // values of 10 and 25 while maintaining the slider's absolute min and max values
* slider.zoomOptions = {
* min: 10,
* max: 25
* };
* ```
* @example
* ```js
* // disables zooming on the slider
* slider.zoomOptions = null;
* ```
* @example
* ```js
* // zooms the slider so thumbs can only be moved to positions above
* // value of 10 while maintaining the slider's absolute min value
* slider.zoomOptions = {
* min: 10
* };
* ```
* @example
* ```js
* // zooms the slider so thumbs can only be moved to positions below
* // value of 25 while maintaining the slider's absolute max value
* slider.zoomOptions = {
* max: 25
* };
* ```
*/
accessor zoomOptions: ZoomOptions | null | undefined;
/** Permanently destroy the component. */
destroy(): Promise<void>;
/**
* A convenience function used to update the properties of a Binary Color Size Slider component instance from the
* [result](https://developers.arcgis.com/javascript/latest/references/core/smartMapping/renderers/univariateColorSize/#RendererResult) of
* the [createContinuousRenderer()](https://developers.arcgis.com/javascript/latest/references/core/smartMapping/renderers/univariateColorSize/#createContinuousRenderer)
* method. This method is useful for cases when the app allows the end user to switch data variables used to render the data.
* Note that this method always expects `rendererResult` to be defined for the slider to function, but `histogramResult` is optional.
*
* @param rendererResult - The result object from the [createContinuousRenderer()](https://developers.arcgis.com/javascript/latest/references/core/smartMapping/renderers/univariateColorSize/#createContinuousRenderer)
* method.
* @param histogramResult - The result histogram object from the [histogram()](https://developers.arcgis.com/javascript/latest/references/core/smartMapping/statistics/histogram/#histogram)
* method.
* @example
* ```js
* const rendererResult = await univariateColorSizeRendererCreator.createContinuousRenderer(params);
*
* featureLayer.renderer = rendererResult.renderer;
*
* const histogramResult = await histogram({
* ...params,
* numBins: 30,
* });
*
* await binaryColorSizeSlider?.updateFromRendererResult(rendererResult, histogramResult)
* ```
*/
updateFromRendererResult(rendererResult: RendererResult, histogramResult?: HistogramResult): Promise<void>;
/**
* A convenience function used to update the input renderer based on
* the values of the slider [stops](https://developers.arcgis.com/javascript/latest/references/core/widgets/smartMapping/BinaryColorSizeSlider/#stops).
*
* @param renderer - The renderer to update from the slider values.
* @returns Returns the updated renderer.
* @example
* ```js
* const updatedRenderer = await binaryColorSizeSlider.updateRenderer(featureLayer.renderer as ClassBreaksRenderer);
* featureLayer.renderer = updatedRenderer;
* ```
*/
updateRenderer(renderer: ClassBreaksRenderer): Promise<ClassBreaksRenderer | null | undefined>;
/** Emitted when the value of a property is changed. Use this to listen to changes to properties. */
readonly arcgisPropertyChange: import("@arcgis/lumina").TargetedEvent<this, { name: "histogramConfig" | "max" | "min" | "precision" | "sliderStyle" | "state" | "zoomOptions"; }>;
/** Emitted when the component associated with a map or scene view is ready to be interacted with. */
readonly arcgisReady: import("@arcgis/lumina").TargetedEvent<this, void>;
/** Fires when a user changes the value of a thumb via the arrow keys or by keyboard editing of the label on the slider. */
readonly arcgisThumbChange: import("@arcgis/lumina").TargetedEvent<this, ThumbChangeEvent>;
/** Fires when a user drags a thumb on the component. */
readonly arcgisThumbDrag: import("@arcgis/lumina").TargetedEvent<this, ThumbDragEvent>;
readonly "@eventTypes": {
arcgisPropertyChange: ArcgisSliderBinaryColorSizeLegacy["arcgisPropertyChange"]["detail"];
arcgisReady: ArcgisSliderBinaryColorSizeLegacy["arcgisReady"]["detail"];
arcgisThumbChange: ArcgisSliderBinaryColorSizeLegacy["arcgisThumbChange"]["detail"];
arcgisThumbDrag: ArcgisSliderBinaryColorSizeLegacy["arcgisThumbDrag"]["detail"];
};
}