@arcgis/core
Version:
ArcGIS Maps SDK for JavaScript: A complete 2D and 3D mapping and data visualization API
1,032 lines (1,026 loc) • 47.5 kB
TypeScript
import type WebScene from "../WebScene.js";
import type WebMap from "../WebMap.js";
import type Collection from "../core/Collection.js";
import type TimeExtent from "../time/TimeExtent.js";
import type Widget from "./Widget.js";
import type TimeSliderViewModel from "./TimeSlider/TimeSliderViewModel.js";
import type { Icon } from "@esri/calcite-components/components/calcite-icon";
import type { TimeZone } from "../time/types.js";
import type { MapViewOrSceneView } from "../views/MapViewOrSceneView.js";
import type { TickConfig } from "./Slider/types.js";
import type { TimeSliderViewModelEvents, TimeSliderViewModelProperties } from "./TimeSlider/TimeSliderViewModel.js";
import type { Action, Stops, TimeSliderMode } from "./TimeSlider/types.js";
import type { ReadonlyArrayOrCollection } from "../core/Collection.js";
import type { TimeExtentProperties } from "../time/TimeExtent.js";
import type { WidgetProperties } from "./Widget.js";
export interface TimeSliderProperties extends WidgetProperties, Partial<Pick<TimeSlider, "disabled" | "labelFormatFunction" | "layout" | "loop" | "mode" | "playRate" | "stops" | "tickConfigs" | "timeVisible" | "view">> {
/**
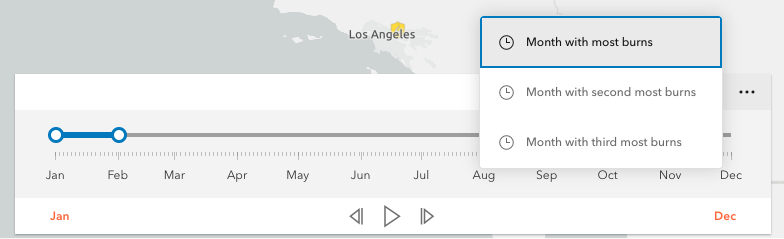
* Defines actions that will appear in a menu when the user clicks the ellipsis button
*  in the widget. The
* ellipsis button will not display if this property is `null` or if the collection is empty.
* Each [Action](https://developers.arcgis.com/javascript/latest/references/core/widgets/TimeSlider/types/#Action) is defined with a unique id, a title,
* and an icon.
*
* The [@trigger-action](https://developers.arcgis.com/javascript/latest/references/core/widgets/TimeSlider/#event-trigger-action) event fires each time an action in the menu is clicked. This event
* can be used to execute custom code such as setting the [timeExtent](https://developers.arcgis.com/javascript/latest/references/core/widgets/TimeSlider/#timeExtent) to a specific date or copying the
* timeExtent to the browser's clipboard.
*
* [](https://developers.arcgis.com/javascript/latest/sample-code/widgets-timeslider-offset/)
*
* @since 4.21
* @see [Sample - TimeSlider with offset](https://developers.arcgis.com/javascript/latest/sample-code/widgets-timeslider-offset/)
* @example
* // Create a TimeSlider with two actions to snap the thumb to
* // two specific time extents.
* const timeSlider = new TimeSlider({
* container: "timeSliderDiv",
* fullTimeExtent: {
* start: new Date(2011, 0, 1),
* end: new Date(2012, 0, 1)
* },
* mode: "instant",
* actions: [
* {
* id: "quake",
* icon: "exclamation-mark-triangle",
* title: "Jump to Earthquake"
* },
* {
* id: "quake-plus-one-month",
* icon: "organization",
* title: "One month later"
* }
* ]
* });
*
* // listen to timeSlider's trigger-action event
* // check what action user clicked on and respond accordingly.
* timeSlider.on("trigger-action", (event) => {
* const quake = new Date(Date.UTC(2011, 3, 11, 8, 16, 12));
* const oneMonthLater = new Date(quake.getTime()).setMonth(quake.getMonth() + 1);
* switch(event.action.id) {
* case "quake":
* timeSlider.timeExtent = {
* start: quake,
* end: quake
* };
* break;
* case "quake-plus-one-month":
* timeSlider.timeExtent = {
* start: oneMonthLater,
* end: oneMonthLater
* };
* break;
* }
* });
*/
actions?: ReadonlyArrayOrCollection<Action>;
/**
* The temporal extent of the entire slider.
* It defines the entire time period within which you can visualize
* your time aware data using the time slider widget.
*
* @example
* // Create a new TimeSlider with set dates
* const timeSlider = new TimeSlider({
* container: "timeSliderDiv",
* view: view
* });
*
* // wait for the time-aware layer to load
* layer.when(() => {
* // set up time slider properties based on layer timeInfo
* timeSlider.fullTimeExtent = layer.timeInfo.fullTimeExtent;
* timeSlider.stops = {
* interval: layer.timeInfo.interval
* };
* });
*/
fullTimeExtent?: TimeExtentProperties | null;
/**
* Icon which represents the widget. It is typically used when the widget is controlled by another
* one (e.g. in the Expand widget).
*
* @default "clock"
* @since 4.27
* @see [Calcite Icon Search](https://developers.arcgis.com/calcite-design-system/icons/)
* @see [Calcite Icon Search](https://developers.arcgis.com/calcite-design-system/icons/)
*/
icon?: Icon["icon"] | null;
/**
* The widget's default label.
*
* @since 4.11
*/
label?: string | null;
/**
* The current time extent of the time slider. This property can be watched for
* updates and used to update the time extent property in queries and/or the layer filters and effects.
* The following table shows the `timeExtent` values returned for each [mode](https://developers.arcgis.com/javascript/latest/references/core/widgets/TimeSlider/#mode).
*
* | Mode | The timeExtent value |
* | ------- | -------------------- |
* | `time-window` | `{start: startDate, end: endDate}` |
* | `instant` | `{start: sameDate, end: sameDate}` |
* | `cumulative-from-start` | `{start: null, end: endDate}` |
* | `cumulative-from-end` | `{start: startDate, end: null}` |
*
* @example
* // Display the time extent to the console whenever it changes.
* const timeSlider = new TimeSlider({
* container: "timeSliderDiv",
* mode: "time-window",
* fullTimeExtent: {
* start: new Date(2019, 2, 3),
* end: new Date(2019, 2, 5)
* },
* timeExtent: {
* start: new Date(2019, 2, 1),
* end: new Date(2019, 2, 28)
* }
* });
*
* reactiveUtils.watch(
* () => timeSlider.timeExtent,
* (timeExtent) => {
* console.log("Time extent now starts at", timeExtent.start, "and finishes at:", timeExtent.end);
* }
* );
*/
timeExtent?: TimeExtentProperties | null;
/**
* Dates and times displayed in the widget will be displayed in this time zone. By default this time zone is
* inherited from [MapView.timeZone](https://developers.arcgis.com/javascript/latest/references/core/views/MapView/#timeZone). When a MapView is not associated with the widget
* then the property will fallback to the `system` time zone.
*
* **Possible Values**
*
* Value | Description |
* ----- | ----------- |
* system | Dates and times will be displayed in the timezone of the device or browser.
* unknown | Dates and time are not adjusted for any timezone. [TimeSlider](https://developers.arcgis.com/javascript/latest/references/core/widgets/TimeSlider/) will be disabled.
* Specified IANA timezone | Dates and times will be displayed in the specified IANA time zone. See [wikipedia - List of tz database time zones](https://en.wikipedia.org/wiki/List_of_tz_database_time_zones).
*
* @since 4.28
*/
timeZone?: TimeZone | null;
/**
* The view model for this widget. This is a class that contains all the logic
* (properties and methods) that controls this widget's behavior. See the
* [TimeSliderViewModel](https://developers.arcgis.com/javascript/latest/references/core/widgets/TimeSlider/TimeSliderViewModel/) class to access
* all properties and methods on the widget.
*
* @example
* // Below is an example of initializing a TimeSlider widget using properties
* // on the viewModel instead of the widget.
* const timeSlider = new TimeSlider({
* container: "timeSliderDiv",
* viewModel: {
* view: view,
* mode: "instant",
* fullTimeExtent: {
* start: new Date(2000, 0, 1),
* end: new Date(2010, 0, 1)
* },
* timeExtent: {
* start: new Date(2000, 0, 1),
* end: new Date(2000, 0, 1)
* }
* });
*/
viewModel?: TimeSliderViewModelProperties;
}
/**
* The label type that you want to format.
*
* @see [DateLabelFormatter](https://developers.arcgis.com/javascript/latest/references/core/widgets/TimeSlider/#DateLabelFormatter)
*/
export type LabelType = "min" | "max" | "extent";
/**
* The TimeSlider [layout](https://developers.arcgis.com/javascript/latest/references/core/widgets/TimeSlider/#layout)
*
* @see [DateLabelFormatter](https://developers.arcgis.com/javascript/latest/references/core/widgets/TimeSlider/#DateLabelFormatter)
*/
export type TimeSliderLayout = "auto" | "compact" | "wide";
/**
* This function is used by the [labelFormatFunction](https://developers.arcgis.com/javascript/latest/references/core/widgets/TimeSlider/#labelFormatFunction)
* property to specify custom formatting and styling of the min, max and
* extent labels of the time slider widget.
*
* @param value - The date(s) that correspond to labels. When the label
* type is `min` or `max` a single date value will be parsed. When the
* type is `extent` value will be a date array with two values.
* The first and second date in the array correspond the time extent's start and end values.
* @param type - The label type that you want to format.
* @param element - The HTML element corresponding to the label type. You can add or modify the
* default style of individual labels by adding CSS classes to this element.
* You can also add custom behavior to labels by attaching event listeners to individual elements.
* @param layout - The TimeSlider [layout](https://developers.arcgis.com/javascript/latest/references/core/widgets/TimeSlider/#layout).
*/
export type DateLabelFormatter = (value: Date | [
Date,
Date
], type: LabelType, element: HTMLElement, layout: Exclude<TimeSliderLayout, "auto">) => void;
export interface TimeSliderEvents extends TimeSliderViewModelEvents {}
/**
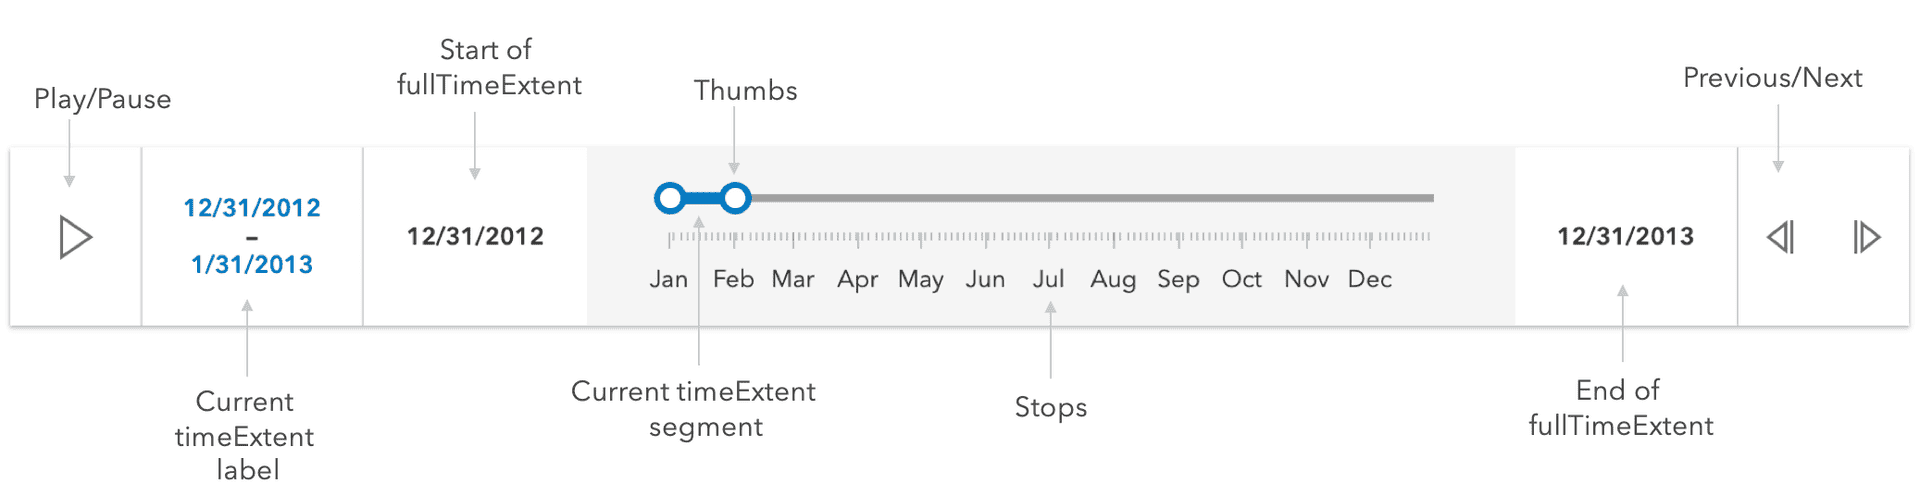
* The TimeSlider widget simplifies visualization of temporal data
* in your application. Before adding the TimeSlider to your application, you
* first should understand how it can be configured to correctly display your temporal data.
*
* The [fullTimeExtent](https://developers.arcgis.com/javascript/latest/references/core/widgets/TimeSlider/#fullTimeExtent) property defines the entire time period within
* which you can visualize your time aware data using the TimeSlider widget.
* You can visualize temporal data up to a point in time, from a point in time,
* at an instant of time, or from data that falls within a time range by setting the [mode](https://developers.arcgis.com/javascript/latest/references/core/widgets/TimeSlider/#mode) property.
* The [stops](https://developers.arcgis.com/javascript/latest/references/core/widgets/TimeSlider/#stops) property defines specific locations on the TimeSlider where thumbs will snap to when
* manipulated. You can set this property to be either an array of dates, a number of evenly spaced stops
* or a specific time interval (e.g. days). The [timeExtent](https://developers.arcgis.com/javascript/latest/references/core/widgets/TimeSlider/#timeExtent) property defines the
* current location of the thumbs.
*
* [](https://developers.arcgis.com/javascript/latest/sample-code/timeslider/)
*
* If the time slider widget settings are invalid, the current time segment and thumbs will be drawn in a red color with a message indicating the issue.
* [](https://developers.arcgis.com/javascript/latest/sample-code/timeslider/)
*
* ### Configuring your time aware data
*
* The TimeSlider widget can be configured to manipulate your time aware data in two different ways
* as outlined below:
*
* #### Update the view's timeExtent
*
* The TimeSlider widget can be configured to update the view's [View.timeExtent](https://developers.arcgis.com/javascript/latest/references/core/views/View/#timeExtent)
* when the [view](https://developers.arcgis.com/javascript/latest/references/core/widgets/TimeSlider/#view) property is set on the widget. Use this approach if your service has been published with `timeInfo` information.
* This approach requires less code.
*
* <details>
* <summary>Read More</summary>
*
* With this approach, whenever a TimeSlider's [timeExtent](https://developers.arcgis.com/javascript/latest/references/core/widgets/TimeSlider/#timeExtent) is updated, the assigned view's
* [View.timeExtent](https://developers.arcgis.com/javascript/latest/references/core/views/View/#timeExtent) will also be updated. All time-aware layers will automatically update to conform to the view's timeExtent.
* Check out the [Set time properties on data (ArcGIS Pro)](https://pro.arcgis.com/en/pro-app/help/mapping/time/set-the-time-properties-on-data.htm) and
* [Configure time settings on a layer (ArcGIS Online)](https://doc.arcgis.com/en/arcgis-online/create-maps/configure-time-mv.htm) documents to learn how to enable time on your service.
*
* ```js
* // Create a TimeSlider for the first decade of the 21st century.
* // set the TimeSlider's view property.
* // Only show content for the 1st year of the decade for all
* // time aware layers in the view.
* const timeSlider = new TimeSlider({
* container: "timeSliderDiv",
* view: view,
* // show data within a given time range
* // in this case data within one year
* mode: "time-window",
* fullTimeExtent: { // entire extent of the timeSlider
* start: new Date(2000, 0, 1),
* end: new Date(2010, 0, 1)
* },
* timeExtent: { // location of timeSlider thumbs
* start: new Date(2000, 0, 1),
* end: new Date(2001, 1, 1)
* }
* });
* view.ui.add(timeSlider, "manual");
* ```
*
* </details>
*
* #### Watch TimeSlider's timeExtent
*
* The TimeSlider widget can also be configured to apply a custom logic whenever the TimeSlider's [timeExtent](https://developers.arcgis.com/javascript/latest/references/core/widgets/TimeSlider/#timeExtent) property changes.
* This approach can be used if your service has a date field but does not have time enabled. You can
* also use this approach if you want to have a complete control over the logic whenever the timeSlider's timeExtent updates.
*
* <details>
* <summary>Read More</summary>
*
* For example, when the TimeSlider's [timeExtent](https://developers.arcgis.com/javascript/latest/references/core/widgets/TimeSlider/#timeExtent) is updated,
* you may want to update the [timeExtent](https://developers.arcgis.com/javascript/latest/references/core/layers/support/FeatureFilter/#timeExtent)
* property of client-side [filters](https://developers.arcgis.com/javascript/latest/references/core/views/layers/FeatureLayerView/#filter) and
* [feature effects](https://developers.arcgis.com/javascript/latest/references/core/views/layers/FeatureLayerView/#featureEffect) on a
* [FeatureLayerView](https://developers.arcgis.com/javascript/latest/references/core/views/layers/FeatureLayerView/#filter),
* [CSVLayerView](https://developers.arcgis.com/javascript/latest/references/core/views/layers/CSVLayerView/), [GeoJSONLayerView](https://developers.arcgis.com/javascript/latest/references/core/views/layers/GeoJSONLayerView/) or [OGCFeatureLayerView](https://developers.arcgis.com/javascript/latest/references/core/views/layers/OGCFeatureLayerView/)
* as well as other layer views that support filters and feature effects.
* A [FeatureFilter](https://developers.arcgis.com/javascript/latest/references/core/layers/support/FeatureFilter/) can be used to filter out data that is not included in the current timeExtent,
* and a [FeatureEffect](https://developers.arcgis.com/javascript/latest/references/core/layers/support/FeatureEffect/) can be used to apply a visual effect to features that
* are included in or excluded from the current timeExtent. The [FeatureEffect](https://developers.arcgis.com/javascript/latest/references/core/layers/support/FeatureEffect/) can only be used in a
* [2D MapView](https://developers.arcgis.com/javascript/latest/references/core/views/MapView/).
*
* > [!WARNING]
* >
* > **Warning:** When watching the [timeExtent](https://developers.arcgis.com/javascript/latest/references/core/widgets/TimeSlider/#timeExtent) property, the [view](https://developers.arcgis.com/javascript/latest/references/core/widgets/TimeSlider/#view) should not be set on the TimeSlider widget instance.
* > Setting both the TimeSlider's [view](https://developers.arcgis.com/javascript/latest/references/core/widgets/TimeSlider/#view) property (explained above) and applying a
* > [timeExtent](https://developers.arcgis.com/javascript/latest/references/core/layers/support/FeatureFilter/#timeExtent) to a client-side
* > [feature effect](https://developers.arcgis.com/javascript/latest/references/core/views/layers/FeatureLayerView/#featureEffect) may result in excluded features not being rendered to the view.
* > This is because excluded features have been filtered out by the view's timeExtent, so the effect will not show.
*
* ```js
* // Create a time slider to update layerView filter
* const timeSlider = new TimeSlider({
* container: "timeSliderDiv",
* mode: "cumulative-from-start",
* });
* view.ui.add(timeSlider, "manual");
*
* // wait until the layer view is loaded
* let timeLayerView;
* view.whenLayerView(layer).then((layerView) => {
* timeLayerView = layerView;
* const fullTimeExtent = layer.timeInfo.fullTimeExtent;
* const end = fullTimeExtent.start;
*
* // set up time slider properties based on layer timeInfo
* timeSlider.fullTimeExtent = fullTimeExtent;
* timeSlider.timeExtent = {
* start: null,
* end: end
* };
* timeSlider.stops = {
* interval: layer.timeInfo.interval
* };
* });
*
* reactiveUtils.watch(
* () => timeSlider.timeExtent,
* (value) => {
* // update layer view filter to reflect current timeExtent
* timeLayerView.filter = {
* timeExtent: value
* };
* }
* );
* ```
*
* </details>
*
* ### Set TimeSlider widget from a WebMap
*
* The TimeSlider settings can be imported from a [WebMap](https://developers.arcgis.com/javascript/latest/references/core/WebMap/) and applied to the TimeSlider widget
* by calling the [getTimeSliderSettingsFromWebDocument()](https://developers.arcgis.com/javascript/latest/references/core/support/timeUtils/#getTimeSliderSettingsFromWebDocument) utility method.
*
* <details>
* <summary>Read More</summary>
*
* For example, the following snippet shows how a WebMap with TimeSlider settings can be loaded into a view.
*
* ```js
* // this webmap is saved with TimeSlider settings
* const webmap = new WebMap({
* portalItem: {
* id: "your-webmap-id"
* }
* });
*
* // set the TimeSlider widget to honor the TimeSlider settings from the webmap.
* timeUtils.getTimeSliderSettingsFromWebDocument(webmap).then((timeSliderSettings) => {
* const timeSlider = new TimeSlider({
* ...timeSliderSettings,
* view
* });
*
* const { unit, value } = timeSlider.stops.interval;
* console.log(`The stop interval is every ${value} ${unit}.`); // output: "This stop interval is every 3 weeks."
* });
* ```
*
* In the example above, the timeSlider definition in the
* webmap has a play rate (or `thumbMovingRate`) of 2 seconds. The following snippet overrides this setting.
*
* ```js
* const timeSlider = new TimeSlider({
* ...timeSliderSettings,
* view,
* playRate: 1000
* });
* console.log(`The playback rate is ${timeSlider.playRate} ms.`); // output: "The playback rate is 1000 ms."
* ```
*
* It may be necessary to examine or adjust settings after they have been imported from a webmap. To determine when the
* import has completed you can watch for the `ready` [TimeSliderViewModel.state](https://developers.arcgis.com/javascript/latest/references/core/widgets/TimeSlider/TimeSliderViewModel/#state)
* of the [viewModel](https://developers.arcgis.com/javascript/latest/references/core/widgets/TimeSlider/#viewModel). The snippet expands or snaps the [fullTimeExtent](https://developers.arcgis.com/javascript/latest/references/core/widgets/TimeSlider/#fullTimeExtent) after the property
* has been computed from an associated webmap.
*
* ```js
* await reactiveUtils.whenOnce(() => timeSlider.viewModel.state === "ready");
* timeSlider.fullTimeExtent = timeSlider.fullTimeExtent.expandTo("years");
* ```
*
* </details>
*
* @deprecated since version 5.0. Use the [Time Slider component](https://developers.arcgis.com/javascript/latest/references/map-components/components/arcgis-time-slider/) instead. For information on widget deprecation, read about [Esri's move to web components](https://developers.arcgis.com/javascript/latest/components-transition-plan/).
* @since 4.12
* @see [TimeSliderViewModel](https://developers.arcgis.com/javascript/latest/references/core/widgets/TimeSlider/TimeSliderViewModel/)
* @see [Sample - Time Slider component](https://developers.arcgis.com/javascript/latest/sample-code/timeslider/)
* @see [Sample - SceneLayer with time filter](https://developers.arcgis.com/javascript/latest/sample-code/layers-scenelayer-time/)
* @see [Sample - Filter features with TimeSlider component](https://developers.arcgis.com/javascript/latest/sample-code/timeslider-component-filter/)
* @see [Sample - TimeSlider with offset](https://developers.arcgis.com/javascript/latest/sample-code/widgets-timeslider-offset/)
* @see [Sample - Visualizing wind data with VectorFieldRenderer](https://developers.arcgis.com/javascript/latest/sample-code/layers-imagery-vfrenderer/)
* @see [Temporal data (ArcGIS Pro)](https://pro.arcgis.com/en/pro-app/help/mapping/time/temporal-data.htm)
* @see [Set time properties on data (ArcGIS Pro)](https://pro.arcgis.com/en/pro-app/help/mapping/time/set-the-time-properties-on-data.htm)
* @see [Configure time settings on a layer (ArcGIS Online)](https://doc.arcgis.com/en/arcgis-online/create-maps/configure-time-mv.htm)
* @see [Set GeoJSONLayer timeInfo](https://developers.arcgis.com/javascript/latest/references/core/layers/GeoJSONLayer/#timeInfo)
* @see [Set CSVLayer timeInfo](https://developers.arcgis.com/javascript/latest/references/core/layers/CSVLayer/#timeInfo)
* @see [DefaultUI](https://developers.arcgis.com/javascript/latest/references/core/views/ui/DefaultUI/)
*/
export default class TimeSlider extends Widget {
/**
* @deprecated
* Do not directly reference this property.
* Use EventNames and EventTypes helpers from \@arcgis/core/Evented
*/
"@eventTypes": TimeSliderEvents;
constructor(properties?: TimeSliderProperties);
/**
* Defines actions that will appear in a menu when the user clicks the ellipsis button
*  in the widget. The
* ellipsis button will not display if this property is `null` or if the collection is empty.
* Each [Action](https://developers.arcgis.com/javascript/latest/references/core/widgets/TimeSlider/types/#Action) is defined with a unique id, a title,
* and an icon.
*
* The [@trigger-action](https://developers.arcgis.com/javascript/latest/references/core/widgets/TimeSlider/#event-trigger-action) event fires each time an action in the menu is clicked. This event
* can be used to execute custom code such as setting the [timeExtent](https://developers.arcgis.com/javascript/latest/references/core/widgets/TimeSlider/#timeExtent) to a specific date or copying the
* timeExtent to the browser's clipboard.
*
* [](https://developers.arcgis.com/javascript/latest/sample-code/widgets-timeslider-offset/)
*
* @since 4.21
* @see [Sample - TimeSlider with offset](https://developers.arcgis.com/javascript/latest/sample-code/widgets-timeslider-offset/)
* @example
* // Create a TimeSlider with two actions to snap the thumb to
* // two specific time extents.
* const timeSlider = new TimeSlider({
* container: "timeSliderDiv",
* fullTimeExtent: {
* start: new Date(2011, 0, 1),
* end: new Date(2012, 0, 1)
* },
* mode: "instant",
* actions: [
* {
* id: "quake",
* icon: "exclamation-mark-triangle",
* title: "Jump to Earthquake"
* },
* {
* id: "quake-plus-one-month",
* icon: "organization",
* title: "One month later"
* }
* ]
* });
*
* // listen to timeSlider's trigger-action event
* // check what action user clicked on and respond accordingly.
* timeSlider.on("trigger-action", (event) => {
* const quake = new Date(Date.UTC(2011, 3, 11, 8, 16, 12));
* const oneMonthLater = new Date(quake.getTime()).setMonth(quake.getMonth() + 1);
* switch(event.action.id) {
* case "quake":
* timeSlider.timeExtent = {
* start: quake,
* end: quake
* };
* break;
* case "quake-plus-one-month":
* timeSlider.timeExtent = {
* start: oneMonthLater,
* end: oneMonthLater
* };
* break;
* }
* });
*/
get actions(): Collection<Action>;
set actions(value: ReadonlyArrayOrCollection<Action>);
/**
* When `true`, sets the widget to a disabled state so the user cannot interact with it.
*
* @default false
* @since 4.16
* @example
* // Create a timeslider widget that is initially disabled.
* const timeSlider = new TimeSlider({
* container: "timeSliderDiv",
* fullTimeExtent: {
* start: new Date(2000, 5, 1),
* end: new Date(2010, 0, 1)
* },
* disabled: true
* });
*/
accessor disabled: boolean;
/**
* Lists the specific locations on the timeline where handle(s) will snap to when manipulated.
*
* @example
* timeSlider.effectiveStops.forEach((stop) => {
* console.log(stop);
* });
*/
get effectiveStops(): Date[] | null | undefined;
/**
* The temporal extent of the entire slider.
* It defines the entire time period within which you can visualize
* your time aware data using the time slider widget.
*
* @example
* // Create a new TimeSlider with set dates
* const timeSlider = new TimeSlider({
* container: "timeSliderDiv",
* view: view
* });
*
* // wait for the time-aware layer to load
* layer.when(() => {
* // set up time slider properties based on layer timeInfo
* timeSlider.fullTimeExtent = layer.timeInfo.fullTimeExtent;
* timeSlider.stops = {
* interval: layer.timeInfo.interval
* };
* });
*/
get fullTimeExtent(): TimeExtent | null | undefined;
set fullTimeExtent(value: TimeExtentProperties | null | undefined);
/**
* Icon which represents the widget. It is typically used when the widget is controlled by another
* one (e.g. in the Expand widget).
*
* @default "clock"
* @since 4.27
* @see [Calcite Icon Search](https://developers.arcgis.com/calcite-design-system/icons/)
* @see [Calcite Icon Search](https://developers.arcgis.com/calcite-design-system/icons/)
*/
get icon(): Icon["icon"];
set icon(value: Icon["icon"] | null | undefined);
/**
* The widget's default label.
*
* @since 4.11
*/
get label(): string;
set label(value: string | null | undefined);
/**
* A function used to specify custom formatting and styling of the min, max, and extent labels of the TimeSlider.
* Please refer to [DateLabelFormatter](https://developers.arcgis.com/javascript/latest/references/core/widgets/TimeSlider/#DateLabelFormatter) for more detailed information on how to configure the style and format of the labels.
*
* The image below demonstrates how the date format, color, size, and font family of the label can be customized.
* The code for this specific configuration is shown in the following example.
*
* 
*
* @since 4.17
* @example
* // The following example customizes the text and styling of the min, max and extent labels.
* // Specifically:
* // 1) min/max labels
* // - short date format with en-us locale (e.g. "9/1/2020", "9/2/2020", "9/3/2020" etc)
* // - use 'Orbitron' font, magenta color and 16pt size
* // 2) extent label
* // - display accumulated days (e.g. "Day 0", "Day 1", "Day 2" etc)
* // - use 'Orbitron' font, red color and 22pt size
* // The labelFormatFunction must wait until the time slider's properties are set.
* // In this case, the function must wait until the time slider's fullTimeExtent is set.
* const timeSlider = new TimeSlider({
* container: "timeSlider",
* view,
* timeVisible: true,
* loop: true,
* labelFormatFunction: (value, type, element, layout) => {
* if (!timeSlider.fullTimeExtent) {
* element.setAttribute(
* "style",
* "font-family: 'Orbitron', sans-serif; font-size: 11px; color: black;"
* );
* element.innerText = "loading..."
* return;
*
* const normal = new Intl.DateTimeFormat("en-us");
* switch (type) {
* case "min":
* case "max":
* element.setAttribute(
* "style",
* "font-family: 'Orbitron', sans-serif; font-size: 16px; color: magenta;"
* );
* element.innerText = normal.format(value);
* break;
* case "extent":
* const start = timeSlider.fullTimeExtent.start;
* const days = (value[0].getTime() - start.getTime()) / 1000 / 3600 / 24;
* element.setAttribute(
* "style",
* "font-family: 'Orbitron', sans-serif; font-size: 18px; color: red;"
* );
* element.innerText = `Day ${days}`;
* break;
* }
* }
* });
*/
accessor labelFormatFunction: DateLabelFormatter | null | undefined;
/**
* Determines the layout used by the TimeSlider widget.
*
* Possible values are listed below:
* | Value | Description |
* | --- | --- |
* | auto | Automatically uses the "compact" layout when the widget width is less than 858 pixels. Otherwise the "wide" layout it used. |
* | compact | Widget elements are oriented vertically. This layout is better suited to narrower widths. |
* | wide | Widget elements are oriented laterally. This thinner design is better suited to wide applications. |
*
* @default "auto"
* @since 4.16
* @example timeSlider.layout = "compact";
*/
accessor layout: TimeSliderLayout;
/**
* When `true`, the time slider will play its animation in a loop.
*
* @default false
* @example
* // Start a time slider animation that advances every second
* // and restarts when it reaches the end.
* timeSlider.set({
* loop: true,
* playRate: 1000
* });
* timeSlider.play();
*/
accessor loop: boolean;
/**
* The time slider mode. This property is used for defining if the temporal data will be displayed
* cumulatively up to a point in time, a single instant in time, or within a time range. See
* the following table for possible values.
*
* Possible Values | Description | Example |
* ----------------------|-------------- | ------- |
* instant | The slider will show temporal data that falls on a single instance in time. Set the [timeExtent](https://developers.arcgis.com/javascript/latest/references/core/widgets/TimeSlider/#timeExtent) property's `start` and `end` dates to same date: `{start: sameDate, end: sameDate}` | <img alt="mode-instance" src="https://developers.arcgis.com/javascript/latest/assets/references/core/widgets/timeslider/mode-instance.png"> |
* time-window | The slider will show temporal data that falls within a given time range. This is the default. Set [timeExtent](https://developers.arcgis.com/javascript/latest/references/core/widgets/TimeSlider/#timeExtent) property's `start` and `date` properties to desired dates. | <img alt="mode-instance" src="https://developers.arcgis.com/javascript/latest/assets/references/core/widgets/timeslider/mode-time-window.png"> |
* cumulative-from-start | Similar to `time-window` with the start time is always pinned to the start of the slider. Set the [timeExtent](https://developers.arcgis.com/javascript/latest/references/core/widgets/TimeSlider/#timeExtent) property's `start` date to `null` and set `end` date to a desired date: `{start: null, end: date}` | <img alt="mode-instance" src="https://developers.arcgis.com/javascript/latest/assets/references/core/widgets/timeslider/mode-from-start.png"> |
* cumulative-from-end | Also, similar to the `time-window` with the end time pinned to the end of the slider. Set the [timeExtent](https://developers.arcgis.com/javascript/latest/references/core/widgets/TimeSlider/#timeExtent) property's `start` date to a desired date and set `end` date to `null`: `{start: date, end: null}` | <img alt="mode-instance" src="https://developers.arcgis.com/javascript/latest/assets/references/core/widgets/timeslider/mode-from-end.png"> |
*
* @default "time-window"
* @see [timeExtent](https://developers.arcgis.com/javascript/latest/references/core/widgets/TimeSlider/#timeExtent)
* @example
* // Create a single thumbed time slider that includes all historic content.
* const timeSlider = new TimeSlider({
* container: "timeSliderDiv",
* view: view,
* mode: "cumulative-from-start",
* fullTimeExtent: {
* start: new Date(2000, 0, 1),
* end: new Date(2010, 0, 1)
* },
* timeExtent: {
* start: null,
* end: new Date(2001, 0, 1) //end date
* }
* });
*/
accessor mode: TimeSliderMode;
/**
* The time (in milliseconds) between animation steps.
*
* > [!WARNING]
* >
* > When a [View](https://developers.arcgis.com/javascript/latest/references/core/views/View/) is associated with a TimeSlider and the TimeSlider is playing, the playback will pause before advancing if the View is still updating.
* > For example, if the `playRate` is set to 1,000 (one second) and the `View` takes 1.5 seconds to render then the TimeSlider thumb(s) will advance every
* > 1.5 seconds rather than every second.
*
* @default 1000
* @example
* // Start a time slider animation that advances
* // ten times a second and stops when it reaches the end.
* timeSlider.set({
* loop: false,
* playRate: 100
* });
* timeSlider.play();
*/
accessor playRate: number;
/**
* Defines specific locations on the time slider where thumbs will snap to when manipulated.
* If unspecified, ten evenly spaced stops will be added.
*
* For continuous sliding, set `stops` to `null`:
* ```js
* timeSlider.stops = null;
* ```
*
* To define regularly spaced stops, parse an object with `interval` and `timeExtent` properties
* with types [TimeInterval](https://developers.arcgis.com/javascript/latest/references/core/time/TimeInterval/) and [TimeExtent](https://developers.arcgis.com/javascript/latest/references/core/time/TimeExtent/) respectively.
* The [timeExtent](https://developers.arcgis.com/javascript/latest/references/core/widgets/TimeSlider/#timeExtent) property is optional and used to confine stops to a certain date range.
* This property is useful to commence stops on a specific day of the week or month.
* If a stop definition by interval results in excess of 10,000 stops, then the view model
* will default to ten evenly spaced stops.
*
* ```js
* // Add yearly intervals starting from the beginning of the TimeSlider.
* timeSlider.stops = {
* interval: {
* value: 1,
* unit: "years"
* }
* };
* ```
* Rather than setting the stops as time intervals, the TimeSlider can be divided into evenly spaced
* stops using the `count` property. Similar to the previous method, divisions can be confined to a specific date range
* using the optional timeExtent property.
* ```js
* // Add stops at 15 evenly spaced intervals.
* timeSlider.stops = {
* count: 15
* };
* ```
* For irregularly spaced stops, simply assign an array of dates as demonstrated below.
* ```js
* // Add nine irregular stops.
* timeSlider.stops = {
* dates: [
* new Date(2000, 0, 1), new Date(2001, 3, 8), new Date(2002, 0, 10),
* new Date(2003, 12, 8), new Date(2004, 2, 19), new Date(2005, 7, 5),
* new Date(2006, 9, 11), new Date(2007, 11, 21), new Date(2008, 1, 10)
* ]
* };
* ```
* Lastly, to constrain or offset division by count or interval use the optional timeExtent property.
* ```js
* // Add yearly stops from Christmas 2019 to Christmas 2029 only
* timeSlider.stops = {
* interval: {
* value: 1,
* unit: "years"
* },
* timeExtent: {
* start: new Date(2019, 11, 25),
* end: new Date(2029, 11, 25)
* }
* };
*
* // Likewise, add stops that represent quarters of 2019 only.
* timeSlider.stops = {
* count: 4,
* timeExtent: {
* start: new Date(2019, 0, 1),
* end: new Date(2020, 0, 1)
* }
* };
* ```
*
* @default { count : 10 }
*/
accessor stops: Stops | null | undefined;
/**
* When set, overrides the default TimeSlider ticks labelling system.
* Please refer to [TickConfig](https://developers.arcgis.com/javascript/latest/references/core/widgets/Slider/types/#TickConfig) for detailed documentation
* on how to configure tick placement, style, and behavior.
*
* @since 4.16
* @example
* // By default in "en-US" the TimeSlider will display ticks with "2010, 2011, 2012, etc".
* // Overwrite TimeSlider tick configuration so that labels display "'10, '12, '14, etc" in red.
* const timeSlider = new TimeSlider({
* container: "timeSliderDiv",
* fullTimeExtent: {
* start: new Date(2010, 0, 1),
* end: new Date(2020, 0, 1)
* },
* tickConfigs: [{
* mode: "position",
* values: [
* new Date(2010, 0, 1), new Date(2012, 0, 1), new Date(2014, 0, 1),
* new Date(2016, 0, 1), new Date(2018, 0, 1), new Date(2020, 0, 1)
* ].map((date) => date.getTime()),
* labelsVisible: true,
* labelFormatFunction: (value) => {
* const date = new Date(value);
* return `'${date.getUTCFullYear() - 2000}`;
* },
* tickCreatedFunction: (value, tickElement, labelElement) => {
* tickElement.classList.add("custom-ticks");
* labelElement.classList.add("custom-labels");
* }
* }]
* };
* @example
* // this CSS goes with the snippet above.
* #timeSlider .custom-ticks {
* background-color: red;
* width: 1px;
* height: 8px;
* }
* #timeSlider .custom-labels {
* font-family: Georgia, 'Times New Roman', Times, serif;
* font-size: 15px;
* color: red;
* }
*/
accessor tickConfigs: TickConfig[] | null | undefined;
/**
* The current time extent of the time slider. This property can be watched for
* updates and used to update the time extent property in queries and/or the layer filters and effects.
* The following table shows the `timeExtent` values returned for each [mode](https://developers.arcgis.com/javascript/latest/references/core/widgets/TimeSlider/#mode).
*
* | Mode | The timeExtent value |
* | ------- | -------------------- |
* | `time-window` | `{start: startDate, end: endDate}` |
* | `instant` | `{start: sameDate, end: sameDate}` |
* | `cumulative-from-start` | `{start: null, end: endDate}` |
* | `cumulative-from-end` | `{start: startDate, end: null}` |
*
* @example
* // Display the time extent to the console whenever it changes.
* const timeSlider = new TimeSlider({
* container: "timeSliderDiv",
* mode: "time-window",
* fullTimeExtent: {
* start: new Date(2019, 2, 3),
* end: new Date(2019, 2, 5)
* },
* timeExtent: {
* start: new Date(2019, 2, 1),
* end: new Date(2019, 2, 28)
* }
* });
*
* reactiveUtils.watch(
* () => timeSlider.timeExtent,
* (timeExtent) => {
* console.log("Time extent now starts at", timeExtent.start, "and finishes at:", timeExtent.end);
* }
* );
*/
get timeExtent(): TimeExtent | null | undefined;
set timeExtent(value: TimeExtentProperties | null | undefined);
/**
* Shows/hides time in the display.
*
* @default false
* @example
* // For time sliders with a small time extent it may be useful to display times as shown below.
* const timeSlider = new TimeSlider({
* container: "timeSliderDiv",
* mode: "time-window",
* timeVisible: true,
* fullTimeExtent: {
* start: new Date(2019, 2, 3),
* end: new Date(2019, 2, 5)
* },
* timeExtent: {
* start: new Date(2019, 2, 1),
* end: new Date(2019, 2, 28)
* }
* });
*/
accessor timeVisible: boolean;
/**
* Dates and times displayed in the widget will be displayed in this time zone. By default this time zone is
* inherited from [MapView.timeZone](https://developers.arcgis.com/javascript/latest/references/core/views/MapView/#timeZone). When a MapView is not associated with the widget
* then the property will fallback to the `system` time zone.
*
* **Possible Values**
*
* Value | Description |
* ----- | ----------- |
* system | Dates and times will be displayed in the timezone of the device or browser.
* unknown | Dates and time are not adjusted for any timezone. [TimeSlider](https://developers.arcgis.com/javascript/latest/references/core/widgets/TimeSlider/) will be disabled.
* Specified IANA timezone | Dates and times will be displayed in the specified IANA time zone. See [wikipedia - List of tz database time zones](https://en.wikipedia.org/wiki/List_of_tz_database_time_zones).
*
* @since 4.28
*/
get timeZone(): TimeZone;
set timeZone(value: TimeZone | null | undefined);
/**
* A reference to the [MapView](https://developers.arcgis.com/javascript/latest/references/core/views/MapView/) or [SceneView](https://developers.arcgis.com/javascript/latest/references/core/views/SceneView/).
* If this property is set, the TimeSlider widget will update the view's [MapView.timeExtent](https://developers.arcgis.com/javascript/latest/references/core/views/MapView/#timeExtent)
* property whenever the time slider is manipulated or updated programmatically. This property will affect
* any time-aware layer in the view.
*
* @example
* // Create and then add a TimeSlider widget and then listen to changes in the View's time extent.
* const timeSlider = new TimeSlider({
* container: "timeSliderDiv",
* view: view,
* mode: "instant",
* fullTimeExtent: {
* start: new Date(2000, 0, 1),
* end: new Date(2010, 0, 1)
* },
* timeExtent: {
* start: new Date(2000, 0, 1),
* end: new Date(2000, 0, 1)
* }
* });
* view.ui.add(timeSlider, "top-left");
*
* reactiveUtils.watch(
* () => view.timeExtent,
* (timeExtent) => {
* console.log("New view time is: ", timeExtent.start);
* }
* );
*/
accessor view: MapViewOrSceneView | null | undefined;
/**
* The view model for this widget. This is a class that contains all the logic
* (properties and methods) that controls this widget's behavior. See the
* [TimeSliderViewModel](https://developers.arcgis.com/javascript/latest/references/core/widgets/TimeSlider/TimeSliderViewModel/) class to access
* all properties and methods on the widget.
*
* @example
* // Below is an example of initializing a TimeSlider widget using properties
* // on the viewModel instead of the widget.
* const timeSlider = new TimeSlider({
* container: "timeSliderDiv",
* viewModel: {
* view: view,
* mode: "instant",
* fullTimeExtent: {
* start: new Date(2000, 0, 1),
* end: new Date(2010, 0, 1)
* },
* timeExtent: {
* start: new Date(2000, 0, 1),
* end: new Date(2000, 0, 1)
* }
* });
*/
get viewModel(): TimeSliderViewModel;
set viewModel(value: TimeSliderViewModelProperties);
/**
* Incrementally moves the time extent forward one stop.
*
* @example
* // Advance the slider's time extent.
* const timeSlider = new TimeSlider({
* container: "timeSliderDiv",
* mode: "instant",
* fullTimeExtent: {
* start: new Date(2000, 0, 1),
* end: new Date(2010, 0, 1)
* },
* timeExtent: {
* start: new Date(2000, 0, 1),
* end: new Date(2000, 0, 1)
* }
* });
* timeSlider.next();
*/
next(): void;
/**
* Initiates the time slider's temporal playback.
*
* @example
* // Start a TimeSlider animation if not already playing.
* if (timeSlider.state === "ready") {
* timeSlider.play();
* }
*/
play(): void;
/**
* Incrementally moves the time extent back one stop.
*
* @example timeSlider.previous();
*/
previous(): void;
/**
* Stops the time slider's temporal playback.
*
* @example
* // Stop the current TimeSlider animation.
* if (timeSlider.viewModel.state === "playing") {
* timeSlider.stop();
* }
*/
stop(): void;
/**
* Updates the [time slider](https://developers.arcgis.com/javascript/latest/references/core/webdoc/Widgets/#timeSlider) widget definition in the provided [WebMap](https://developers.arcgis.com/javascript/latest/references/core/WebMap/) or [WebScene](https://developers.arcgis.com/javascript/latest/references/core/WebScene/).
*
* @param document - The webmap or webscene to be updated.
* @since 4.18
* @example
* // Load a webmap containing a timeslider widget into a MapView. Once loaded, advance the current time
* // extent by one stop and then update the original webmap.
*
* const webmap = new WebMap({
* portalItem: {
* id: "acea555a4b6f412dae98994bcfdbc002"
* }
* });
*
* const view = new MapView({
* container: "viewDiv",
* map: webmap
* });
* await view.when();
*
* const timeSlider = new TimeSlider({
* view
* });
* // Advance to thumb to next time extent
* timeSlider.next();
* timeSlider.updateWebDocument(webmap);
* webmap.save();
*/
updateWebDocument(document: WebMap | WebScene): void;
}