@arcgis/core
Version:
ArcGIS Maps SDK for JavaScript: A complete 2D and 3D mapping and data visualization API
764 lines (761 loc) • 62.5 kB
TypeScript
import type Graphic from "../../Graphic.js";
import type Collection from "../../core/Collection.js";
import type Mesh from "../../geometry/Mesh.js";
import type GraphicsLayer from "../../layers/GraphicsLayer.js";
import type MapNotesLayer from "../../layers/MapNotesLayer.js";
import type CIMSymbol from "../../symbols/CIMSymbol.js";
import type SimpleFillSymbol from "../../symbols/SimpleFillSymbol.js";
import type TextSymbol from "../../symbols/TextSymbol.js";
import type Tooltip from "../../views/interactive/Tooltip.js";
import type SketchLabelOptions from "../../views/interactive/sketch/SketchLabelOptions.js";
import type SketchTooltipOptions from "../../views/interactive/sketch/SketchTooltipOptions.js";
import type SketchValueOptions from "../../views/interactive/sketch/SketchValueOptions.js";
import type SnappingOptions from "../../views/interactive/snapping/SnappingOptions.js";
import type { EventedAccessor } from "../../core/Evented.js";
import type { TextSymbolProperties } from "../../symbols/TextSymbol.js";
import type { MapViewOrSceneView } from "../../views/MapViewOrSceneView.js";
import type { PluginConfiguration } from "../../views/draw/support/types.js";
import type { SnappingOptionsProperties } from "../../views/interactive/snapping/SnappingOptions.js";
import type { CreateEvent, CreateOptions, CreateTool, CreationMode, DeleteEvent, RedoEvent, SketchPointSymbol, SketchPolygonSymbol, SketchPolylineSymbol, SketchTool, State, UpdateEvent, UpdateOptions, UndoEvent } from "./types.js";
import type { CIMSymbolProperties } from "../../symbols/CIMSymbol.js";
import type { SimpleFillSymbolProperties } from "../../symbols/SimpleFillSymbol.js";
import type { SketchLabelOptionsProperties } from "../../views/interactive/sketch/SketchLabelOptions.js";
import type { WebStyleSymbolProperties } from "../../symbols/WebStyleSymbol.js";
import type { PointSymbol3DProperties } from "../../symbols/PointSymbol3D.js";
import type { PictureMarkerSymbolProperties } from "../../symbols/PictureMarkerSymbol.js";
import type { SimpleMarkerSymbolProperties } from "../../symbols/SimpleMarkerSymbol.js";
import type { PolygonSymbol3DProperties } from "../../symbols/PolygonSymbol3D.js";
import type { LineSymbol3DProperties } from "../../symbols/LineSymbol3D.js";
import type { SimpleLineSymbolProperties } from "../../symbols/SimpleLineSymbol.js";
import type { SketchTooltipOptionsProperties } from "../../views/interactive/sketch/SketchTooltipOptions.js";
import type { SketchValueOptionsProperties } from "../../views/interactive/sketch/SketchValueOptions.js";
export interface SketchViewModelProperties extends Partial<Pick<SketchViewModel, "creationMode" | "layer" | "updateOnGraphicClick" | "useLegacyCreateTools" | "view">> {
/**
* The [SimpleFillSymbol](https://developers.arcgis.com/javascript/latest/references/core/symbols/SimpleFillSymbol/) displayed when actively creating a new `polygon` graphic using the [polygon](https://developers.arcgis.com/javascript/latest/references/core/widgets/Sketch/SketchViewModel/#activeTool) tool.
*
* > [!WARNING]
* >
* > **Known Limitation**
* > Not supported in 3D [SceneViews](https://developers.arcgis.com/javascript/latest/references/core/views/SceneView/).
* > To avoid unintended side effects, instantiate a new symbol rather than modifying the current instance.
*
* The default value is the following:
* ```js
* {
* type: "simple-fill",
* style: "solid",
* color: [150, 150, 150, 0.2],
* outline: {
* color: [50, 50, 50],
* width: 0
* }
* }
* ```
*
* @since 4.20
*/
activeFillSymbol?: (SimpleFillSymbolProperties & { type: "simple-fill" }) | (CIMSymbolProperties & { type: "cim" }) | null;
/**
* Default create options set for the SketchViewModel.
*
* @since 4.14
*/
defaultCreateOptions?: Partial<CreateOptions>;
/**
* Default update options set for the SketchViewModel. Update options set on this property will be overridden by options passed to
* the [update()](https://developers.arcgis.com/javascript/latest/references/core/widgets/Sketch/SketchViewModel/#update) method.
*
* @since 4.10
* @example
* // Turn off highlights for update operations
* const svm = new SketchViewModel({
* view,
* defaultUpdateOptions: {
* highlightOptions: {
* enabled: false
* }
* }
* });
* // Turn off highlights from the update() method
* const updateOptions = { tool: "reshape", highlightOptions: { enabled: false }};
* svm.update(graphic, updateOptions);
*/
defaultUpdateOptions?: Partial<UpdateOptions>;
/**
* Options to configure the sketch labels shown next to each segment of the geometry being created or updated.
*
* > [!WARNING]
* >
* > **Known Limitation**
* >
* > Sketch labels are currently only supported when working with a [SceneView](https://developers.arcgis.com/javascript/latest/references/core/views/SceneView/).
*
* @since 4.24
*/
labelOptions?: SketchLabelOptionsProperties;
/**
* A [SimpleMarkerSymbol](https://developers.arcgis.com/javascript/latest/references/core/symbols/SimpleMarkerSymbol/), [PictureMarkerSymbol](https://developers.arcgis.com/javascript/latest/references/core/symbols/PictureMarkerSymbol/), [PointSymbol3D](https://developers.arcgis.com/javascript/latest/references/core/symbols/PointSymbol3D/), [TextSymbol](https://developers.arcgis.com/javascript/latest/references/core/symbols/TextSymbol/), [CIMSymbol](https://developers.arcgis.com/javascript/latest/references/core/symbols/CIMSymbol/), or [WebStyleSymbol](https://developers.arcgis.com/javascript/latest/references/core/symbols/WebStyleSymbol/) used for representing the point geometry that is being drawn. [SimpleMarkerSymbol](https://developers.arcgis.com/javascript/latest/references/core/symbols/SimpleMarkerSymbol/) may also be used to symbolize point features in a [SceneView](https://developers.arcgis.com/javascript/latest/references/core/views/SceneView/). However, it is recommended you use [PointSymbol3D](https://developers.arcgis.com/javascript/latest/references/core/symbols/PointSymbol3D/) instead.
*
* > [!WARNING]
* >
* > **Known Limitation**
* > To avoid unintended side effects, instantiate a new symbol rather than modifying the current instance.
*
* The default value is the following:
* ```js
* {
* type: "simple-marker",
* style: "circle",
* size: 6,
* color: [255, 255, 255],
* outline: {
* color: [50, 50, 50],
* width: 1
* }
* }
* ```
*/
pointSymbol?: ((SimpleMarkerSymbolProperties & { type: "simple-marker" }) | (PictureMarkerSymbolProperties & { type: "picture-marker" }) | (PointSymbol3DProperties & { type: "point-3d" }) | (TextSymbolProperties & { type: "text" }) | (CIMSymbolProperties & { type: "cim" }) | (WebStyleSymbolProperties & { type: "web-style" }));
/**
* A [SimpleFillSymbol](https://developers.arcgis.com/javascript/latest/references/core/symbols/SimpleFillSymbol/), [PolygonSymbol3D](https://developers.arcgis.com/javascript/latest/references/core/symbols/PolygonSymbol3D/), or [CIMSymbol](https://developers.arcgis.com/javascript/latest/references/core/symbols/CIMSymbol/) used for representing the polygon geometry that is being drawn. [SimpleFillSymbol](https://developers.arcgis.com/javascript/latest/references/core/symbols/SimpleFillSymbol/) may also be used to symbolize polygon features in a [SceneView](https://developers.arcgis.com/javascript/latest/references/core/views/SceneView/). However, it is recommended you use [PolygonSymbol3D](https://developers.arcgis.com/javascript/latest/references/core/symbols/PolygonSymbol3D/) instead.
*
* > [!WARNING]
* >
* > **Known Limitation**
* > To avoid unintended side effects, instantiate a new symbol rather than modifying the current instance.
*
* The default value is the following:
* ```js
* {
* type: "simple-fill",
* color: [150, 150, 150, 0.2],
* outline: {
* color: [50, 50, 50],
* width: 2
* }
* }
* ```
*/
polygonSymbol?: ((SimpleFillSymbolProperties & { type: "simple-fill" }) | (PolygonSymbol3DProperties & { type: "polygon-3d" }) | (CIMSymbolProperties & { type: "cim" }));
/**
* A [SimpleLineSymbol](https://developers.arcgis.com/javascript/latest/references/core/symbols/SimpleLineSymbol/), [LineSymbol3D](https://developers.arcgis.com/javascript/latest/references/core/symbols/LineSymbol3D/), or [CIMSymbol](https://developers.arcgis.com/javascript/latest/references/core/symbols/CIMSymbol/) used for representing the polyline geometry that is being drawn. [SimpleLineSymbol](https://developers.arcgis.com/javascript/latest/references/core/symbols/SimpleLineSymbol/) may also be used to symbolize polyline features in a [SceneView](https://developers.arcgis.com/javascript/latest/references/core/views/SceneView/). However, it is recommended you use [LineSymbol3D](https://developers.arcgis.com/javascript/latest/references/core/symbols/LineSymbol3D/) instead.
*
* > [!WARNING]
* >
* > **Known Limitation**
* > To avoid unintended side effects, instantiate a new symbol rather than modifying the current instance.
*
* The default value is the following:
* ```js
* {
* type: "simple-line",
* color: [130, 130, 130],
* width: 2
* }
* ```
*/
polylineSymbol?: ((SimpleLineSymbolProperties & { type: "simple-line" }) | (LineSymbol3DProperties & { type: "line-3d" }) | (CIMSymbolProperties & { type: "cim" }));
/**
* The [SnappingOptions](https://developers.arcgis.com/javascript/latest/references/core/views/interactive/snapping/SnappingOptions/) for sketching. It supports [self](https://developers.arcgis.com/javascript/latest/references/core/views/interactive/snapping/SnappingOptions/#selfEnabled) and [feature](https://developers.arcgis.com/javascript/latest/references/core/views/interactive/snapping/SnappingOptions/#featureEnabled) snapping.
*
* @since 4.18
*/
snappingOptions?: SnappingOptionsProperties;
/** A [TextSymbol](https://developers.arcgis.com/javascript/latest/references/core/symbols/TextSymbol/) used when creating features with the 'text' tool. */
textSymbol?: TextSymbolProperties & { type: "text"; };
/**
* Options to configure the tooltip shown next to the cursor when creating or updating graphics.
*
* @since 4.24
*/
tooltipOptions?: SketchTooltipOptionsProperties;
/**
* Options to configure how values are displayed and input when creating or updating graphics.
*
* @since 4.29
*/
valueOptions?: SketchValueOptionsProperties;
}
export interface SketchViewModelEvents {
/**
* Fires when a user starts sketching a graphic, is actively sketching a graphic and completes sketching a graphic.
*
* @since 4.10
* @example
* // Listen to sketch widget's create event.
* sketch.on("create", function(event) {
* // check if the create event's state has changed to complete indicating
* // the graphic create operation is completed.
* if (event.state === "complete") {
* // remove the graphic from the layer. Sketch adds
* // the completed graphic to the layer by default.
* polygonGraphicsLayer.remove(event.graphic);
*
* // use the graphic.geometry to query features that intersect it
* selectFeatures(event.graphic.geometry);
* }
* });
*/
create: CreateEvent;
/**
* Fires when the user starts updating graphics, is actively updating graphics, and completes updating graphics.
*
* @since 4.10
* @example
* // Listen to sketch's update event to show relevant data in a chart
* // as the graphics are being moved
* sketch.on("update", onMove);
*
* // Point graphics at the center and edge of the buffer polygon are being moved.
* // Recalculate the buffer with updated geometry and run the query stats using
* // the updated buffer and update the chart.
* function onMove(event) {
* // If the edge graphic is moving, keep the center graphic
* // at its initial location. Only move edge graphic to resize the buffer.
* if (event.toolEventInfo && event.toolEventInfo.mover.attributes.edge) {
* const toolType = event.toolEventInfo.type;
* if (toolType === "move-start") {
* centerGeometryAtStart = centerGraphic.geometry;
* }
* // keep the center graphic at its initial location when edge point is moving
* else if (toolType === "move" || toolType === "move-stop") {
* centerGraphic.geometry = centerGeometryAtStart;
* }
* }
*
* // the center or edge graphic is being moved, recalculate the buffer
* const vertices = [
* [centerGraphic.geometry.x, centerGraphic.geometry.y],
* [edgeGraphic.geometry.x, edgeGraphic.geometry.y]
* ];
*
* // client-side stats query of features that intersect the buffer
* calculateBuffer(vertices);
*
* // user is clicking on the view... call update method with the center and edge graphics
* if (event.state === "complete") {
* sketch.update([edgeGraphic, centerGraphic], { tool: "move" });
* }
* }
*/
update: UpdateEvent;
/**
* Fires in response to undo action during creation of a new graphic or updating existing graphics.
* The undo/redo stack is for an individual sketch operation, meaning you can redo/undo actions while creating or updating a graphic.
*
* @since 4.10
*/
undo: UndoEvent;
/**
* Fires in response to redo action during creation of a new graphic or updating existing graphics.
* The undo/redo stack is for an individual sketch operation, meaning you can redo/undo actions while creating or updating a graphic.
*
* @since 4.10
*/
redo: RedoEvent;
/**
* Fires when a user deletes selected graphics by clicking the `Delete feature` button on the Sketch widget
* or when [Sketch.delete()](https://developers.arcgis.com/javascript/latest/references/core/widgets/Sketch/#delete) method is called.
*
* @since 4.14
* @example
* // selected graphics can be deleted only when update event becomes active
* sketch.on("update", function(event) {
* if (event.state === "active") {
* sketch.delete();
* }
* });
*
* // fires after delete method is called
* // returns references to deleted graphics.
* sketch.on("delete", function(event) {
* event.graphics.forEach(function(graphic){
* console.log("deleted", graphic)
* });
* });
*/
delete: DeleteEvent;
}
/**
* ## Overview
*
* Provides the logic for the [Sketch](https://developers.arcgis.com/javascript/latest/references/core/widgets/Sketch/) widget and [component](https://developers.arcgis.com/javascript/latest/references/map-components/components/arcgis-sketch/). The SketchViewModel is intended to be used with [Graphics](https://developers.arcgis.com/javascript/latest/references/core/Graphic/)
* and requires a [GraphicsLayer](https://developers.arcgis.com/javascript/latest/references/core/layers/GraphicsLayer/) to be specified in its [layer](https://developers.arcgis.com/javascript/latest/references/core/widgets/Sketch/SketchViewModel/#layer) property. The Sketch widget provides out-of-the box functionality with a user interface (UI).
* Therefore, the Sketch widget allows users to not worry about designing and creating their own UI. On the other hand, the SketchViewModel
* is the logic behind the Sketch widget UI, allowing users who utilize this class in their applications to design their own custom
* UI for the draw tools.
*
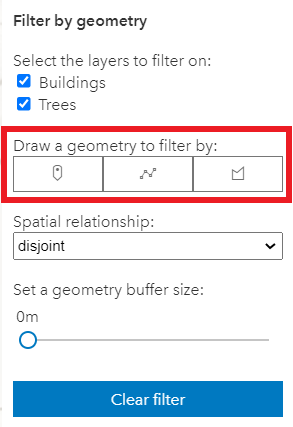
* For example, the sample [Filter SceneLayer with FeatureFilter](https://developers.arcgis.com/javascript/latest/sample-code/layers-scenelayer-feature-masking/) demonstrates
* an example of utilizing the SketchViewModel with a custom UI.
*
* [](https://developers.arcgis.com/javascript/latest/sample-code/layers-scenelayer-feature-masking/)
*
* Additionally, users can pick and choose which draw tools are relevant to their applications. In this example, only the `point`, `polyline`, and `polygon` tools are used.
*
* <span id="gestures"></span>
* ## Pointer and keyboard gestures
*
* <span id="create-graphics"></span>
* Pointer and keyboard gestures for creating graphics with different geometries are described in the tables below.
*
* <details>
* <summary>Read More</summary>
*
* #### General shortcuts
*
* Gesture | Action | Example |
* ---------|---------|---------|
* Z | Incrementally undo actions recorded in the stack. The undo/redo stack is for an individual sketch operation, meaning you can redo/undo actions while creating or updating a graphic. | <img alt="Undo" src="https://developers.arcgis.com/javascript/latest/assets/references/core/widgets/sketch/undo-line.gif" width="400px"> |
* R | Incrementally redo actions recorded in the stack. The undo/redo stack is for an individual sketch operation, meaning you can redo/undo actions while creating or updating a graphic. | <img alt="Redo" src="https://developers.arcgis.com/javascript/latest/assets/references/core/widgets/sketch/redo-line.gif" width="400px"> |
* Ctrl | Toggle snapping dependent on the configuration in [snappingOptions](https://developers.arcgis.com/javascript/latest/references/core/widgets/Sketch/SketchViewModel/#snappingOptions). | <img alt="Ctrl key" src="https://developers.arcgis.com/javascript/latest/assets/references/core/widgets/sketch/ctrl-key-polygon.gif" width="400px"> |
* Tab | While drawing or updating features, activate the tooltips' input mode to enter values or apply constraints. Depends on [tooltipOptions](https://developers.arcgis.com/javascript/latest/references/core/widgets/Sketch/SketchViewModel/#tooltipOptions) configuration. | <img alt="Tab key" src="https://developers.arcgis.com/javascript/latest/assets/references/core/widgets/sketch/tab-key-editing-constraints.gif" width="400px"> |
*
* #### Creating point graphics
*
* Gesture | Action |
* ---------|---------|
* Left-click | Adds a point graphic at the pointer location. |
* Enter | Adds a point graphic at the pointer location. |
*
* #### Creating polyline and polygon graphics
*
* The following keyboard shortcuts apply when creating polyline and polygon graphics.
*
* Gesture | Action | Example |
* ---------|---------|---------|
* Left-click | Adds a vertex at the pointer location. | <img alt="Left-click" src="https://developers.arcgis.com/javascript/latest/assets/references/core/widgets/sketch/left-click-line.gif" width="400px"> |
* Left-drag | Adds a vertex for each pointer move in [hybrid](https://developers.arcgis.com/javascript/latest/references/core/widgets/Sketch/SketchViewModel/#defaultCreateOptions) or [freehand](https://developers.arcgis.com/javascript/latest/references/core/widgets/Sketch/SketchViewModel/#defaultCreateOptions) mode. | <img alt="Left drag" src="https://developers.arcgis.com/javascript/latest/assets/references/core/widgets/sketch/left-drag-line.gif" width="400px"> |
* F | Adds a vertex to the `polyline` or `polygon` graphic. Completes the `rectangle` or `circle` polygon graphic in [click](https://developers.arcgis.com/javascript/latest/references/core/widgets/Sketch/SketchViewModel/#defaultCreateOptions) mode. | <img alt="F vertex add" src="https://developers.arcgis.com/javascript/latest/assets/references/core/widgets/sketch/f-key-line.gif" width="400px"> |
* Enter | Completes the `polyline` or `polygon` graphic without the staged vertex. A `double-click` will complete the graphic at the current mouse cursor's position. | <img alt="Enter" src="https://developers.arcgis.com/javascript/latest/assets/references/core/widgets/sketch/enter-line.gif" width="400px"> |
* Spacebar+Left-drag | Pan the view while creating a polyline or polygon graphic. | <img alt="Space left drag" src="https://developers.arcgis.com/javascript/latest/assets/references/core/widgets/sketch/space-left-drag.gif" width="400px"> |
* Left-click on the first vertex | Completes the polygon graphic sketch. | <img alt="Left-click first vertex" src="https://developers.arcgis.com/javascript/latest/assets/references/core/widgets/sketch/left-click-vertex.gif" width="400px"> |
*
* #### Creating polygon graphics with predefined shapes
*
* The following keyboard shortcuts apply when creating polygon graphics with predefined shapes (`rectangle` and `circle`).
*
* Gesture | Action | Example |
* ------- | ------ |---------|
* Left-click+Drag | Creates a `rectangle` graphic with dimensions based on the bounding box between initial click and cursor location. Creates a `circle` graphic with radius based on the distance between initial click and cursor location. | <img alt="Polygon Left-click drag" src="https://developers.arcgis.com/javascript/latest/assets/references/core/widgets/sketch/polygon-left-click-drag.gif" width="400px"> |
* Shift+Left-click+Drag | Changes the shape from a `rectangle` to a `square` or from a `circle` to an `ellipse`. | <img alt="Shift Left-click drag" src="https://developers.arcgis.com/javascript/latest/assets/references/core/widgets/sketch/shift-left-click-drag.gif" width="400px"> |
* Alt+Left-click+Drag | Creates a `rectangle` graphic with a center at initial click, and dimensions based on the distance between the initial click to the cursor location. Creates a `circle` graphic with a radius based on the bounding box between the initial click and the cursor location. | <img alt="Alt Left-click drag" src="https://developers.arcgis.com/javascript/latest/assets/references/core/widgets/sketch/alt-left-click-drag.gif" width="400px"> |
* Shift+Alt+Left-click+Drag | Combines the behavior described above. | <img alt="Shift Alt Left-click drag" src="https://developers.arcgis.com/javascript/latest/assets/references/core/widgets/sketch/shift-alt-left-click-drag.gif" width="400px"> |
*
* <span id="update-graphics"></span>
* #### Updating graphics
*
* The Sketch widget provides users with the ability to move, rotate, scale or reshape graphics during an update operation.
* To begin updating, `Left-click` on a graphic. Use `Shift+Left-click` to add more graphics to the selection, for bulk updating.
* Once graphics are selected, the following actions can be performed.
*
* Gesture | Action | Example |
* ---------|---------|----------|
* Left-click on a graphic | Select a graphic to move, rotate or scale. | <img alt="Select a graphic" src="https://developers.arcgis.com/javascript/latest/assets/references/core/widgets/sketch/sketch-box-mode.gif" width="400px"> |
* Shift+Left-click graphics | Select multiple graphics to move, rotate or scale.| <img alt="Select graphics" src="https://developers.arcgis.com/javascript/latest/assets/references/core/widgets/sketch/sketch-graphics.gif" width="400px"> |
* Drag graphic | Move the selected graphic.| <img alt="Drag the graphic" src="https://developers.arcgis.com/javascript/latest/assets/references/core/widgets/sketch/sketch-box-move.gif" width="400px"> |
* Drag rotate handle | Rotate the selected graphic.| <img alt="Rotate the graphic" src="https://developers.arcgis.com/javascript/latest/assets/references/core/widgets/sketch/sketch-rotate.gif" width="400px"> |
* Drag scale handle | Scale the selected graphic.| <img alt="Scale the graphic" src="https://developers.arcgis.com/javascript/latest/assets/references/core/widgets/sketch/sketch-scale.gif" width="400px"> |
* Shift+Left-click+Drag scale handle | Scale the selected graphic at the center. | <img alt="Scale the graphic at the center" src="https://developers.arcgis.com/javascript/latest/assets/references/core/widgets/sketch/scale-shift-left-click-drag.gif" width="400px"> |
* Z | Incrementally undo actions recorded in the stack. The undo/redo stack is for an individual sketch operation, meaning you can redo/undo actions while creating or updating a graphic. | <img alt="Undo update" src="https://developers.arcgis.com/javascript/latest/assets/references/core/widgets/sketch/sketch-update-undo.gif" width="400px"> |
* R | Incrementally redo actions recorded in the stack. The undo/redo stack is for an individual sketch operation, meaning you can redo/undo actions while creating or updating a graphic. | <img alt="Redo update" src="https://developers.arcgis.com/javascript/latest/assets/references/core/widgets/sketch/sketch-update-redo.gif" width="400px"> |
* Left-click on view (not the graphic) | Complete the graphic update. | <img alt="Sketch update complete" src="https://developers.arcgis.com/javascript/latest/assets/references/core/widgets/sketch/sketch-update-complete.gif" width="400px"> |
* Press `Delete` key | Remove the selected graphic(s) from the [layer](https://developers.arcgis.com/javascript/latest/references/core/widgets/Sketch/SketchViewModel/#layer). | <img alt="Sketch delete graphic" src="https://developers.arcgis.com/javascript/latest/assets/references/core/widgets/sketch/sketch-delete-graphic.gif" width="400px">
*
* The following update operations can be performed on a single polyline or polygon graphic:
*
* Gesture | Action | Example |
* ---------|---------|----------|
* Left-click on a graphic | Select a graphic to move or reshape.| <img alt="Select a graphic" src="https://developers.arcgis.com/javascript/latest/assets/references/core/widgets/sketch/sketch-reshape-mode.gif" width="400px"> |
* Drag graphic | Move the selected graphic.| <img alt="Drag the graphic" src="https://developers.arcgis.com/javascript/latest/assets/references/core/widgets/sketch/sketch-drag.gif" width="400px"> |
* Left-click on a ghost vertex| Add a new vertex. | <img alt="Add a vertex" src="https://developers.arcgis.com/javascript/latest/assets/references/core/widgets/sketch/sketch-add-vertices.gif" width="400px"> |
* Left-click on a vertex| Select a vertex. | <img alt="Select a vertex" src="https://developers.arcgis.com/javascript/latest/assets/references/core/widgets/sketch/sketch-selectvertex.gif" width="400px"> |
* Shift+Left-click on vertices | Select or unselect multiple vertices. | <img alt="Select vertices" src="https://developers.arcgis.com/javascript/latest/assets/references/core/widgets/sketch/sketch-selectvertices.gif" width="400px"> |
* Drag vertex | Move the selected vertex or vertices. | <img alt="Drag vertices" src="https://developers.arcgis.com/javascript/latest/assets/references/core/widgets/sketch/sketch-dragvertices.gif" width="400px"> |
* Right-click on a vertex | Delete a vertex. | <img alt="Delete a vertex" src="https://developers.arcgis.com/javascript/latest/assets/references/core/widgets/sketch/sketch-delete-vertex.gif" width="400px"> |
* Select multiple vertices and press `Backspace` or `Delete` key | Delete multiple vertices. | <img alt="Delete vertices" src="https://developers.arcgis.com/javascript/latest/assets/references/core/widgets/sketch/sketch-delete-vertices.gif" width="400px"> |
*
* <span id="point-transform-tool"></span>
*
* The following update operations can be performed on a single graphic with point geometry in a [SceneView](https://developers.arcgis.com/javascript/latest/references/core/views/SceneView/), if the graphic uses a [3D object symbol layer](https://developers.arcgis.com/javascript/latest/references/core/symbols/ObjectSymbol3DLayer/):
*
* Gesture | Action | Example |
* ---------|---------|----------|
* Left-click on a graphic | Select a graphic to move, rotate or scale. | <img alt="Select a graphic" src="https://developers.arcgis.com/javascript/latest/assets/references/core/widgets/sketch/sketch-update-point-3D.gif" width="400px"> |
* Drag inner handle | Move the selected graphic.| <img alt="Drag the graphic" src="https://developers.arcgis.com/javascript/latest/assets/references/core/widgets/sketch/sketch-transform-move-point.gif" width="400px"> |
* Drag height handle | Move the selected graphic vertically (on the z axis).| <img alt="Drag the graphic" src="https://developers.arcgis.com/javascript/latest/assets/references/core/widgets/sketch/sketch-transform-movez-point.gif" width="400px"> |
* Drag outer handle sideways | Rotate the selected graphic.| <img alt="Rotate the graphic" src="https://developers.arcgis.com/javascript/latest/assets/references/core/widgets/sketch/sketch-transform-rotate-point.gif" width="400px"> |
* Drag outer handle inwards or outwards | Scale the selected graphic.| <img alt="Scale the graphic" src="https://developers.arcgis.com/javascript/latest/assets/references/core/widgets/sketch/sketch-transform-scale-point.gif" width="400px"> |
*
* </details>
*
* ## Overriding Symbology
*
* The SketchViewModel also allows users to override the default symbology for [polyline](https://developers.arcgis.com/javascript/latest/references/core/widgets/Sketch/SketchViewModel/#polylineSymbol), [polygon](https://developers.arcgis.com/javascript/latest/references/core/widgets/Sketch/SketchViewModel/#polygonSymbol), [point`, and `multipoint](https://developers.arcgis.com/javascript/latest/references/core/widgets/Sketch/SketchViewModel/#pointSymbol) graphics.
* The following code snippet demonstrates an example of utilizing [TextSymbols](https://developers.arcgis.com/javascript/latest/references/core/symbols/TextSymbol/) to override the default point graphic symbology.
*
* ```js
* // Create a text symbol for drawing the point
* const textKeySymbol = {
* type: "text", // autocasts as new TextSymbol()
* color: "#7a003c",
* text: "\ue656", // esri-icon-key
* font: {
* // autocasts as new Font()
* size: 20,
* family: "CalciteWebCoreIcons"
* }
* };
*
* const sketchViewModel = new SketchViewModel({
* view: view,
* layer: graphicsLayer,
* pointSymbol: textKeySymbol
* });
* ```
*
* The example above overrides the default symbology of a point graphic with a key icon, using the font [`CalciteWebCoreIcons`](https://developers.arcgis.com/javascript/latest/esri-icon-font/#using-the-esri-icon-fonts-as-a-graphics-symbol).
*
* It is now possible to also override the default drawing symbology while actively creating a new graphic using [pointSymbol](https://developers.arcgis.com/javascript/latest/references/core/widgets/Sketch/SketchViewModel/#pointSymbol), [polylineSymbol](https://developers.arcgis.com/javascript/latest/references/core/widgets/Sketch/SketchViewModel/#polylineSymbol), and [polygonSymbol](https://developers.arcgis.com/javascript/latest/references/core/widgets/Sketch/SketchViewModel/#polygonSymbol).
* In earlier versions, setting these properties would only override the graphic symbology after completing the draw operation. The [activeFillSymbol](https://developers.arcgis.com/javascript/latest/references/core/widgets/Sketch/SketchViewModel/#activeFillSymbol) property allowed users to override the default drawing symbol in order to match the final `polygonSymbol`.
* This was needed for users to see what the final graphic symbol would look like while actively drawing. Setting the `pointSymbol`, `polylineSymbol`, and `polygonSymbol` now allows users to see what the final graphic symbol will look like while still actively drawing a graphic. The image below demonstrates the behavior when setting the `polygonSymbol`.
*
* 
*
* The following is the code snippet used in the example above.
*
* ```js
* const polygonSymbol = {
* type: "simple-fill", // autocasts as new SimpleFillSymbol()
* color: "#f2bc94",
* outline: {
* // autocasts as new SimpleLineSymbol()
* color: "#722620",
* width: 3
* }
* };
*
* const sketchViewModel = new SketchViewModel({
* view: view,
* layer: graphicsLayer,
* polygonSymbol: polygonSymbol,
* });
* ```
*
* ## Sketch 3D
*
* To be able to manipulate features on the z-axis using the height handle, the following configurations are relevant:
* - [Elevation info mode](https://developers.arcgis.com/javascript/latest/references/core/layers/GraphicsLayer/#elevationInfo) of the
* [GraphicsLayer](https://developers.arcgis.com/javascript/latest/references/core/layers/GraphicsLayer/) needs to be set to `absolute-height`, `relative-to-scene`or `relative-to-ground`.
* - To create a graphic with z-value the `hasZ` needs to be `true` in [defaultCreateOptions](https://developers.arcgis.com/javascript/latest/references/core/widgets/Sketch/SketchViewModel/#defaultCreateOptions) and/or in the [createOptions](https://developers.arcgis.com/javascript/latest/references/core/widgets/Sketch/SketchViewModel/#create).
* - To update the z-value of a graphic the `enableZ` needs to be `true` in [defaultUpdateOptions](https://developers.arcgis.com/javascript/latest/references/core/widgets/Sketch/SketchViewModel/#defaultUpdateOptions) and/or in the [updateOptions](https://developers.arcgis.com/javascript/latest/references/core/widgets/Sketch/SketchViewModel/#update).
*
* ```js
* // define the GraphicsLayer
* const gLayer = new GraphicsLayer({
* elevationInfo: {
* mode: "absolute-height" // default value
* }
* });
*
* // define the SketchViewModel
* const sketchVM = new SketchViewModel({
* layer: gLayer,
* view: view,
* defaultCreateOptions: {
* hasZ: true // default value
* },
* defaultUpdateOptions: {
* enableZ: true // default value
* }
* });
* ```
*
* In `absolute-height` elevation mode, the sketched vertices snap to scene elements (features and ground).
* See [elevation info](https://developers.arcgis.com/javascript/latest/references/core/layers/GraphicsLayer/#elevationInfo) for more information on how z-values are used with different elevation modes.
*
* When sketching polygons or polylines, the elevation constraint is applied by default. This means that all vertices use the
* z-value of the first vertex. To unlock the elevation constraint while sketching, make sure the
* [tooltips](https://developers.arcgis.com/javascript/latest/references/core/widgets/Sketch/SketchViewModel/#tooltipOptions) and their
* [inputs](https://developers.arcgis.com/javascript/latest/references/core/views/interactive/sketch/SketchTooltipOptions/#inputEnabled) are enabled,
* and activate the input mode with the `Tab` key.\
* Note that in elevation modes other than `absolute-height`, this means that the z-values are fixed but the graphic may appear non-planar.
*
* See more about available tooltip inputs and constraints under the [tooltip options](https://developers.arcgis.com/javascript/latest/references/core/views/interactive/sketch/SketchTooltipOptions/) class.
*
* > [!WARNING]
* >
* > **Known Limitation**
* >
* > Multipoint geometry can only be created in a [MapView](https://developers.arcgis.com/javascript/latest/references/core/views/MapView/).
*
* @since 4.5
* @see [Sketch](https://developers.arcgis.com/javascript/latest/references/core/widgets/Sketch/) widget
* @see [Sketch component](https://developers.arcgis.com/javascript/latest/references/map-components/components/arcgis-sketch/)
* @see [SketchLabelOptions](https://developers.arcgis.com/javascript/latest/references/core/views/interactive/sketch/SketchLabelOptions/)
* @see [SketchTooltipOptions](https://developers.arcgis.com/javascript/latest/references/core/views/interactive/sketch/SketchTooltipOptions/)
* @see [SketchValueOptions](https://developers.arcgis.com/javascript/latest/references/core/views/interactive/sketch/SketchValueOptions/)
* @see [SnappingOptions](https://developers.arcgis.com/javascript/latest/references/core/views/interactive/snapping/SnappingOptions/)
* @see [Sample - Sketch temporary geometries](https://developers.arcgis.com/javascript/latest/sample-code/sketch-geometries/)
* @see [Sample - Sketch update validation](https://developers.arcgis.com/javascript/latest/sample-code/sketch-update-validation/)
* @see [Sample - Query statistics by geometry](https://developers.arcgis.com/javascript/latest/sample-code/featurelayerview-query-geometry/)
* @see [Sample - Filter SceneLayer with FeatureFilter](https://developers.arcgis.com/javascript/latest/sample-code/layers-scenelayer-feature-masking/)
* @see [Sample - Sketch in 3D](https://developers.arcgis.com/javascript/latest/sample-code/sketch-3d/)
* @see [Programming patterns: Widget viewModel pattern](https://developers.arcgis.com/javascript/latest/programming-patterns/#widget-viewmodel-pattern)
* @example
* // Create a new SketchViewModel and set its required parameters
* let sketchVM = new SketchViewModel({
* layer: tempGraphicsLayer,
* view: view
* });
*
* // Listen to sketchViewModel's create event.
* sketchVM.on("create", function(event) {
* // check if the create event's state has changed to complete indicating
* // the graphic create operation is completed.
* if (event.state === "complete") {
* // remove the graphic from the layer. Sketch adds
* // the completed graphic to the layer by default.
* polygonGraphicsLayer.remove(event.graphic);
*
* // use the graphic.geometry to query features that intersect it
* selectFeatures(event.graphic.geometry);
* }
* });
*/
export default class SketchViewModel extends EventedAccessor {
/**
* @deprecated
* Do not directly reference this property.
* Use EventNames and EventTypes helpers from \@arcgis/core/Evented
*/
"@eventTypes": SketchViewModelEvents;
/**
* @example
* // Typical usage
* let sketch = new SketchViewModel({
* view: view,
* layer: graphicsLayer
* });
*/
constructor(properties?: SketchViewModelProperties);
/**
* When creating new graphics (for example after [create()](https://developers.arcgis.com/javascript/latest/references/core/widgets/Sketch/SketchViewModel/#create) has been called),
* this property reflects the drawing mode being used.
* If no update operation is in progress, this is `null`.
*
* @since 4.32
*/
get activeCreateToolDrawMode(): "freehand" | "hybrid" | "click" | null | undefined;
/**
* The [SimpleFillSymbol](https://developers.arcgis.com/javascript/latest/references/core/symbols/SimpleFillSymbol/) displayed when actively creating a new `polygon` graphic using the [polygon](https://developers.arcgis.com/javascript/latest/references/core/widgets/Sketch/SketchViewModel/#activeTool) tool.
*
* > [!WARNING]
* >
* > **Known Limitation**
* > Not supported in 3D [SceneViews](https://developers.arcgis.com/javascript/latest/references/core/views/SceneView/).
* > To avoid unintended side effects, instantiate a new symbol rather than modifying the current instance.
*
* The default value is the following:
* ```js
* {
* type: "simple-fill",
* style: "solid",
* color: [150, 150, 150, 0.2],
* outline: {
* color: [50, 50, 50],
* width: 0
* }
* }
* ```
*
* @since 4.20
*/
get activeFillSymbol(): SimpleFillSymbol | CIMSymbol | null | undefined;
set activeFillSymbol(value: (SimpleFillSymbolProperties & { type: "simple-fill" }) | (CIMSymbolProperties & { type: "cim" }) | null | undefined);
/**
* When creating new graphics (for example after [create()](https://developers.arcgis.com/javascript/latest/references/core/widgets/Sketch/SketchViewModel/#create) has been called),
* this property reflects the create tool being used. When updating graphics
* (for example after [update()](https://developers.arcgis.com/javascript/latest/references/core/widgets/Sketch/SketchViewModel/#update) has been called), this property reflects the
* update tool being used. If no create or update operation is in progress, this is `null`.
*
* @since 4.10
*/
get activeTool(): SketchTool | null;
/**
* The tooltip currently being displayed for the [activeTool](https://developers.arcgis.com/javascript/latest/references/core/widgets/Sketch/SketchViewModel/#activeTool).
*
* @since 4.31
*/
get activeTooltip(): Tooltip | null;
/**
* The graphic that is being created.
*
* @since 4.10
*/
get createGraphic(): Graphic | null | undefined;
/**
* Defines the default behavior once the [create()](https://developers.arcgis.com/javascript/latest/references/core/widgets/Sketch/SketchViewModel/#create) operation is completed. By default, the creation operation will end.
* When set to update or continuous, the creation operation will either select the created feature for update, or immediately
* start a new create operation. In either case, the automatic behavior will be interrupted if `create`, `update`, or `cancel`
* is called while handling the [@create](https://developers.arcgis.com/javascript/latest/references/core/widgets/Sketch/SketchViewModel/#event-create) event.
*
* **Possible Values**
*
* Value | Description |
* ----- | ----------- |
* continuous | After completion, immediately starts a new creation step with the same options as before.
* single | After creation, no further action is taken.
* update | After creation, the graphic is immediately selected for an [update()](https://developers.arcgis.com/javascript/latest/references/core/widgets/Sketch/SketchViewModel/#update) operation.
*
* @default "single"
* @since 4.32
*/
accessor creationMode: CreationMode;
/**
* Default create options set for the SketchViewModel.
*
* @since 4.14
*/
get defaultCreateOptions(): CreateOptions;
set defaultCreateOptions(value: Partial<CreateOptions>);
/**
* Default update options set for the SketchViewModel. Update options set on this property will be overridden by options passed to
* the [update()](https://developers.arcgis.com/javascript/latest/references/core/widgets/Sketch/SketchViewModel/#update) method.
*
* @since 4.10
* @example
* // Turn off highlights for update operations
* const svm = new SketchViewModel({
* view,
* defaultUpdateOptions: {
* highlightOptions: {
* enabled: false
* }
* }
* });
* // Turn off highlights from the update() method
* const updateOptions = { tool: "reshape", highlightOptions: { enabled: false }};
* svm.update(graphic, updateOptions);
*/
get defaultUpdateOptions(): UpdateOptions;
set defaultUpdateOptions(value: Partial<UpdateOptions>);
/**
* Use this property to determine if the next generation geometry creation
* has been disabled. This can happen when
* [useLegacyCreateTools](https://developers.arcgis.com/javascript/latest/references/core/widgets/Sketch/SketchViewModel/#useLegacyCreateTools) is true,
* or `SketchViewModel` is used with a non-2D (`arcgis-map`) view.
*
* @deprecated
* @since 5.0
*/
get isUsingLegacyCreateTools(): boolean;
/**
* Options to configure the sketch labels shown next to each segment of the geometry being created or updated.
*
* > [!WARNING]
* >
* > **Known Limitation**
* >
* > Sketch labels are currently only supported when working with a [SceneView](https://developers.arcgis.com/javascript/latest/references/core/views/SceneView/).
*
* @since 4.24
*/
get labelOptions(): SketchLabelOptions;
set labelOptions(value: SketchLabelOptionsProperties);
/**
* The [GraphicsLayer](https://developers.arcgis.com/javascript/latest/references/core/layers/GraphicsLayer/) or [MapNotesLayer](https://developers.arcgis.com/javascript/latest/references/core/layers/MapNotesLayer/) associated with the SketchViewModel.
* The SketchViewModel adds new [graphics](https://developers.arcgis.com/javascript/latest/references/core/Graphic/) to this layer or can only update graphics stored in this layer.
*
* @since 4.6
*/
accessor layer: GraphicsLayer | MapNotesLayer | null | undefined;
/**
* A [SimpleMarkerSymbol](https://developers.arcgis.com/javascript/latest/references/core/symbols/SimpleMarkerSymbol/), [PictureMarkerSymbol](https://developers.arcgis.com/javascript/latest/references/core/symbols/PictureMarkerSymbol/), [PointSymbol3D](https://developers.arcgis.com/javascript/latest/references/core/symbols/PointSymbol3D/), [TextSymbol](https://developers.arcgis.com/javascript/latest/references/core/symbols/TextSymbol/), [CIMSymbol](https://developers.arcgis.com/javascript/latest/references/core/symbols/CIMSymbol/), or [WebStyleSymbol](https://developers.arcgis.com/javascript/latest/references/core/symbols/WebStyleSymbol/) used for representing the point geometry that is being drawn. [SimpleMarkerSymbol](https://developers.arcgis.com/javascript/latest/references/core/symbols/SimpleMarkerSymbol/) may also be used to symbolize point features in a [SceneView](https://developers.arcgis.com/javascript/latest/references/core/views/SceneView/). However, it is recommended you use [PointSymbol3D](https://developers.arcgis.com/javascript/latest/references/core/symbols/PointSymbol3D/) instead.
*
* > [!WARNING]
* >
* > **Known Limitation**
* > To avoid unintended side effects, instantiate a new symbol rather than modifying the current instance.
*
* The default value is the following:
* ```js
* {
* type: "simple-marker",
* style: "circle",
* size: 6,
* color: [255, 255, 255],
* outline: {
* color: [50, 50, 50],
* width: 1
* }
* }
* ```
*/
get pointSymbol(): SketchPointSymbol;
set pointSymbol(value: ((SimpleMarkerSymbolProperties & { type: "simple-marker" }) | (PictureMarkerSymbolProperties & { type: "picture-marker" }) | (PointSymbol3DProperties & { type: "point-3d" }) | (TextSymbolProperties & { type: "text" }) | (CIMSymbolProperties & { type: "cim" }) | (WebStyleSymbolProperties & { type: "web-style" })));
/**
* A [SimpleFillSymbol](https://developers.arcgis.com/javascript/latest/references/core/symbols/SimpleFillSymbol/), [PolygonSymbol3D](https://developers.arcgis.com/javascript/latest/references/core/symbols/PolygonSymbol3D/), or [CIMSymbol](https://developers.arcgis.com/javascript/latest/references/core/symbols/CIMSymbol/) used for representing the polygon geometry that is being drawn. [SimpleFillSymbol](https://developers.arcgis.com/javascript/latest/references/core/symbols/SimpleFillSymbol/) may also be used to symbolize polygon features in a [SceneView](https://developers.arcgis.com/javascript/latest/references/core/views/SceneView/). However, it is recommended you use [PolygonSymbol3D](https://developers.arcgis.com/javascript/latest/references/core/symbols/PolygonSymbol3D/) instead.
*
* > [!WARNING]
* >
* > **Known Limitation**
* > To avoid unintended side effects, instantiate a new symbol rather than modifying the current instance.
*
* The default value is the following:
* ```js
* {
* type: "simple-fill",
* color: [150, 150, 150, 0.2],
* outline: {
* color: [50, 50, 50],
* width: 2
* }
* }
* ```
*/
get polygonSymbol(): SketchPolygonSymbol;
set polygonSymbol(value: ((SimpleFillSymbolProperties & { type: "simple-fill" }) | (PolygonSymbol3DProperties & { type: "polygon-3d" }) | (CIMSymbolProperties & { type: "cim" })));
/**
* A [SimpleLineSymbol](https://developers.arcgis.com/javascript/latest/references/core/symbols/SimpleLineSymbol/), [LineSymbol3D](https://developers.arcgis.com/javascript/latest/references/core/symbols/LineSymbol3D/), or [CIMSymbol](https://developers.arcgis.com/javascript/latest/references/core/symbols/CIMSymbol/) used for representing the polyline geometry that is being drawn. [SimpleLineSymbol](https://developers.arcgis.com/javascript/latest/references/core/symbols/SimpleLineSymbol/) may also be used to symbolize polyline features in a [SceneView](https://developers.arcgis.com/javascript/latest/references/core/views/SceneView/). However, it is recommended you use [LineSymbol3D](https://developers.arcgis.com/javascript/latest/references/core/symbols/LineSymbol3D/) instead.
*
* > [!WARNING]
* >
* > **Known Limitation**
* > To avoid unintended side effects, instantiate a new symbol rather than modifying the current instance.
*
* The default value is the following:
* ```js
* {
* type: "simple-line",
* color: [130, 130, 130],
* width: 2
* }
* ```
*/
get polylineSymbol(): SketchPolylineSymbol;
set polylineSymbol(value: ((SimpleLineSymbolProperties & { type: "simple-line" }) | (LineSymbol3DProperties & { type: "line-3d" }) | (CIMSymbolProperties & { type: "cim" })));
/**
* The [SnappingOptions](https://developers.arcgis.com/javascript/latest/references/core/views/interactive/snapping/SnappingOptions/) for sketching. It supports [self](https://developers.arcgis.com/javascript/latest/references/core/views/interactive/snapping/SnappingOptions/#selfEnabled) and [feature](https://developers.arcgis.com/javascript/latest/references/core/views/interactive/snapping/SnappingOptions/#featureEnabled) snapping.
*
* @since 4.18
*/
get snappingOptions(): SnappingOptions;
set snappingOptions(value: SnappingOptionsProperties);
/**
* The sketch view model's state.
*
* @default "disabled"
*/
get state(): State;
/** A [TextSymbol](https://developers.arcgis.com/javascript/latest/references/core/symbols/TextSymbol/) used when creating features with the 'text' tool. */
get textSymbol(): TextSymbol;
set textSymbol(value: TextSymbolProperties & { type: "text"; });
/**
* Options to configure the tooltip shown next to the cursor when creating or updating graphics.
*
* @since 4.24
*/
get tooltipOptions(): SketchTooltipOptions;
set tooltipOptions(value: SketchTooltipOptionsProperties);
/**
* An array of graphics that are being updated by th