@arcgis/core
Version:
ArcGIS Maps SDK for JavaScript: A complete 2D and 3D mapping and data visualization API
746 lines (743 loc) • 54.8 kB
TypeScript
import type Graphic from "../Graphic.js";
import type Collection from "../core/Collection.js";
import type GraphicsLayer from "../layers/GraphicsLayer.js";
import type MapNotesLayer from "../layers/MapNotesLayer.js";
import type TextSymbol from "../symbols/TextSymbol.js";
import type SketchLabelOptions from "../views/interactive/sketch/SketchLabelOptions.js";
import type SketchTooltipOptions from "../views/interactive/sketch/SketchTooltipOptions.js";
import type SketchValueOptions from "../views/interactive/sketch/SketchValueOptions.js";
import type SnappingOptions from "../views/interactive/snapping/SnappingOptions.js";
import type Widget from "./Widget.js";
import type SketchViewModel from "./Sketch/SketchViewModel.js";
import type VisibleElements from "./Sketch/VisibleElements.js";
import type { Icon } from "@esri/calcite-components/components/calcite-icon";
import type { TextSymbolProperties } from "../symbols/TextSymbol.js";
import type { MapViewOrSceneView } from "../views/MapViewOrSceneView.js";
import type { SketchLabelOptionsProperties } from "../views/interactive/sketch/SketchLabelOptions.js";
import type { SketchTooltipOptionsProperties } from "../views/interactive/sketch/SketchTooltipOptions.js";
import type { SketchValueOptionsProperties } from "../views/interactive/sketch/SketchValueOptions.js";
import type { SnappingOptionsProperties } from "../views/interactive/snapping/SnappingOptions.js";
import type { WidgetProperties } from "./Widget.js";
import type { SketchViewModelEvents, SketchViewModelProperties } from "./Sketch/SketchViewModel.js";
import type { CreateOptions, CreateTool, CreationMode, Layout, SelectionTool, SketchPointSymbol, SketchPolygonSymbol, SketchPolylineSymbol, SketchTool, State, ToolbarKind, UpdateOptions } from "./Sketch/types.js";
import type { WebStyleSymbolProperties } from "../symbols/WebStyleSymbol.js";
import type { CIMSymbolProperties } from "../symbols/CIMSymbol.js";
import type { PointSymbol3DProperties } from "../symbols/PointSymbol3D.js";
import type { PictureMarkerSymbolProperties } from "../symbols/PictureMarkerSymbol.js";
import type { SimpleMarkerSymbolProperties } from "../symbols/SimpleMarkerSymbol.js";
import type { PolygonSymbol3DProperties } from "../symbols/PolygonSymbol3D.js";
import type { SimpleFillSymbolProperties } from "../symbols/SimpleFillSymbol.js";
import type { LineSymbol3DProperties } from "../symbols/LineSymbol3D.js";
import type { SimpleLineSymbolProperties } from "../symbols/SimpleLineSymbol.js";
import type { VisibleElementsProperties } from "./Sketch/VisibleElements.js";
export interface SketchProperties extends WidgetProperties, Partial<Pick<Sketch, "availableCreateTools" | "creationMode" | "layer" | "layout" | "scale" | "toolbarKind" | "useLegacyCreateTools" | "view">> {
/**
* Default create options set for the Sketch widget.
*
* @since 4.14
*/
defaultCreateOptions?: Partial<CreateOptions>;
/**
* Default update options set for the Sketch widget. Update options set on this property will be overwritten if the update options are changed
* when [update()](https://developers.arcgis.com/javascript/latest/references/core/widgets/Sketch/#update) method is called.
*
* @since 4.11
* @example
* // Turn off highlights for update operations
* const sketch = new Sketch({
* view,
* defaultUpdateOptions: {
* highlightOptions: {
* enabled: false
* }
* }
* });
* // Turn off highlights from the update() method
* const updateOptions = { tool: "reshape", highlightOptions: { enabled: false }};
* sketch.update(graphic, updateOptions);
*/
defaultUpdateOptions?: Partial<UpdateOptions>;
/**
* Icon which represents the widget. It is typically used when the widget is controlled by another
* one (e.g. in the Expand widget).
*
* @default "pencil"
* @since 4.27
* @see [Calcite Icon Search](https://developers.arcgis.com/calcite-design-system/icons/)
* @see [Calcite Icon Search](https://developers.arcgis.com/calcite-design-system/icons/)
*/
icon?: Icon["icon"] | null;
/**
* The Sketch widget's default label.
*
* @since 4.11
*/
label?: string | null;
/**
* Options to configure the sketch labels shown next to each segment of the geometry being created or updated.
*
* > [!WARNING]
* >
* > **Known Limitation**
* >
* > Sketch labels are currently only supported when working with a [SceneView](https://developers.arcgis.com/javascript/latest/references/core/views/SceneView/).
*
* @since 4.24
*/
labelOptions?: SketchLabelOptionsProperties;
/**
* A [SimpleMarkerSymbol](https://developers.arcgis.com/javascript/latest/references/core/symbols/SimpleMarkerSymbol/), [PictureMarkerSymbol](https://developers.arcgis.com/javascript/latest/references/core/symbols/PictureMarkerSymbol/), [PointSymbol3D](https://developers.arcgis.com/javascript/latest/references/core/symbols/PointSymbol3D/), [TextSymbol](https://developers.arcgis.com/javascript/latest/references/core/symbols/TextSymbol/), [CIMSymbol](https://developers.arcgis.com/javascript/latest/references/core/symbols/CIMSymbol/), or [WebStyleSymbol](https://developers.arcgis.com/javascript/latest/references/core/symbols/WebStyleSymbol/) used for representing the point geometry that is being drawn. [SimpleMarkerSymbol](https://developers.arcgis.com/javascript/latest/references/core/symbols/SimpleMarkerSymbol/) may also be used to symbolize point features in a [SceneView](https://developers.arcgis.com/javascript/latest/references/core/views/SceneView/). However, it is recommended you use [PointSymbol3D](https://developers.arcgis.com/javascript/latest/references/core/symbols/PointSymbol3D/) instead.
*
* > [!WARNING]
* >
* > **Known Limitation**
* > To avoid unintended side effects, instantiate a new symbol rather than modifying the current instance.
*
* The default value is the following:
* ```js
* {
* type: "simple-marker",
* style: "circle",
* size: 6,
* color: [255, 255, 255],
* outline: {
* color: [50, 50, 50],
* width: 1
* }
* }
* ```
*/
pointSymbol?: ((SimpleMarkerSymbolProperties & { type: "simple-marker" }) | (PictureMarkerSymbolProperties & { type: "picture-marker" }) | (PointSymbol3DProperties & { type: "point-3d" }) | (TextSymbolProperties & { type: "text" }) | (CIMSymbolProperties & { type: "cim" }) | (WebStyleSymbolProperties & { type: "web-style" }));
/**
* A [SimpleFillSymbol](https://developers.arcgis.com/javascript/latest/references/core/symbols/SimpleFillSymbol/), [PolygonSymbol3D](https://developers.arcgis.com/javascript/latest/references/core/symbols/PolygonSymbol3D/), or [CIMSymbol](https://developers.arcgis.com/javascript/latest/references/core/symbols/CIMSymbol/) used for representing the polygon geometry that is being drawn. [SimpleFillSymbol](https://developers.arcgis.com/javascript/latest/references/core/symbols/SimpleFillSymbol/) may also be used to symbolize polygon features in a [SceneView](https://developers.arcgis.com/javascript/latest/references/core/views/SceneView/). However, it is recommended you use [PolygonSymbol3D](https://developers.arcgis.com/javascript/latest/references/core/symbols/PolygonSymbol3D/) instead.
*
* > [!WARNING]
* >
* > **Known Limitation**
* > To avoid unintended side effects, instantiate a new symbol rather than modifying the current instance.
*
* The default value is the following:
* ```js
* {
* type: "simple-fill",
* color: [150, 150, 150, 0.2],
* outline: {
* color: [50, 50, 50],
* width: 2
* }
* }
* ```
*/
polygonSymbol?: ((SimpleFillSymbolProperties & { type: "simple-fill" }) | (PolygonSymbol3DProperties & { type: "polygon-3d" }) | (CIMSymbolProperties & { type: "cim" }));
/**
* A [SimpleLineSymbol](https://developers.arcgis.com/javascript/latest/references/core/symbols/SimpleLineSymbol/), [LineSymbol3D](https://developers.arcgis.com/javascript/latest/references/core/symbols/LineSymbol3D/), or [CIMSymbol](https://developers.arcgis.com/javascript/latest/references/core/symbols/CIMSymbol/) used for representing the polyline geometry that is being drawn. [SimpleLineSymbol](https://developers.arcgis.com/javascript/latest/references/core/symbols/SimpleLineSymbol/) may also be used to symbolize polyline features in a [SceneView](https://developers.arcgis.com/javascript/latest/references/core/views/SceneView/). However, it is recommended you use [LineSymbol3D](https://developers.arcgis.com/javascript/latest/references/core/symbols/LineSymbol3D/) instead.
*
* > [!WARNING]
* >
* > **Known Limitation**
* > To avoid unintended side effects, instantiate a new symbol rather than modifying the current instance.
*
* The default value is the following:
* ```js
* {
* type: "simple-line",
* color: [130, 130, 130],
* width: 2
* }
* ```
*/
polylineSymbol?: ((SimpleLineSymbolProperties & { type: "simple-line" }) | (LineSymbol3DProperties & { type: "line-3d" }) | (CIMSymbolProperties & { type: "cim" }));
/** The [SnappingOptions](https://developers.arcgis.com/javascript/latest/references/core/views/interactive/snapping/SnappingOptions/) for sketching. It supports [self](https://developers.arcgis.com/javascript/latest/references/core/views/interactive/snapping/SnappingOptions/#selfEnabled) and [feature](https://developers.arcgis.com/javascript/latest/references/core/views/interactive/snapping/SnappingOptions/#featureEnabled) snapping. */
snappingOptions?: SnappingOptionsProperties;
/** A [TextSymbol](https://developers.arcgis.com/javascript/latest/references/core/symbols/TextSymbol/) used when creating features with the 'text' tool. */
textSymbol?: TextSymbolProperties & { type: "text"; };
/**
* Options to configure the tooltip shown next to the cursor when creating or updating graphics.
*
* @since 4.24
*/
tooltipOptions?: SketchTooltipOptionsProperties;
/**
* Options to configure how values are displayed and input when creating or updating graphics.
*
* @since 4.29
*/
valueOptions?: SketchValueOptionsProperties;
/**
* The view model for the Sketch widget. This is a class that contains all the logic
* (properties and methods) that controls this widget's behavior. See the
* [SketchViewModel](https://developers.arcgis.com/javascript/latest/references/core/widgets/Sketch/SketchViewModel/) class to access
* all properties and methods on the Sketch widget.
*/
viewModel?: SketchViewModelProperties;
/**
* The visible elements that are displayed within the widget.
* This property provides the ability to turn individual elements of the widget's display on/off.
*
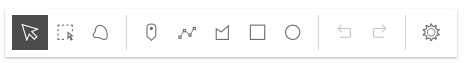
* The image below displays the default Sketch widget with selection, undo/redo, and settings menu tools.
*
* 
*
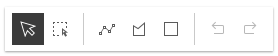
* In comparison, this image shows how the widget displays with some of its tools not visible as
* set in the example code snippet below.
*
* 
*
* @example
* // Setting the sketch's visible elements as below would result
* // in removing the point and circle tools. It also removes the
* // lasso-selection tool and settings menu.
* sketch.visibleElements = {
* createTools: {
* point: false,
* circle: false
* },
* selectionTools:{
* "lasso-selection": false
* },
* settingsMenu: false
* }
*/
visibleElements?: VisibleElementsProperties;
}
export interface SketchEvents extends SketchViewModelEvents {}
/**
* Sketch widget provides a simple UI for creating and updating graphics on a [MapView](https://developers.arcgis.com/javascript/latest/references/core/views/MapView/) or
* a [SceneView](https://developers.arcgis.com/javascript/latest/references/core/views/SceneView/). This significantly minimizes the code required for working with graphics in the view.
* It is intended to be used with [graphics](https://developers.arcgis.com/javascript/latest/references/core/Graphic/) stored in its [layer](https://developers.arcgis.com/javascript/latest/references/core/widgets/Sketch/#layer) property.
*
* By default, the Sketch widget provides out-of-the-box tools for creating and updating graphics with [Point](https://developers.arcgis.com/javascript/latest/references/core/geometry/Point/),
* [Polyline](https://developers.arcgis.com/javascript/latest/references/core/geometry/Polyline/), [Polygon](https://developers.arcgis.com/javascript/latest/references/core/geometry/Polygon/), [rectangle](https://developers.arcgis.com/javascript/latest/references/core/geometry/Polygon/)
* and [Circle](https://developers.arcgis.com/javascript/latest/references/core/geometry/Circle/) geometries.
*
* Discover the Sketch widget in MapView with [this sample](https://developers.arcgis.com/javascript/latest/sample-code/sketch-geometries/):<br>
* [](https://developers.arcgis.com/javascript/latest/sample-code/sketch-geometries/)
*
* Discover the Sketch widget in SceneView with [this sample](https://developers.arcgis.com/javascript/latest/sample-code/sketch-3d/):<br>
* [](https://developers.arcgis.com/javascript/latest/sample-code/sketch-3d/)
*
* Note that the update operations (such as rotate, move, and transform) and the creation of rectangles and circles happen in the map space.
* This means that, for example, if a graphic is rotated in a Web Mercator view, its shape and segment lengths change.
*
* <span id="gestures"></span>
* ## Pointer and keyboard gestures
*
* <span id="create-graphics"></span>
* Pointer and keyboard gestures for creating graphics with different geometries are described in the tables below.
*
* <details>
* <summary>Read More</summary>
*
* #### General shortcuts
*
* Gesture | Action | Example |
* ---------|---------|---------|
* Z | Incrementally undo actions recorded in the stack. The undo/redo stack is for an individual sketch operation, meaning you can redo/undo actions while creating or updating a graphic. | <img alt="Undo" src="https://developers.arcgis.com/javascript/latest/assets/references/core/widgets/sketch/undo-line.gif" width="400px"> |
* R | Incrementally redo actions recorded in the stack. The undo/redo stack is for an individual sketch operation, meaning you can redo/undo actions while creating or updating a graphic. | <img alt="Redo" src="https://developers.arcgis.com/javascript/latest/assets/references/core/widgets/sketch/redo-line.gif" width="400px"> |
* Ctrl | Toggle snapping dependent on the configuration in [snappingOptions](https://developers.arcgis.com/javascript/latest/references/core/widgets/Sketch/#snappingOptions). | <img alt="Ctrl key" src="https://developers.arcgis.com/javascript/latest/assets/references/core/widgets/sketch/ctrl-key-polygon.gif" width="400px"> |
* Tab | While drawing or updating features, activate the tooltips' input mode to enter values or apply constraints. Depends on [tooltipOptions](https://developers.arcgis.com/javascript/latest/references/core/widgets/Sketch/#tooltipOptions) configuration. | <img alt="Tab key" src="https://developers.arcgis.com/javascript/latest/assets/references/core/widgets/sketch/tab-key-editing-constraints.gif" width="400px"> |
*
* #### Creating point graphics
*
* Gesture | Action |
* ---------|---------|
* Left-click | Adds a point graphic at the pointer location. |
* Enter | Adds a point graphic at the pointer location. |
*
* #### Creating polyline and polygon graphics
*
* The following keyboard shortcuts apply when creating polyline and polygon graphics.
*
* Gesture | Action | Example |
* ---------|---------|---------|
* Left-click | Adds a vertex at the pointer location.| <img alt="Left-click" src="https://developers.arcgis.com/javascript/latest/assets/references/core/widgets/sketch/left-click-line.gif" width="400px"> |
* Left-drag | Adds a vertex for each pointer move in [hybrid](https://developers.arcgis.com/javascript/latest/references/core/widgets/Sketch/#defaultCreateOptions) or [freehand](https://developers.arcgis.com/javascript/latest/references/core/widgets/Sketch/#defaultCreateOptions) mode. | <img alt="Left drag" src="https://developers.arcgis.com/javascript/latest/assets/references/core/widgets/sketch/left-drag-line.gif" width="400px"> |
* F | Adds a vertex to the `polyline` or `polygon` graphic. Completes the `rectangle` or `circle` polygon graphic in [click](https://developers.arcgis.com/javascript/latest/references/core/widgets/Sketch/#defaultCreateOptions) mode. | <img alt="F vertex add" src="https://developers.arcgis.com/javascript/latest/assets/references/core/widgets/sketch/f-key-line.gif" width="400px"> |
* Enter | Completes the `polyline` or `polygon` graphic without the staged vertex. A `double-click` will complete the graphic at the current mouse cursor's postion. | <img alt="Enter" src="https://developers.arcgis.com/javascript/latest/assets/references/core/widgets/sketch/enter-line.gif" width="400px"> |
* Spacebar+Left-drag | Pan the view while creating a polyline or polygon graphic. | <img alt="Space left drag" src="https://developers.arcgis.com/javascript/latest/assets/references/core/widgets/sketch/space-left-drag.gif" width="400px"> |
* Left-click on the first vertex | Completes the polygon graphic sketch. | <img alt="Left-click first vertex" src="https://developers.arcgis.com/javascript/latest/assets/references/core/widgets/sketch/left-click-vertex.gif" width="400px"> |
*
* #### Creating polygon graphics with predefined shapes
*
* The following keyboard shortcuts apply when creating polygon graphics with predefined shapes (`rectangle` and `circle`).
*
* Gesture | Action | Example |
* ------- | ------ |---------|
* Left-click+Drag | Creates a `rectangle` graphic with dimensions based on the bounding box between initial click and cursor location. Creates a `circle` graphic with radius based on the distance between initial click and cursor location. | <img alt="Polygon Left-click drag" src="https://developers.arcgis.com/javascript/latest/assets/references/core/widgets/sketch/polygon-left-click-drag.gif" width="400px"> |
* Shift+Left-click+Drag | Changes the shape from a `rectangle` to a `square` or from a `circle` to an `ellipse`. | <img alt="Shift Left-click drag" src="https://developers.arcgis.com/javascript/latest/assets/references/core/widgets/sketch/shift-left-click-drag.gif" width="400px"> |
* Alt+Left-click+Drag | Creates a `rectangle` graphic with a center at initial click, and dimensions based on the distance between the initial click to the cursor location. Creates a `circle` graphic with a radius based on the bounding box between the initial click and the cursor location. | <img alt="Alt Left-click drag" src="https://developers.arcgis.com/javascript/latest/assets/references/core/widgets/sketch/alt-left-click-drag.gif" width="400px"> |
* Shift+Alt+Left-click+Drag | Combines the behavior described above. | <img alt="Shift Alt Left-click drag" src="https://developers.arcgis.com/javascript/latest/assets/references/core/widgets/sketch/shift-alt-left-click-drag.gif" width="400px"> |
*
* <span id="update-graphics"></span>
* #### Updating graphics
*
* The Sketch widget provides users with the ability to move, rotate, scale or reshape graphics during an update operation.
* To begin updating, `Left-click` on a graphic. Use `Shift+Left-click` to add more graphics to the selection, or remove graphics from the selection, for bulk updating.
* Once graphics are selected, the following actions can be performed.
*
* Gesture | Action | Example |
* ---------|---------|----------|
* Left-click on a graphic | Select a graphic to move, rotate or scale. | <img alt="Select a graphic" src="https://developers.arcgis.com/javascript/latest/assets/references/core/widgets/sketch/sketch-box-mode.gif" width="400px"> |
* Shift+Left-click graphics | Select or deselect multiple graphics to move, rotate or scale.| <img alt="Select graphics" src="https://developers.arcgis.com/javascript/latest/assets/references/core/widgets/sketch/sketch-graphics.gif" width="400px"> |
* Drag graphic | Move the selected graphic.| <img alt="Drag the graphic" src="https://developers.arcgis.com/javascript/latest/assets/references/core/widgets/sketch/sketch-box-move.gif" width="400px"> |
* Drag rotate handle | Rotate the selected graphic.| <img alt="Rotate the graphic" src="https://developers.arcgis.com/javascript/latest/assets/references/core/widgets/sketch/sketch-rotate.gif" width="400px"> |
* Drag scale handle | Scale the selected graphic.| <img alt="Scale the graphic" src="https://developers.arcgis.com/javascript/latest/assets/references/core/widgets/sketch/sketch-scale.gif" width="400px"> |
* Shift+Left-click+Drag scale handle | Scale the selected graphic at the center. | <img alt="Scale the graphic at the center" src="https://developers.arcgis.com/javascript/latest/assets/references/core/widgets/sketch/scale-shift-left-click-drag.gif" width="400px"> |
* Z | Incrementally undo actions recorded in the stack. The undo/redo stack is for an individual sketch operation, meaning you can redo/undo actions while creating or updating a graphic. | <img alt="Undo update" src="https://developers.arcgis.com/javascript/latest/assets/references/core/widgets/sketch/sketch-update-undo.gif" width="400px"> |
* R | Incrementally redo actions recorded in the stack. The undo/redo stack is for an individual sketch operation, meaning you can redo/undo actions while creating or updating a graphic. | <img alt="Redo update" src="https://developers.arcgis.com/javascript/latest/assets/references/core/widgets/sketch/sketch-update-redo.gif" width="400px"> |
* Left-click on view (not the graphic) | Complete the graphic update. | <img alt="Sketch update complete" src="https://developers.arcgis.com/javascript/latest/assets/references/core/widgets/sketch/sketch-update-complete.gif" width="400px"> |
* Press `Delete` key | Remove the selected graphic(s) from the [layer](https://developers.arcgis.com/javascript/latest/references/core/widgets/Sketch/#layer). | <img alt="Sketch delete graphic" src="https://developers.arcgis.com/javascript/latest/assets/references/core/widgets/sketch/sketch-delete-graphic.gif" width="400px">
*
* The following update operations can be performed on a single polyline or polygon graphic:
*
* Gesture | Action | Example |
* ---------|---------|----------|
* Left-click on a graphic | Select a graphic to move or reshape.| <img alt="Select a graphic" src="https://developers.arcgis.com/javascript/latest/assets/references/core/widgets/sketch/sketch-reshape-mode.gif" width="400px"> |
* Drag graphic | Move the selected graphic.| <img alt="Drag the graphic" src="https://developers.arcgis.com/javascript/latest/assets/references/core/widgets/sketch/sketch-drag.gif" width="400px"> |
* Left-click on a ghost vertex| Add a new vertex. | <img alt="Add a vertex" src="https://developers.arcgis.com/javascript/latest/assets/references/core/widgets/sketch/sketch-add-vertices.gif" width="400px"> |
* Left-click on a vertex| Select a vertex. | <img alt="Select a vertex" src="https://developers.arcgis.com/javascript/latest/assets/references/core/widgets/sketch/sketch-selectvertex.gif" width="400px"> |
* Shift+Left-click on vertices | Select or deselect multiple vertices. | <img alt="Select vertices" src="https://developers.arcgis.com/javascript/latest/assets/references/core/widgets/sketch/sketch-selectvertices.gif" width="400px"> |
* Drag vertex | Move the selected vertex or vertices. | <img alt="Drag vertices" src="https://developers.arcgis.com/javascript/latest/assets/references/core/widgets/sketch/sketch-dragvertices.gif" width="400px"> |
* Right-click on a vertex | Delete a vertex. | <img alt="Delete a vertex" src="https://developers.arcgis.com/javascript/latest/assets/references/core/widgets/sketch/sketch-delete-vertex.gif" width="400px"> |
* Select multiple vertices and press `Backspace` or `Delete` key | Delete multiple vertices. | <img alt="Delete vertices" src="https://developers.arcgis.com/javascript/latest/assets/references/core/widgets/sketch/sketch-delete-vertices.gif" width="400px"> |
*
* The following update operations can be performed on a single graphic with point geometry in a [SceneView](https://developers.arcgis.com/javascript/latest/references/core/views/SceneView/), if the graphic uses a [3D object symbol layer](https://developers.arcgis.com/javascript/latest/references/core/symbols/ObjectSymbol3DLayer/):
*
* Gesture | Action | Example |
* ---------|---------|----------|
* Left-click on a graphic | Select a graphic to move, rotate or scale. | <img alt="Select a graphic" src="https://developers.arcgis.com/javascript/latest/assets/references/core/widgets/sketch/sketch-update-point-3D.gif" width="400px"> |
* Drag inner handle | Move the selected graphic.| <img alt="Drag the graphic" src="https://developers.arcgis.com/javascript/latest/assets/references/core/widgets/sketch/sketch-transform-move-point.gif" width="400px"> |
* Drag height handle | Move the selected graphic vertically (on the z axis).| <img alt="Drag the graphic" src="https://developers.arcgis.com/javascript/latest/assets/references/core/widgets/sketch/sketch-transform-movez-point.gif" width="400px"> |
* Drag outer handle sideways | Rotate the selected graphic.| <img alt="Rotate the graphic" src="https://developers.arcgis.com/javascript/latest/assets/references/core/widgets/sketch/sketch-transform-rotate-point.gif" width="400px"> |
* Drag outer handle inwards or outwards | Scale the selected graphic.| <img alt="Scale the graphic" src="https://developers.arcgis.com/javascript/latest/assets/references/core/widgets/sketch/sketch-transform-scale-point.gif" width="400px"> |
*
* ---------
*
* </details>
*
* ## Sketch 3D
*
* To be able to manipulate features on the z-axis using the height handle, the following configurations are relevant:
* - [Elevation info mode](https://developers.arcgis.com/javascript/latest/references/core/layers/GraphicsLayer/#elevationInfo) of the
* [GraphicsLayer](https://developers.arcgis.com/javascript/latest/references/core/layers/GraphicsLayer/) needs to be set to `absolute-height`, `relative-to-scene`or `relative-to-ground`.
* - To create a graphic with z-value the `hasZ` needs to be `true` in [defaultCreateOptions](https://developers.arcgis.com/javascript/latest/references/core/widgets/Sketch/#defaultCreateOptions) and/or in the [createOptions](https://developers.arcgis.com/javascript/latest/references/core/widgets/Sketch/#create).
* - To update the z-value of a graphic the `enableZ` needs to be `true` in [defaultUpdateOptions](https://developers.arcgis.com/javascript/latest/references/core/widgets/Sketch/#defaultUpdateOptions) and/or in the [updateOptions](https://developers.arcgis.com/javascript/latest/references/core/widgets/Sketch/#update).
*
* ```js
* // define the GraphicsLayer
* const gLayer = new GraphicsLayer({
* elevationInfo: {
* mode: "absolute-height" // default value
* }
* });
*
* // define the SketchViewModel
* const sketchVM = new SketchViewModel({
* layer: gLayer,
* view: view,
* defaultCreateOptions: {
* hasZ: true // default value
* },
* defaultUpdateOptions: {
* enableZ: true // default value
* }
* });
* ```
*
* In `absolute-height` elevation mode, the sketched vertices snap to scene elements (features and ground).
* See [elevation info](https://developers.arcgis.com/javascript/latest/references/core/layers/GraphicsLayer/#elevationInfo) for more information on how z-values are used with different elevation modes.
*
* When sketching polygons or polylines, the elevation constraint is applied by default. This means that all the vertices use the
* z-value of the first vertex. To unlock the elevation constraint while sketching, enable the [tooltips](https://developers.arcgis.com/javascript/latest/references/core/widgets/Sketch/#tooltipOptions)
* in the widget's "Settings" menu and press `Tab` to activate the input mode while drawing or updating a feature.\
* Note that in elevation modes other than `absolute-height` the z-values are fixed but the graphic may appear non-planar because of the elevation alignment applied to the vertices.
*
* See more about available tooltip inputs and constraints under the [tooltip options](https://developers.arcgis.com/javascript/latest/references/core/views/interactive/sketch/SketchTooltipOptions/) class.
*
* > [!WARNING]
* >
* > **Known Limitation**
* >
* > Multipoint geometry can only be created in a [MapView](https://developers.arcgis.com/javascript/latest/references/core/views/MapView/).
*
* @deprecated since version 5.0. Use the [Sketch component](https://developers.arcgis.com/javascript/latest/references/map-components/components/arcgis-sketch/) instead. For information on widget deprecation, read about [Esri's move to web components](https://developers.arcgis.com/javascript/latest/components-transition-plan/).
* @since 4.10
* @see [SketchViewModel](https://developers.arcgis.com/javascript/latest/references/core/widgets/Sketch/SketchViewModel/)
* @see [SketchLabelOptions](https://developers.arcgis.com/javascript/latest/references/core/views/interactive/sketch/SketchLabelOptions/)
* @see [SketchTooltipOptions](https://developers.arcgis.com/javascript/latest/references/core/views/interactive/sketch/SketchTooltipOptions/)
* @see [SketchValueOptions](https://developers.arcgis.com/javascript/latest/references/core/views/interactive/sketch/SketchValueOptions/)
* @see [SnappingOptions](https://developers.arcgis.com/javascript/latest/references/core/views/interactive/snapping/SnappingOptions/)
* @see [Sample - Sketch temporary geometries](https://developers.arcgis.com/javascript/latest/sample-code/sketch-geometries/)
* @see [Sample - Sketch update validation](https://developers.arcgis.com/javascript/latest/sample-code/sketch-update-validation/)
* @see [Sample - Query statistics by geometry](https://developers.arcgis.com/javascript/latest/sample-code/featurelayerview-query-geometry/)
* @see [Sample - Snapping with Sketch widget and Magnifier](https://developers.arcgis.com/javascript/latest/sample-code/sketch-snapping-magnifier/)
* @see [Sample - Sketch in 3D](https://developers.arcgis.com/javascript/latest/sample-code/sketch-3d/)
* @example
* // Create a new instance of sketch widget and set its required parameters
* let sketch = new Sketch({
* layer: graphicsLayer,
* view: view
* });
*
* // Listen to sketch widget's create event.
* sketch.on("create", function(event) {
* // check if the create event's state has changed to complete indicating
* // the graphic create operation is completed.
* if (event.state === "complete") {
* // remove the graphic from the layer. Sketch adds
* // the completed graphic to the layer by default.
* graphicsLayer.remove(event.graphic);
*
* // use the graphic.geometry to query features that intersect it
* selectFeatures(event.graphic.geometry);
* }
* });
*/
export default class Sketch extends Widget<SketchProperties> {
/**
* @deprecated
* Do not directly reference this property.
* Use EventNames and EventTypes helpers from \@arcgis/core/Evented
*/
"@eventTypes": SketchEvents;
/**
* @example
* // typical usage
* let sketch = new Sketch({
* layer: layer,
* view: view
* });
*/
constructor(properties?: SketchProperties);
/**
* When creating new graphics (for example after [create()](https://developers.arcgis.com/javascript/latest/references/core/widgets/Sketch/#create) has been called),
* this property reflects the create tool being used. When updating graphics
* (for example after [update()](https://developers.arcgis.com/javascript/latest/references/core/widgets/Sketch/#update) has been called), this property reflects the
* update tool being used. If no create or update operation is in progress, this is `null`.
*
* Prior to 4.32, creation tools were modeled as a combination of a geometry type (point, line, polygon)
* and an interaction mode (click, freehand, hybrid).
* At 4.32, the available create tools were expanded to include "freehandPolyline" and "freehandPolygon".
* These tools are made available to enable interoperability with other components of the ArcGIS system,
* where freehand polyline is a distinct create tool from polyline.
*
* To minimize compatibility issues, if "freehandPolyline" and "freehandPolygon" are not in the list
* of available create tools, they will not be returned by this property, even if the user is drawing a
* polygon in freehand mode.
*
* To opt in to freehandPolyline and freehandPolygon tools, include them when setting availableCreateTools,
* and visibleElements.createTools.
*/
get activeTool(): SketchTool | SelectionTool | null;
/**
* The tooltip currently being displayed for the [SketchViewModel.activeTool](https://developers.arcgis.com/javascript/latest/references/core/widgets/Sketch/SketchViewModel/#activeTool).
*
* @since 4.31
*/
get activeTooltip(): SketchViewModel["activeTooltip"] | null;
/**
* Property controlling the visibility and order of create tool buttons.
*
* @default ["point", "polyline", "polygon", "rectangle", "circle"]
* @since 4.12
*/
accessor availableCreateTools: CreateTool[] | null | undefined;
/** The graphic that is being created. */
get createGraphic(): Graphic | null | undefined;
/**
* Defines the default behavior once the [create()](https://developers.arcgis.com/javascript/latest/references/core/widgets/Sketch/#create) operation is completed. By default, the user will be
* able to continuously create graphics with same geometry types.
*
* **Possible Values**
*
* Value | Description |
* ----- | ----------- |
* continuous | This is the default. Users can continue creating graphics with same geometry types.
* single | User can create a single graphic with the specified geometry type. User must choose an operation once the graphic is created.
* update | The graphic will be selected for an [update()](https://developers.arcgis.com/javascript/latest/references/core/widgets/Sketch/#update) operation once the `create` operation is completed.
*
* @default "continuous"
* @since 4.14
*/
accessor creationMode: CreationMode;
/**
* Default create options set for the Sketch widget.
*
* @since 4.14
*/
get defaultCreateOptions(): CreateOptions;
set defaultCreateOptions(value: Partial<CreateOptions>);
/**
* Default update options set for the Sketch widget. Update options set on this property will be overwritten if the update options are changed
* when [update()](https://developers.arcgis.com/javascript/latest/references/core/widgets/Sketch/#update) method is called.
*
* @since 4.11
* @example
* // Turn off highlights for update operations
* const sketch = new Sketch({
* view,
* defaultUpdateOptions: {
* highlightOptions: {
* enabled: false
* }
* }
* });
* // Turn off highlights from the update() method
* const updateOptions = { tool: "reshape", highlightOptions: { enabled: false }};
* sketch.update(graphic, updateOptions);
*/
get defaultUpdateOptions(): UpdateOptions;
set defaultUpdateOptions(value: Partial<UpdateOptions>);
/**
* Icon which represents the widget. It is typically used when the widget is controlled by another
* one (e.g. in the Expand widget).
*
* @default "pencil"
* @since 4.27
* @see [Calcite Icon Search](https://developers.arcgis.com/calcite-design-system/icons/)
* @see [Calcite Icon Search](https://developers.arcgis.com/calcite-design-system/icons/)
*/
get icon(): Icon["icon"];
set icon(value: Icon["icon"] | null | undefined);
/**
* Use this property to determine if the next generation geometry creation
* has been disabled. This can happen when
* [useLegacyCreateTools](https://developers.arcgis.com/javascript/latest/references/core/widgets/Sketch/#useLegacyCreateTools) is true,
* or `arcgis-sketch` is used with a non-2D (`arcgis-map`) view.
*
* @deprecated
* @default false
* @since 5.0
*/
get isUsingLegacyCreateTools(): boolean;
/**
* The Sketch widget's default label.
*
* @since 4.11
*/
get label(): string;
set label(value: string | null | undefined);
/**
* Options to configure the sketch labels shown next to each segment of the geometry being created or updated.
*
* > [!WARNING]
* >
* > **Known Limitation**
* >
* > Sketch labels are currently only supported when working with a [SceneView](https://developers.arcgis.com/javascript/latest/references/core/views/SceneView/).
*
* @since 4.24
*/
get labelOptions(): SketchLabelOptions;
set labelOptions(value: SketchLabelOptionsProperties);
/**
* The [GraphicsLayer](https://developers.arcgis.com/javascript/latest/references/core/layers/GraphicsLayer/) associated with the Sketch widget. The Sketch widget adds new [graphics](https://developers.arcgis.com/javascript/latest/references/core/Graphic/) to this layer or can only update graphics
* stored in this layer.
*/
accessor layer: GraphicsLayer | MapNotesLayer | null | undefined;
/**
* Determines the layout/orientation of the Sketch widget.
*
* @default "horizontal"
* @since 4.10
*/
accessor layout: Layout;
/**
* A [SimpleMarkerSymbol](https://developers.arcgis.com/javascript/latest/references/core/symbols/SimpleMarkerSymbol/), [PictureMarkerSymbol](https://developers.arcgis.com/javascript/latest/references/core/symbols/PictureMarkerSymbol/), [PointSymbol3D](https://developers.arcgis.com/javascript/latest/references/core/symbols/PointSymbol3D/), [TextSymbol](https://developers.arcgis.com/javascript/latest/references/core/symbols/TextSymbol/), [CIMSymbol](https://developers.arcgis.com/javascript/latest/references/core/symbols/CIMSymbol/), or [WebStyleSymbol](https://developers.arcgis.com/javascript/latest/references/core/symbols/WebStyleSymbol/) used for representing the point geometry that is being drawn. [SimpleMarkerSymbol](https://developers.arcgis.com/javascript/latest/references/core/symbols/SimpleMarkerSymbol/) may also be used to symbolize point features in a [SceneView](https://developers.arcgis.com/javascript/latest/references/core/views/SceneView/). However, it is recommended you use [PointSymbol3D](https://developers.arcgis.com/javascript/latest/references/core/symbols/PointSymbol3D/) instead.
*
* > [!WARNING]
* >
* > **Known Limitation**
* > To avoid unintended side effects, instantiate a new symbol rather than modifying the current instance.
*
* The default value is the following:
* ```js
* {
* type: "simple-marker",
* style: "circle",
* size: 6,
* color: [255, 255, 255],
* outline: {
* color: [50, 50, 50],
* width: 1
* }
* }
* ```
*/
get pointSymbol(): SketchPointSymbol;
set pointSymbol(value: ((SimpleMarkerSymbolProperties & { type: "simple-marker" }) | (PictureMarkerSymbolProperties & { type: "picture-marker" }) | (PointSymbol3DProperties & { type: "point-3d" }) | (TextSymbolProperties & { type: "text" }) | (CIMSymbolProperties & { type: "cim" }) | (WebStyleSymbolProperties & { type: "web-style" })));
/**
* A [SimpleFillSymbol](https://developers.arcgis.com/javascript/latest/references/core/symbols/SimpleFillSymbol/), [PolygonSymbol3D](https://developers.arcgis.com/javascript/latest/references/core/symbols/PolygonSymbol3D/), or [CIMSymbol](https://developers.arcgis.com/javascript/latest/references/core/symbols/CIMSymbol/) used for representing the polygon geometry that is being drawn. [SimpleFillSymbol](https://developers.arcgis.com/javascript/latest/references/core/symbols/SimpleFillSymbol/) may also be used to symbolize polygon features in a [SceneView](https://developers.arcgis.com/javascript/latest/references/core/views/SceneView/). However, it is recommended you use [PolygonSymbol3D](https://developers.arcgis.com/javascript/latest/references/core/symbols/PolygonSymbol3D/) instead.
*
* > [!WARNING]
* >
* > **Known Limitation**
* > To avoid unintended side effects, instantiate a new symbol rather than modifying the current instance.
*
* The default value is the following:
* ```js
* {
* type: "simple-fill",
* color: [150, 150, 150, 0.2],
* outline: {
* color: [50, 50, 50],
* width: 2
* }
* }
* ```
*/
get polygonSymbol(): SketchPolygonSymbol;
set polygonSymbol(value: ((SimpleFillSymbolProperties & { type: "simple-fill" }) | (PolygonSymbol3DProperties & { type: "polygon-3d" }) | (CIMSymbolProperties & { type: "cim" })));
/**
* A [SimpleLineSymbol](https://developers.arcgis.com/javascript/latest/references/core/symbols/SimpleLineSymbol/), [LineSymbol3D](https://developers.arcgis.com/javascript/latest/references/core/symbols/LineSymbol3D/), or [CIMSymbol](https://developers.arcgis.com/javascript/latest/references/core/symbols/CIMSymbol/) used for representing the polyline geometry that is being drawn. [SimpleLineSymbol](https://developers.arcgis.com/javascript/latest/references/core/symbols/SimpleLineSymbol/) may also be used to symbolize polyline features in a [SceneView](https://developers.arcgis.com/javascript/latest/references/core/views/SceneView/). However, it is recommended you use [LineSymbol3D](https://developers.arcgis.com/javascript/latest/references/core/symbols/LineSymbol3D/) instead.
*
* > [!WARNING]
* >
* > **Known Limitation**
* > To avoid unintended side effects, instantiate a new symbol rather than modifying the current instance.
*
* The default value is the following:
* ```js
* {
* type: "simple-line",
* color: [130, 130, 130],
* width: 2
* }
* ```
*/
get polylineSymbol(): SketchPolylineSymbol;
set polylineSymbol(value: ((SimpleLineSymbolProperties & { type: "simple-line" }) | (LineSymbol3DProperties & { type: "line-3d" }) | (CIMSymbolProperties & { type: "cim" })));
/**
* Determines the size of widget elements.
*
* @default "m"
* @since 4.32
*/
accessor scale: "s" | "m" | "l";
/** The [SnappingOptions](https://developers.arcgis.com/javascript/latest/references/core/views/interactive/snapping/SnappingOptions/) for sketching. It supports [self](https://developers.arcgis.com/javascript/latest/references/core/views/interactive/snapping/SnappingOptions/#selfEnabled) and [feature](https://developers.arcgis.com/javascript/latest/references/core/views/interactive/snapping/SnappingOptions/#featureEnabled) snapping. */
get snappingOptions(): SnappingOptions;
set snappingOptions(value: SnappingOptionsProperties);
/** The Sketch widget's state. */
get state(): State;
/** A [TextSymbol](https://developers.arcgis.com/javascript/latest/references/core/symbols/TextSymbol/) used when creating features with the 'text' tool. */
get textSymbol(): TextSymbol;
set textSymbol(value: TextSymbolProperties & { type: "text"; });
/**
* Controls the appearance of the sketch widget, allowing
* the toolbar to adapt its appearance appropriately based on context.
* Use 'docked' when the Sketch widget is embedded in another
* UI component like a panel; in this view, the widget stretches to fill
* available space.
*
* "floating" appearance is optimized for situations where the
* Sketch widget is "floating" on top of the map. This appearance
* has a drop shadow, rounded corners, and dynamic layout that works
* well on a map or scene.
*
* Subject to change, Sketch uses Calcite Action Pad in "floating"
* mode, and Calcite Action Bar in docked mode.
*
* In both modes, Sketch will expand to fill available width, then
* collapse overflowing items into split-button or overflow menu
* groups as appropriate. In docked mode, Sketch expands to the width
* (in horizontal layout) or height (in vertical layout) of the nearest
* ancestor.
*
* @default "floating"
* @since 4.32
*/
accessor toolbarKind: ToolbarKind;
/**
* Options to configure the tooltip shown next to the cursor when creating or updating graphics.
*
* @since 4.24
*/
get tooltipOptions(): SketchTooltipOptions;
set tooltipOptions(value: SketchTooltipOptionsProperties);
/** An array of [graphics](https://developers.arcgis.com/javascript/latest/references/core/Graphic/) that are being updated by the Sketch widget. */
get updateGraphics(): Collection<Graphic>;
/**
* Starting with 5.0, `arcgis-sketch` and [SketchViewModel](https://developers.arcgis.com/javascript/latest/references/core/widgets/Sketch/SketchViewModel/)
* ara transitioning to a next generation geometry creation experience. This
* new experience enables the use of advanced curve creation tools and the
* combination of multiple create tools to define a single geometry.
*
* As of 5.0, this experience is only available in 2D (e.g., [MapView](https://developers.arcgis.com/javascript/latest/references/core/views/MapView/), [`arcgis-map`](https://developers.arcgis.com/javascript/latest/references/map-components/arcgis-map)).
*
* This property is available to allow 2D applications to temporarily
* opt out of this experience.
*
* > [!CAUTION]
* >
* > This option will be removed in an upcoming release.
*
* @deprecated
* @since 5.0
*/
accessor useLegacyCreateTools: boolean;
/**
* Options to configure how values are displayed and input when creating or updating graphics.
*
* @since 4.29
*/
get valueOptions(): SketchValueOptions;
set valueOptions(value: SketchValueOptionsProperties);
/** A reference to the [MapView](https://developers.arcgis.com/javascript/latest/references/core/views/MapView/) or [SceneView](https://developers.arcgis.com/javascript/latest/references/core/views/SceneView/). Set this to link the Sketch widget to a specific view. */
accessor view: MapViewOrSceneView | null | undefined;
/**
* The view model for the Sketch widget. This is a class that contains all the logic
* (properties and methods) that controls this widget's behavior. See the
* [SketchViewModel](https://developers.arcgis.com/javascript/latest/references/core/widgets/Sketch/SketchViewModel/) class to access
* all properties and methods on the Sketch widget.
*/
get viewModel(): SketchViewModel;
set viewModel(value: SketchViewModelProperties);
/**
* The visible elements that are displayed within the widget.
* This property provides the ability to turn individual elements of the widget's display on/off.
*
* The image below displays the default Sketch widget with selection, undo/redo, and settings menu tools.
*
* 
*
* In comparison, this image shows how the widget displays with some of its tools not visible as
* set in the example code snippet below.
*
* 
*
* @example
* // Setting the sketch's visible elements as below would result
* // in removing the point and circle tools. It also removes the
* // lasso-selection tool and settings menu.
* sketch.visibleElements = {
* createTools: {
* point: false,
* circle: false
* },
* selectionTools:{
* "lasso-selection": false
* },
* settingsMenu: false
* }
*/
get visibleElements(): VisibleElements;
set visibleElements(value: VisibleElementsProperties);
/**
* Cancels the active operation and fires the [@create](https://developers.arcgis.com/javascript/latest/references/core/widgets/Sketch/#event-create) or [@update](https://developers.arcgis.com/javascript/latest/references/core/widgets/Sketch/#event-update) event.
* If called in the middle of a create operation, `cancel()` discards
* the partially created graphic.
*
* @since 4.10
*/
cancel(): void;
/**
* Completes the active operation and fires the [@create](https://developers.arcgis.com/javascript/latest/references/core/widgets/Sketch/#event-create) or [@update](https://developers.arcgis.com/javascript/latest/references/core/widgets/Sketch/#event-update) event
* and changes the event's state to `complete`. If called in the middle of a create operation, `complete()` finishes
* the active create operation and keeps the valid geometry.
*/
complete(): void;
/**
* Create a graphic with the geometry specified in the `tool` parameter. When the first vertex of the graphic is added,
* the [@create](https://developers.arcgis.com/javascript/latest/references/core/widgets/Sketch/#event-create) event will start firing. The provided `tool` will become the [activeTool](https://developers.arcgis.com/javascript/latest/references/core/widgets/Sketch/#activeTool).
*
* @param tool - Name of the create tool. Specifies the geometry for