@arcgis/core
Version:
ArcGIS Maps SDK for JavaScript: A complete 2D and 3D mapping and data visualization API
331 lines (329 loc) • 22.4 kB
TypeScript
import type Graphic from "../Graphic.js";
import type Collection from "../core/Collection.js";
import type Widget from "./Widget.js";
import type ElevationProfileViewModel from "./ElevationProfile/ElevationProfileViewModel.js";
import type ElevationProfileVisibleElements from "./ElevationProfile/ElevationProfileVisibleElements.js";
import type { Icon } from "@esri/calcite-components/components/calcite-icon";
import type { ReadonlyArrayOrCollection } from "../core/Collection.js";
import type { SystemOrLengthUnit } from "../core/units.js";
import type { MapViewOrSceneView } from "../views/MapViewOrSceneView.js";
import type { WidgetProperties } from "./Widget.js";
import type { ElevationProfileLineUnion } from "./ElevationProfile/types.js";
import type { ElevationProfileViewModelProperties } from "./ElevationProfile/ElevationProfileViewModel.js";
import type { GraphicProperties } from "../Graphic.js";
import type { ElevationProfileLineViewProperties } from "./ElevationProfile/ElevationProfileLineView.js";
import type { ElevationProfileLineQueryProperties } from "./ElevationProfile/ElevationProfileLineQuery.js";
import type { ElevationProfileLineInputProperties } from "./ElevationProfile/ElevationProfileLineInput.js";
import type { ElevationProfileLineGroundProperties } from "./ElevationProfile/ElevationProfileLineGround.js";
import type { ElevationProfileVisibleElementsProperties } from "./ElevationProfile/ElevationProfileVisibleElements.js";
/** @deprecated since version 5.0. Use the [Elevation Profile component](https://developers.arcgis.com/javascript/latest/references/map-components/components/arcgis-elevation-profile/) instead. For information on widget deprecation, read about [Esri's move to web components](https://developers.arcgis.com/javascript/latest/components-transition-plan/). */
export interface ElevationProfileProperties extends WidgetProperties, Partial<Pick<ElevationProfile, "unit" | "unitOptions" | "view">> {
/**
* Icon which represents the widget. It is typically used when the widget is controlled by another
* one (e.g. in the Expand widget).
*
* @default "altitude"
* @since 4.27
* @see [Calcite Icon Search](https://developers.arcgis.com/calcite-design-system/icons/)
* @see [Calcite Icon Search](https://developers.arcgis.com/calcite-design-system/icons/)
*/
icon?: Icon["icon"] | null;
/**
* The input line graphic along which elevation will be queried in order to generate an elevation profile.
*
* Typically not set when creating the widget. In this case the widget starts empty,
* and waits for the user to either draw a new profile or generate a profile from selecting a line feature.
* The result of this action populates `input`.
* `input` can be set when constructing the widget, or set or changed at runtime.
* The input graphic must contain a geometry of type [Polyline](https://developers.arcgis.com/javascript/latest/references/core/geometry/Polyline/),
* symbol and attributes of the input graphic are ignored.
*/
input?: GraphicProperties | null;
/**
* The widget's default label.
*
* @since 4.11
*/
label?: string | null;
/**
* Collection of elevation profile lines which are to be generated and displayed in the widget's
* chart. See the different profile line types for details on usage and behavior.
*
* Once an elevation profile is generated, each line will contain the raw data used to
* generate the chart and [profile statistics](https://developers.arcgis.com/javascript/latest/references/core/widgets/ElevationProfile/types/#ElevationProfileStatistics).
* The order of the profiles within the collection determines the drawing order on the chart.
*
* In a [MapView](https://developers.arcgis.com/javascript/latest/references/core/views/MapView/) [ElevationProfileLineView](https://developers.arcgis.com/javascript/latest/references/core/widgets/ElevationProfile/ElevationProfileLineView/)
* is not supported.
*
* @example
* const elevationProfile = new ElevationProfile({
* view: view,
* profiles: [{
* // displays elevation values from Map.ground
* type: "ground", //autocasts as new ElevationProfileLineGround()
* }, {
* // displays elevation values from the input line graphic
* type: "input", //autocasts as new ElevationProfileLineInput()
* }, {
* // displays elevation values from an elevation source
* type: "query", //autocasts as new ElevationProfileLineQuery()
* source: elevationLayer
* }, {
* // displays elevation values from a SceneView
* type: "view" //autocasts as new ElevationProfileLineView()
* }]
* });
*/
profiles?: ReadonlyArrayOrCollection<((ElevationProfileLineGroundProperties & { type: "ground" }) | (ElevationProfileLineInputProperties & { type: "input" }) | (ElevationProfileLineQueryProperties & { type: "query" }) | (ElevationProfileLineViewProperties & { type: "view" }))> | null;
/**
* The view model for this widget. This is a class that contains all the logic (properties and methods)
* that controls this widget's behavior. See the [ElevationProfileViewModel](https://developers.arcgis.com/javascript/latest/references/core/widgets/ElevationProfile/ElevationProfileViewModel/)
* class to access all properties and methods on the widget.
*/
viewModel?: ElevationProfileViewModelProperties;
/**
* This property provides the ability to display or hide the individual elements of the widget.
*
* @example
* elevationProfile.visibleElements = {
* legend: true,
* chart: true,
* clearButton: true,
* settingsButton: true,
* sketchButton: true,
* selectButton: true,
* uniformChartScalingToggle: true
* }
*/
visibleElements?: ElevationProfileVisibleElementsProperties;
}
/**
* The ElevationProfile widget is used to generate and display an elevation profile from an [input line graphic](https://developers.arcgis.com/javascript/latest/references/core/widgets/ElevationProfile/#input).
* The input graphic can be set interactively by drawing a single or multi-segment line or by selecting a line feature in the view.
* Alternatively, the widget allows setting an input graphic programmatically at creation or runtime by setting the
* [input](https://developers.arcgis.com/javascript/latest/references/core/widgets/ElevationProfile/#input) property.
*
* [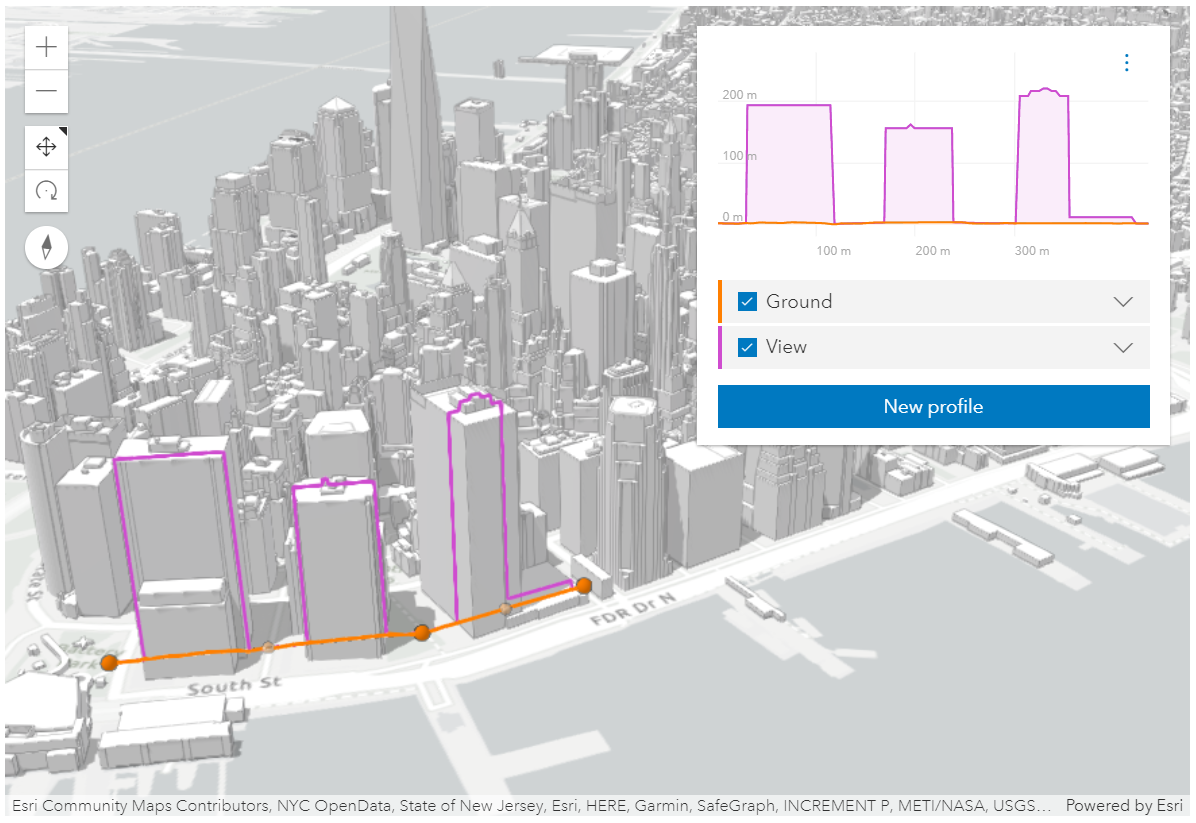](https://developers.arcgis.com/javascript/latest/sample-code/widgets-elevation-profile/)
* _ElevationProfile widget used in a city scene, displaying ground and building profiles. See [Sample - ElevationProfile widget](https://developers.arcgis.com/javascript/latest/sample-code/widgets-elevation-profile/)_
*
* The widget can visualize multiple profile lines, depending on the environment (2D versus 3D) and elevation source data:
*
* * [ElevationProfileLineGround](https://developers.arcgis.com/javascript/latest/references/core/widgets/ElevationProfile/ElevationProfileLineGround/) can be used in both [MapView](https://developers.arcgis.com/javascript/latest/references/core/views/MapView/)
* and [SceneView](https://developers.arcgis.com/javascript/latest/references/core/views/SceneView/). In this case, the elevation is sampled directly from
* [Map.ground](https://developers.arcgis.com/javascript/latest/references/core/Map/#ground). Whether your map is displayed in 2D or 3D, the ground property needs to be set on the map.
*
* * [ElevationProfileLineInput](https://developers.arcgis.com/javascript/latest/references/core/widgets/ElevationProfile/ElevationProfileLineInput/) samples elevation data from the geometry of
* the input graphic. It is typically used with input line data that has z values. If the input line data doesn't have z values, a profile line
* is computed if the line is displayed with a non-draped elevation mode. An elevation offset can also be applied.
* Currently, in 2D, z values are not fetched from feature-based layers, so in a [MapView](https://developers.arcgis.com/javascript/latest/references/core/views/MapView/),
* this profile line can only be used with client-side graphics that have z values.
*
* * [ElevationProfileLineQuery](https://developers.arcgis.com/javascript/latest/references/core/widgets/ElevationProfile/ElevationProfileLineQuery/) samples elevation data from the elevation source set in the
* [ElevationProfileLineQuery.source](https://developers.arcgis.com/javascript/latest/references/core/widgets/ElevationProfile/ElevationProfileLineQuery/#source) property. The elevation source can be an
* [ElevationLayer](https://developers.arcgis.com/javascript/latest/references/core/layers/ElevationLayer/) or any object with a method called `queryElevation` that has the same signature as
* [ElevationLayer.queryElevation()](https://developers.arcgis.com/javascript/latest/references/core/layers/ElevationLayer/#queryElevation).
*
* * [ElevationProfileLineView](https://developers.arcgis.com/javascript/latest/references/core/widgets/ElevationProfile/ElevationProfileLineView/) is available only in a
* [SceneView](https://developers.arcgis.com/javascript/latest/references/core/views/SceneView/) and it displays the elevation sampled directly from the view along the input graphic.
* All volumetric objects in a [SceneView](https://developers.arcgis.com/javascript/latest/references/core/views/SceneView/) contribute to the resulting profile.
*
* You can choose to display one or several profile lines in the chart, by setting them in the [profiles](https://developers.arcgis.com/javascript/latest/references/core/widgets/ElevationProfile/#profiles) property.
*
* Once all profiles are refined to their maximum resolution, the corresponding 3D profile lines appear in the
* [SceneView](https://developers.arcgis.com/javascript/latest/references/core/views/SceneView/) (currently no lines are displayed in a [MapView](https://developers.arcgis.com/javascript/latest/references/core/views/MapView/)),
* and [profile statistics](https://developers.arcgis.com/javascript/latest/references/core/widgets/ElevationProfile/types/#ElevationProfileStatistics) display in the legend for each profile line.
* Hovering over the chart shows an overlaid tooltip with elevation values of all profiles,
* and displays colored dot markers in the 3D view at the matching positions.
*
* Checkboxes in the legend allow hiding individual profiles.
* Chart units can be set via the settings menu to metric, imperial or a specific unit.
*
* Scrolling the chart zooms in to a specific part of the profile chart. When zoomed in, click the minus button to reset the zoom.
* On touch devices, pinch to zoom in and out.
*
* 
* _Drawing a path to get a ground profile._
*
* 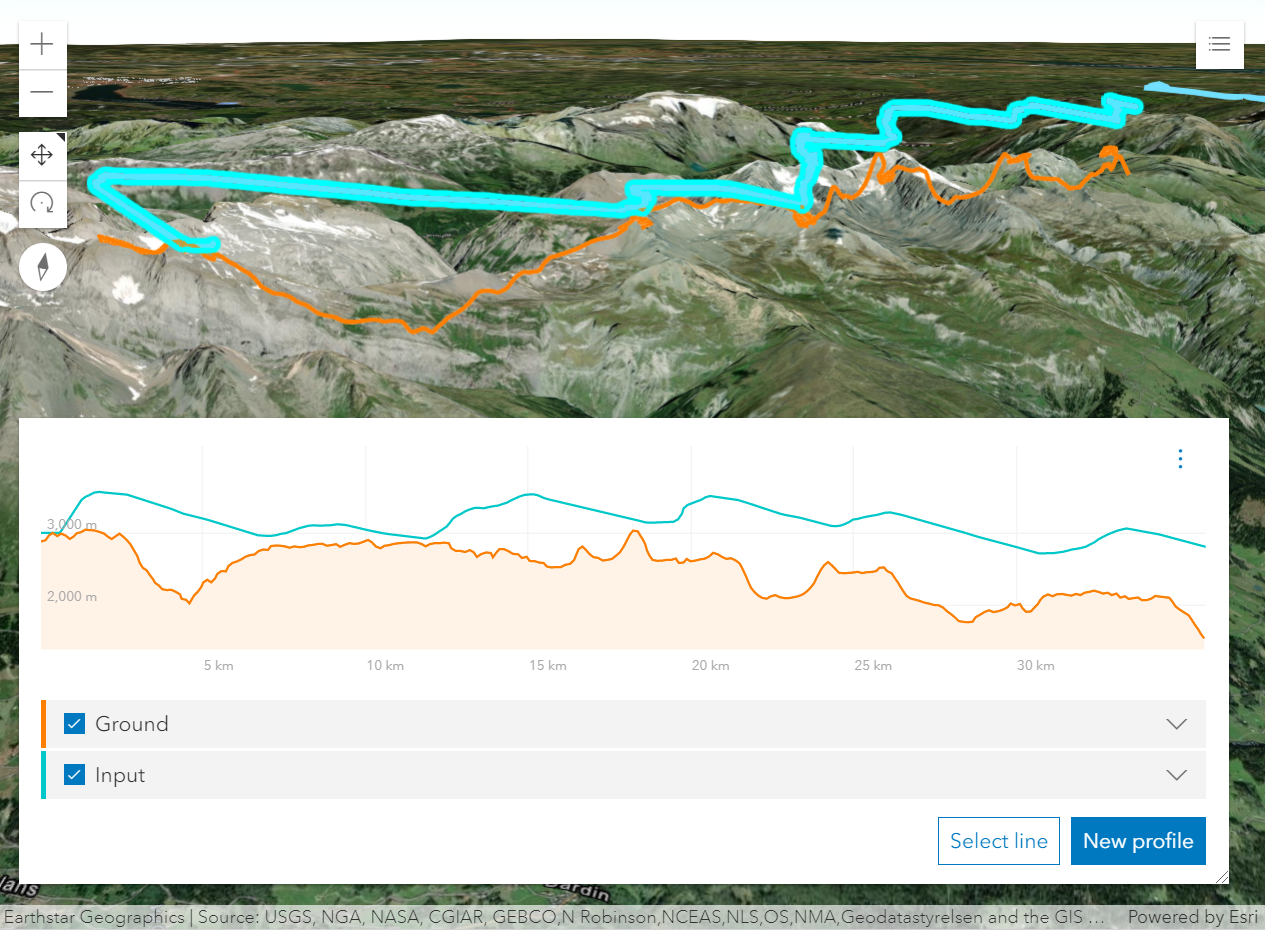
* _Profile generated from a line feature with z-values shows a paraglide track above ground._
*
* How distance values are computed depends on the map's spatial reference:
* * In geographic coordinate systems (GCS) and in Web Mercator, distances are computed geodetically.
* * In projected coordinate systems (PCS), apart from Web Mercator, distances are computed in a Euclidean manner (in their respective PCS).
*
* > [!WARNING]
* >
* > **Known Limitations**
* >
* > In 3D, [ElevationProfileLineInput](https://developers.arcgis.com/javascript/latest/references/core/widgets/ElevationProfile/ElevationProfileLineInput/) does not take into consideration
* > the `featureExpression` set on the [elevation mode](https://developers.arcgis.com/javascript/latest/references/core/layers/GraphicsLayer/#elevationInfo) of the layer.
* > In 2D, z values are not fetched from feature based layers. Therefore,
* > [ElevationProfileLineInput](https://developers.arcgis.com/javascript/latest/references/core/widgets/ElevationProfile/ElevationProfileLineInput/) can only be used with client-side graphics that have z values
* > in a [MapView](https://developers.arcgis.com/javascript/latest/references/core/views/MapView/).
*
* @deprecated since version 5.0. Use the [Elevation Profile component](https://developers.arcgis.com/javascript/latest/references/map-components/components/arcgis-elevation-profile/) instead. For information on widget deprecation, read about [Esri's move to web components](https://developers.arcgis.com/javascript/latest/components-transition-plan/).
* @since 4.18
* @see [Sample - ElevationProfile widget](https://developers.arcgis.com/javascript/latest/sample-code/widgets-elevation-profile/)
* @see [ElevationProfileViewModel](https://developers.arcgis.com/javascript/latest/references/core/widgets/ElevationProfile/ElevationProfileViewModel/) - Deprecated since 5.0. Use the [ElevationProfileAnalysis](https://developers.arcgis.com/javascript/latest/references/core/analysis/ElevationProfileAnalysis/) or [Elevation Profile component](https://developers.arcgis.com/javascript/latest/references/map-components/components/arcgis-elevation-profile/) instead.
* @see [ElevationProfileLineGround](https://developers.arcgis.com/javascript/latest/references/core/widgets/ElevationProfile/ElevationProfileLineGround/) - Deprecated since 5.0. Use [ElevationProfileLineGround](https://developers.arcgis.com/javascript/latest/references/core/analysis/ElevationProfile/ElevationProfileLineGround/) from [ElevationProfileAnalysis](https://developers.arcgis.com/javascript/latest/references/core/analysis/ElevationProfileAnalysis/) instead.
* @see [ElevationProfileLineInput](https://developers.arcgis.com/javascript/latest/references/core/widgets/ElevationProfile/ElevationProfileLineInput/) - Deprecated since 5.0. Use [ElevationProfileLineInput](https://developers.arcgis.com/javascript/latest/references/core/analysis/ElevationProfile/ElevationProfileLineInput/) from [ElevationProfileAnalysis](https://developers.arcgis.com/javascript/latest/references/core/analysis/ElevationProfileAnalysis/) instead.
* @see [ElevationProfileLineQuery](https://developers.arcgis.com/javascript/latest/references/core/widgets/ElevationProfile/ElevationProfileLineQuery/) - Deprecated since 5.0. Use [ElevationProfileLineQuery](https://developers.arcgis.com/javascript/latest/references/core/analysis/ElevationProfile/ElevationProfileLineQuery/) from [ElevationProfileAnalysis](https://developers.arcgis.com/javascript/latest/references/core/analysis/ElevationProfileAnalysis/) instead.
* @see [ElevationProfileLineView](https://developers.arcgis.com/javascript/latest/references/core/widgets/ElevationProfile/ElevationProfileLineView/) - Deprecated since 5.0. Use [ElevationProfileLineScene](https://developers.arcgis.com/javascript/latest/references/core/analysis/ElevationProfile/ElevationProfileLineScene/) from [ElevationProfileAnalysis](https://developers.arcgis.com/javascript/latest/references/core/analysis/ElevationProfileAnalysis/) instead.
* @example
* const elevationProfile = new ElevationProfile({ view });
* // adds the ElevationProfile to the top right corner of the view
* view.ui.add(elevationProfile, "top-right");
* @example
* // elevation profile with all the line profiles
* const elevationProfile = new ElevationProfile({
* view,
* profiles: [{
* // displays elevation values from Map.ground
* type: "ground", //autocasts as new ElevationProfileLineGround()
* color: "#61d4a4",
* title: "Ground elevation"
* }, {
* // displays elevation values from the input line graphic
* type: "input", //autocasts as new ElevationProfileLineInput()
* color: "#f57e42",
* title: "Line elevation"
* }, {
* // displays elevation values from a SceneView
* type: "view", //autocasts as new ElevationProfileLineView()
* color: "#8f61d4",
* title: "View elevation"
* // by default ground and all layers are used to compute elevation, but
* // you can define which elements should be included/excluded from the computation
* exclude: [map.ground]
* }, {
* // displays elevation values from a custom source
* type: "query",
* source: new ElevationLayer({
* url: "https://elevation3d.arcgis.com/arcgis/rest/../Terrain3D/ImageServer"
* }),
* color: "#d46189",
* title: "Custom elevation"
* }]
* });
* view.ui.add(elevationProfile, "bottom-right");
* @example
* // Line whose elevation profile is to be generated.
* const inputLine = new Graphic({
* geometry: new Polyline({
* spatialReference: SpatialReference.WebMercator,
* paths: [
* [
* [950857, 6003812], // Zurich, Switzerland
* [924987, 5950271], // Lucerne, Switzerland
* ]
* ],
* }),
* });
*
* // Elevation profile for the existing line.
* const elevationProfile = new ElevationProfile({
* view,
* input: inputLine,
* // Don't let the user draw or select a new line because we provide one programmatically.
* visibleElements: {
* sketchButton: false,
* selectButton: false
* }
* });
* view.ui.add(elevationProfile, "bottom-right");
*/
export default class ElevationProfile extends Widget {
constructor(properties?: ElevationProfileProperties);
/**
* Icon which represents the widget. It is typically used when the widget is controlled by another
* one (e.g. in the Expand widget).
*
* @default "altitude"
* @since 4.27
* @see [Calcite Icon Search](https://developers.arcgis.com/calcite-design-system/icons/)
* @see [Calcite Icon Search](https://developers.arcgis.com/calcite-design-system/icons/)
*/
get icon(): Icon["icon"];
set icon(value: Icon["icon"] | null | undefined);
/**
* The input line graphic along which elevation will be queried in order to generate an elevation profile.
*
* Typically not set when creating the widget. In this case the widget starts empty,
* and waits for the user to either draw a new profile or generate a profile from selecting a line feature.
* The result of this action populates `input`.
* `input` can be set when constructing the widget, or set or changed at runtime.
* The input graphic must contain a geometry of type [Polyline](https://developers.arcgis.com/javascript/latest/references/core/geometry/Polyline/),
* symbol and attributes of the input graphic are ignored.
*/
get input(): Graphic | null | undefined;
set input(value: GraphicProperties | null | undefined);
/**
* The widget's default label.
*
* @since 4.11
*/
get label(): string;
set label(value: string | null | undefined);
/**
* Collection of elevation profile lines which are to be generated and displayed in the widget's
* chart. See the different profile line types for details on usage and behavior.
*
* Once an elevation profile is generated, each line will contain the raw data used to
* generate the chart and [profile statistics](https://developers.arcgis.com/javascript/latest/references/core/widgets/ElevationProfile/types/#ElevationProfileStatistics).
* The order of the profiles within the collection determines the drawing order on the chart.
*
* In a [MapView](https://developers.arcgis.com/javascript/latest/references/core/views/MapView/) [ElevationProfileLineView](https://developers.arcgis.com/javascript/latest/references/core/widgets/ElevationProfile/ElevationProfileLineView/)
* is not supported.
*
* @example
* const elevationProfile = new ElevationProfile({
* view: view,
* profiles: [{
* // displays elevation values from Map.ground
* type: "ground", //autocasts as new ElevationProfileLineGround()
* }, {
* // displays elevation values from the input line graphic
* type: "input", //autocasts as new ElevationProfileLineInput()
* }, {
* // displays elevation values from an elevation source
* type: "query", //autocasts as new ElevationProfileLineQuery()
* source: elevationLayer
* }, {
* // displays elevation values from a SceneView
* type: "view" //autocasts as new ElevationProfileLineView()
* }]
* });
*/
get profiles(): Collection<ElevationProfileLineUnion>;
set profiles(value: ReadonlyArrayOrCollection<((ElevationProfileLineGroundProperties & { type: "ground" }) | (ElevationProfileLineInputProperties & { type: "input" }) | (ElevationProfileLineQueryProperties & { type: "query" }) | (ElevationProfileLineViewProperties & { type: "view" }))> | null);
/** Unit system (imperial, metric) or specific unit used for displaying the elevation and distance values. */
accessor unit: SystemOrLengthUnit;
/** List of available units and unit systems (imperial, metric) for displaying the elevation and distance values. */
accessor unitOptions: SystemOrLengthUnit[];
/** A reference to the [SceneView](https://developers.arcgis.com/javascript/latest/references/core/views/SceneView/) or the [MapView](https://developers.arcgis.com/javascript/latest/references/core/views/MapView/). */
accessor view: MapViewOrSceneView | null | undefined;
/**
* The view model for this widget. This is a class that contains all the logic (properties and methods)
* that controls this widget's behavior. See the [ElevationProfileViewModel](https://developers.arcgis.com/javascript/latest/references/core/widgets/ElevationProfile/ElevationProfileViewModel/)
* class to access all properties and methods on the widget.
*/
get viewModel(): ElevationProfileViewModel;
set viewModel(value: ElevationProfileViewModelProperties);
/**
* This property provides the ability to display or hide the individual elements of the widget.
*
* @example
* elevationProfile.visibleElements = {
* legend: true,
* chart: true,
* clearButton: true,
* settingsButton: true,
* sketchButton: true,
* selectButton: true,
* uniformChartScalingToggle: true
* }
*/
get visibleElements(): ElevationProfileVisibleElements;
set visibleElements(value: ElevationProfileVisibleElementsProperties);
}