@arcgis/core
Version:
ArcGIS Maps SDK for JavaScript: A complete 2D and 3D mapping and data visualization API
292 lines (286 loc) • 18.3 kB
TypeScript
/**
* This object contains a helper method for generating a predominance visualization.
* Visualizing predominance involves coloring a [layer's](https://developers.arcgis.com/javascript/latest/references/core/layers/Layer/) features based on which attribute among a set of competing
* numeric attributes wins or beats the others in total count. Common applications of this include visualizing
* election results, survey results, and demographic majorities.
*
* For example, suppose you have a layer of U.S. counties with fields containing the total sales of various crops: wheat, soybeans, corn, cotton, and vegetables.
* You can use the [createRenderer()](https://developers.arcgis.com/javascript/latest/references/core/smartMapping/renderers/predominance/#createRenderer) method in this module to generate a default visualization depicting the winner, or most
* predominant crop, in each county.
*
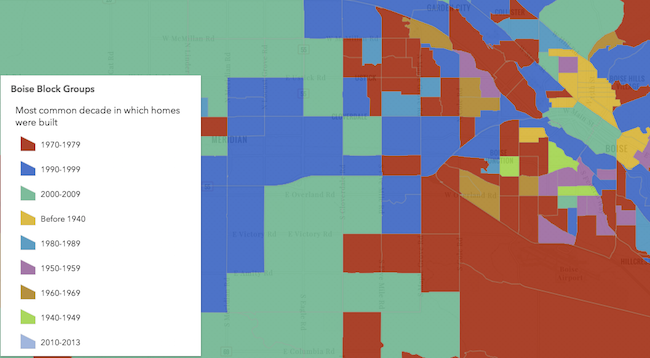
* The example below depicts the predominant decade in which homes were constructed based on a city's block groups.
*
* [](https://developers.arcgis.com/javascript/latest/sample-code/visualization-sm-predominance/)
*
* > [!WARNING]
* >
* > **Known Limitations**
* >
* > Currently, 3D symbols can only be generated for layers with a `point` geometry type.
* > [SceneLayers](https://developers.arcgis.com/javascript/latest/references/core/layers/SceneLayer/) must have the `supportsRenderer` and `supportsLayerQuery` capabilities enabled unless a predefined [statistics](https://developers.arcgis.com/javascript/latest/references/core/smartMapping/statistics/types/#SummaryStatisticsResult) object is provided to the `statistics` parameter of the method. To check a SceneLayer's capabilities, use the [SceneLayer.getFieldUsageInfo()](https://developers.arcgis.com/javascript/latest/references/core/layers/SceneLayer/#getFieldUsageInfo) method.
*
* @since 4.9
* @see [Sample - Generate a predominance visualization](https://developers.arcgis.com/javascript/latest/sample-code/visualization-sm-predominance/)
* @see [ArcGIS Blog: Creating a predominance visualization with Arcade](https://www.esri.com/arcgis-blog/products/js-api-arcgis/mapping/creating-a-predominance-visualization-with-arcade/)
* @see [ArcGIS Blog: Map Multiple Attributes at Once using Predominance](https://www.esri.com/arcgis-blog/products/arcgis-online/mapping/map-multiple-attributes-at-once-using-predominance/)
* @see [Styles and data visualization](https://developers.arcgis.com/javascript/latest/visualization/)
*/
import type FeatureFilter from "../../layers/support/FeatureFilter.js";
import type UniqueValueRenderer from "../../renderers/UniqueValueRenderer.js";
import type * as opacityCreator from "./opacity.js";
import type * as sizeCreator from "./size.js";
import type * as typeCreator from "./type.js";
import type { MapViewOrSceneView } from "../../views/MapViewOrSceneView.js";
import type { AbortOptions } from "../../core/promiseUtils.js";
import type { RendererLegendTitleOption } from "../../renderers/support/types.js";
import type { UniqueValueInfo } from "./type.js";
import type { FeatureLikeLayerOrAdapter } from "../support/adapters/types.js";
import type { PredominanceScheme, BasemapTheme } from "../symbology/types.js";
/**
* Generates a predominance renderer based on a set of competing numeric fields.
*
* Visualizing predominance involves coloring a [layer's](https://developers.arcgis.com/javascript/latest/references/core/layers/Layer/) features based
* on which attribute among a set of competing numeric attributes wins or beats the others in total count.
* Common applications of this include visualizing election results, survey results, and demographic majorities.
*
* For example, suppose you have a layer of U.S. counties with fields containing the total sales of
* various crops: wheat, soybeans, corn, cotton, and vegetables. If a feature has the following values for each field:
*
* Field Name | Count | Color
* -----------|-------|------
* Wheat | 130 | purple
* Soybeans | 2000 | blue
* Corn | 0 | yellow
* Cotton | 300 | green
* Vegetables | 120 | red
*
* Then the renderer symbolizes the feature with a blue color since Soybeans is the predominant crop.
*
* The predominant field of a feature is determined based on the result of an Arcade expression generated
* by this method. You are required to provide a `layer`, `view`, and list of `fields` to generate this renderer. Optionally, you can
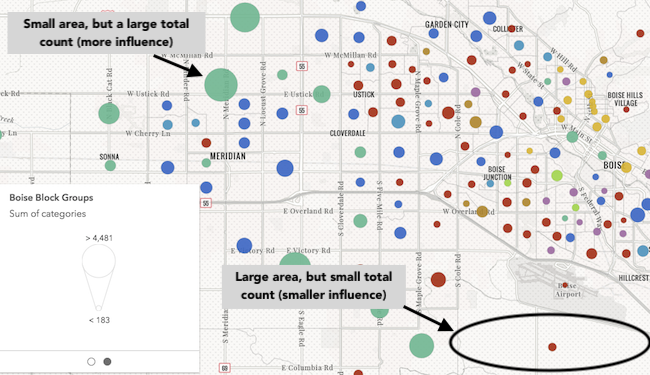
* set `includeSizeVariable` to `true` to change the size of each feature to indicate how influential the feature is compared to the entire layer
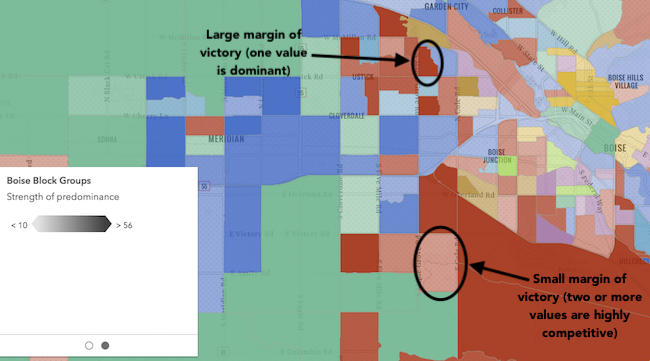
* as a whole. You can also set `includeOpacityVariable` to `true` to add opacity to each feature depending on how
* strong the predominant field is compared to all the other fields. For the example above, the feature would likely be
* opaque since Soybeans beats all other features combined by a wide margin. If the Soybean total were still the highest, but only 301,
* then the feature would be very transparent, indicating the Soybean total wins, but not by a wide margin.
*
* Other options are provided for convenience for more involved custom visualization authoring
* applications.
*
* @param parameters - Input parameters for generating a predominance visualization based on a set of competing field(s).
* @returns Resolves to an instance of [RendererResult](https://developers.arcgis.com/javascript/latest/references/core/smartMapping/renderers/predominance/#RendererResult).
* @example
* const layer = new FeatureLayer({
* url: "https://services.arcgis.com/V6ZHFr6zdgNZuVG0/arcgis/rest/services/USA_County_Crops_2007/FeatureServer/0"
* });
*
* // will create a visualization of predominant crop by U.S. county
*
* const parameter = {
* layer: layer,
* view: view,
* fields: [{
* name: "M217_07",
* label: "Vegetables"
* }, {
* name: "M188_07",
* label: "Cotton"
* }, {
* name: "M172_07",
* label: "Wheat"
* }, {
* name: "M193_07",
* label: "Soybeans"
* }, {
* name: "M163_07",
* label: "Corn"
* }],
* includeOpacityInfo: true
* };
*
* // when the promise resolves, apply the renderer to the layer
* predominanceRendererCreator.createRenderer(parameters)
* .then(function(response){
* layer.renderer = response.renderer;
* });
*/
export function createRenderer(parameters: RendererParameters): Promise<RendererResult>;
export type SymbolType = "2d" | "3d-flat" | "3d-volumetric" | "3d-volumetric-uniform";
export type ColorMixModeType = "tint" | "replace" | "multiply";
export interface FieldInfo {
/** The name of a numeric field. */
name: string;
/**
* The label describing the field name (or category) in the legend. This is should be used
* if the given field doesn't have an intuitive field name. For example, for a field named `dem` representing the total vote count
* for the Democratic party, you can set the label to `Democrat` to clarify the name of the category in the final visualization.
*/
label?: string | null;
}
export interface RendererParameters extends AbortOptions {
/**
* The layer
* for which the visualization is generated. When a client-side layer type is provided, attribute and spatial statistics are calculated
* only from features in the view's extent. When a server-side layer type is provided, the statistics
* are calculated from the entire layer.
*/
layer?: FeatureLikeLayerOrAdapter | null;
/**
* A set of competing numeric fields used as the basis of the predominance visualization. For example,
* if creating an election map, you would indicate the names of each field representing the candidate or political party where
* total votes are stored.
*/
fields?: FieldInfo[] | null;
/**
* Provides options for modifying [Legend](https://developers.arcgis.com/javascript/latest/references/map-components/components/arcgis-legend/) properties describing
* the visualization.
*/
legendOptions?: RendererLegendTitleOption | null;
/**
* In authoring apps,
* the user may select a pre-defined predominance scheme. Pass the scheme object to this property to avoid getting one based on the background of the `view`.
*/
predominanceScheme?: PredominanceScheme | null;
/**
* Enables the `defaultSymbol` on the renderer and assigns it to features
* with no value.
*
* @default true
*/
defaultSymbolEnabled?: boolean | null;
/**
* Indicates whether to include data-driven opacity in the final renderer. If `true`, features
* where the predominant value beats all others by a large margin are given a high opacity. Features where the predominant value beats
* others by a small margin will be assigned a low opacity, indicating that while the feature has a winning value, it doesn't win by much.
*
* 
*/
includeOpacityVariable?: boolean | null;
/**
* Indicates whether to include data-driven size in the final renderer. If `true`, features will be assigned
* a sized based on the sum of all competing values in the `fields` param. Features with small total counts will be sized with small icons or lines depending on
* the geometry type of the layer, and features with large total counts will be sized with large icons or lines. Enabling this option
* is good for visualizing how influential a particular feature is compared to the dataset as a whole. It removes bias introduced by
* features with large geographic areas, but relatively small data values.
*
* 
*/
includeSizeVariable?: boolean | null;
/**
* Indicates how values should be sorted in the [Legend](https://developers.arcgis.com/javascript/latest/references/map-components/components/arcgis-legend/).
* See the table below for information about values that may be passed to this parameter.
* Possible Value | Description
* ---------------|------------
* count | Unique values/types will be sorted from highest to lowest based on the count of features that fall in each category.
* value | Unique values/types will be sorted in the order they were specified in the `fields` parameter.
*
* @default count
*/
sortBy?: typeCreator.SortBy | null;
/**
* Only for polygon layers. Indicates whether the
* polygon outline width should vary based on view scale. When set, a valid [MapView](https://developers.arcgis.com/javascript/latest/references/core/views/MapView/)
* instance must be provided in the `view` parameter. This option is not supported for 3D
* [SceneViews](https://developers.arcgis.com/javascript/latest/references/core/views/SceneView/).
*
* @default false
*/
outlineOptimizationEnabled?: boolean | null;
/**
* Indicates whether
* symbol sizes should vary based on view scale. When set, a valid [MapView](https://developers.arcgis.com/javascript/latest/references/core/views/MapView/)
* instance must be provided in the `view` parameter. This option is not supported for 3D
* [SceneViews](https://developers.arcgis.com/javascript/latest/references/core/views/SceneView/).
*
* @default false
*/
sizeOptimizationEnabled?: boolean | null;
/**
* Indicates whether the generated renderer is for a binning or clustering visualization.
* If `true`, then the input field(s) in this method should refer to [aggregate fields](https://developers.arcgis.com/javascript/latest/references/core/layers/support/AggregateField/) defined in the `featureReduction` property of the layer.
*/
forBinning?: boolean | null;
/**
* When defined, only features included in the filter
* are considered in the attribute and spatial statistics calculations when determining the final renderer.
* This is useful when a lot of variation exists in the data
* that could result in undesired data ranges. A common use case would be to set a filter that only
* includes features in the current extent of the view where the data is most likely to be viewed. Currently, only
* geometry filters with an `intersects` spatial relationship are supported. All other filter types (including `where`) are ignored.
*
* @since 4.31
*/
filter?: FeatureFilter | null;
/**
* The type of symbol to generate. This depends on the view
* in which you are working and the desired visualization. This parameter does not need to be specified for layers
* with a `mesh` geometry type. Possible values are described below.
*
* | Value | Description |
* | ----- | ----------- |
* | 2d | Generates a visualization using 2D symbols such as [SimpleMarkerSymbol](https://developers.arcgis.com/javascript/latest/references/core/symbols/SimpleMarkerSymbol/), [SimpleLineSymbol](https://developers.arcgis.com/javascript/latest/references/core/symbols/SimpleLineSymbol/), or [SimpleFillSymbol](https://developers.arcgis.com/javascript/latest/references/core/symbols/SimpleFillSymbol/). Use this option if generating a visualization for data in a [MapView](https://developers.arcgis.com/javascript/latest/references/core/views/MapView/). |
* | 3d-flat | Generates a visualization using 3D symbols with flat symbol layers such as [IconSymbol3DLayer](https://developers.arcgis.com/javascript/latest/references/core/symbols/IconSymbol3DLayer/), [LineSymbol3DLayer](https://developers.arcgis.com/javascript/latest/references/core/symbols/LineSymbol3DLayer/), or [FillSymbol3DLayer](https://developers.arcgis.com/javascript/latest/references/core/symbols/FillSymbol3DLayer/). Use this option if generating a 2D visualization for data in a [SceneView](https://developers.arcgis.com/javascript/latest/references/core/views/SceneView/). |
* | 3d-volumetric | Generates a visualization using 3D symbols with volumetric symbol layers such as [ObjectSymbol3DLayer](https://developers.arcgis.com/javascript/latest/references/core/symbols/ObjectSymbol3DLayer/), [PathSymbol3DLayer](https://developers.arcgis.com/javascript/latest/references/core/symbols/PathSymbol3DLayer/), or [ExtrudeSymbol3DLayer](https://developers.arcgis.com/javascript/latest/references/core/symbols/ExtrudeSymbol3DLayer/). Use this option if generating a 3D visualization for data in a [SceneView](https://developers.arcgis.com/javascript/latest/references/core/views/SceneView/). A SceneView instance must be provided to the `view` parameter if this option is used. |
* | 3d-volumetric-uniform | Generates a visualization using uniformly sized 3D symbols with volumetric symbol layers. Use this option if generating a 3D visualization for data in a [SceneView](https://developers.arcgis.com/javascript/latest/references/core/views/SceneView/) and the symbol should be sizes uniformly, for example with spheres. A SceneView instance must be provided to the `view` parameter if this option is used. |
*
* @default 2d
*/
symbolType?: SymbolType | null;
/**
* **This option only applies to generating renderers for mesh SceneLayers**.
* Specifies how the symbol's color is applied to the geometry color/texture. See the documentation in
* [FillSymbol3DLayer.material](https://developers.arcgis.com/javascript/latest/references/core/symbols/FillSymbol3DLayer/#material) for more context.
* See the table below for possible values.
*
* Value | Description
* ------|------------
* tint | Applies the symbol `color` to the desaturated geometry/texture color.
* replace | Removes the geometry/texture color and applies the symbol `color`.
* multiply | Multiplies geometry/texture color value with the symbol `color` value. The result is a darker color. Multiplying with white keeps the geometry color the same.
*
* @default replace
*/
colorMixMode?: ColorMixModeType | null;
/** The view instance in which the visualization will be rendered. */
view?: MapViewOrSceneView | null;
}
/**
* The result object of the [createRenderer()](https://developers.arcgis.com/javascript/latest/references/core/smartMapping/renderers/predominance/#createRenderer) method. See the table
* below for details of each property.
*/
export interface RendererResult {
/**
* The unique value renderer object representing
* the predominance visualization. Set this on a layer's `renderer` property to update its visualization.
*/
renderer: UniqueValueRenderer;
/**
* An array of objects describing the value, symbol, and count of
* each unique type or category represented in the renderer.
*/
predominantCategoryInfos: UniqueValueInfo[];
/**
* An array of objects describing the values or categories
* excluded from consideration in visualizing data from the given fields. The specification of each object matches
* that of the objects specified in the `predominantCategoryInfos` property.
*/
excludedCategoryInfos: UniqueValueInfo[];
/** The predominance scheme used by the renderer. */
predominanceScheme: PredominanceScheme;
/**
* A size visual
* variable representing the total count of all fields included in the predominance visualization. This is included
* if the `includeSizeVariable` parameter is true.
*/
size?: sizeCreator.VisualVariableResult | null;
/**
* An opacity visual
* variable representing the percentage of the total count comprised by the predominant value of all fields. This
* variable indicates the strength of a particular value's predominance compared to the other values.
*/
opacity?: opacityCreator.VisualVariableResult | null;
/** The ID of the basemap used to determine the optimal fill color of the features. */
basemapId?: string | null;
/** Indicates whether the average color of the input view's basemap is `light` or `dark`. */
basemapTheme?: BasemapTheme | null;
}