@arcgis/core
Version:
ArcGIS Maps SDK for JavaScript: A complete 2D and 3D mapping and data visualization API
391 lines (389 loc) • 25 kB
TypeScript
import type VisualVariable from "./VisualVariable.js";
import type SizeStop from "./support/SizeStop.js";
import type SizeVariableLegendOptions from "./support/SizeVariableLegendOptions.js";
import type { SizeVariableUnit, SizeVariableAxis, SizeVariableRepresentation } from "../types.js";
import type { VisualVariableProperties } from "./VisualVariable.js";
import type { SizeVariableLegendOptionsProperties } from "./support/SizeVariableLegendOptions.js";
import type { SizeStopProperties } from "./support/SizeStop.js";
export interface SizeVariableProperties extends VisualVariableProperties, Partial<Pick<SizeVariable, "axis" | "maxDataValue" | "minDataValue" | "normalizationField" | "target" | "useSymbolValue" | "valueRepresentation" | "valueUnit">> {
/**
* An object providing options for displaying the visual variable in
* the [Legend](https://developers.arcgis.com/javascript/latest/references/map-components/components/arcgis-legend/).
*/
legendOptions?: SizeVariableLegendOptionsProperties | null;
/**
* The size used to render a feature containing the maximum data value.
*
* * When setting a number, sizes are expressed in points for all 2D symbols and 3D flat symbol layers; size is
* expressed in meters for all 3D volumetric symbols.
* * String values are only supported for 2D symbols and 3D flat symbol layers. Strings may specify size in
* either points or pixels (e.g. `minSize: "16pt"`, `minSize: "12px"`).
* * When an object is used, the
* size of features whose data value (defined in [field](https://developers.arcgis.com/javascript/latest/references/core/renderers/visualVariables/SizeVariable/#field) or [valueExpression](https://developers.arcgis.com/javascript/latest/references/core/renderers/visualVariables/SizeVariable/#valueExpression))
* is greater than or equal to the [maxDataValue](https://developers.arcgis.com/javascript/latest/references/core/renderers/visualVariables/SizeVariable/#maxDataValue) for the given view scale.
*/
maxSize?: number | SizeVariableProperties | string | null;
/**
* The size used to render a feature containing the minimum data value.
*
* * When setting a number, sizes are expressed in points for all 2D symbols and 3D flat symbol layers; size is
* expressed in meters for all 3D volumetric symbols.
* * String values are only supported for 2D symbols and 3D flat symbol layers. Strings may specify size in
* either points or pixels (e.g. `minSize: "16pt"`, `minSize: "12px"`).
* * When an object is used, the
* size of features whose data value (defined in [field](https://developers.arcgis.com/javascript/latest/references/core/renderers/visualVariables/SizeVariable/#field) or [valueExpression](https://developers.arcgis.com/javascript/latest/references/core/renderers/visualVariables/SizeVariable/#valueExpression))
* is greater than or equal to the [minDataValue](https://developers.arcgis.com/javascript/latest/references/core/renderers/visualVariables/SizeVariable/#minDataValue) for the given view scale.
*/
minSize?: number | SizeVariableProperties | string | null;
/**
* An array of objects that defines the mapping of data values returned from [field](https://developers.arcgis.com/javascript/latest/references/core/renderers/visualVariables/SizeVariable/#field) or
* [valueExpression](https://developers.arcgis.com/javascript/latest/references/core/renderers/visualVariables/SizeVariable/#valueExpression) to icon sizes. You must specify 2 - 6 stops. The stops must be listed in ascending order
* based on the value of the `value` property in each stop.
*/
stops?: SizeStopProperties[] | null;
}
/**
* The size visual variable defines the size of individual features in a layer based
* on a numeric (often thematic) value. This value comes from one of the following:
*
* * An attribute [field](https://developers.arcgis.com/javascript/latest/references/core/renderers/visualVariables/SizeVariable/#field)
* * The value of an attribute `field` divided by a [normalizationField](https://developers.arcgis.com/javascript/latest/references/core/renderers/visualVariables/SizeVariable/#normalizationField)
* * A value returned from an [Arcade expression](https://developers.arcgis.com/javascript/latest/arcade/) specified in [valueExpression](https://developers.arcgis.com/javascript/latest/references/core/renderers/visualVariables/SizeVariable/#valueExpression).
*
* Size is defined in the form of a continuous ramp, which may be applied to
* renderers in either a [MapView](https://developers.arcgis.com/javascript/latest/references/core/views/MapView/) or a
* [SceneView](https://developers.arcgis.com/javascript/latest/references/core/views/SceneView/).
*
* Symbol size may be applied either thematically, or literally using real-world units. See the example snippets below
* for details about each potential use of a size visual variable:
*
* **Bounded proportional symbols**
*
* Symbol sizes are generally proportional to data values, but bounded by min and max sizes.
* Intermediate sizes are linearly interpolated between the [minSize](https://developers.arcgis.com/javascript/latest/references/core/renderers/visualVariables/SizeVariable/#minSize) and [maxSize](https://developers.arcgis.com/javascript/latest/references/core/renderers/visualVariables/SizeVariable/#maxSize)
* depending on the [minDataValue](https://developers.arcgis.com/javascript/latest/references/core/renderers/visualVariables/SizeVariable/#minDataValue) and [maxDataValue](https://developers.arcgis.com/javascript/latest/references/core/renderers/visualVariables/SizeVariable/#maxDataValue).
*
* ```js
* // features with WIND_SPEED of 0 will be rendered with a size of 8pts
* // features with WIND_SPEED of 60 will be rendered with a size of 40pts
* // features with WIND_SPEED between 0 and 60 will be rendered with sizes
* // between 8 and 40 points, interpolated linearly
*
* const sizeVisualVariable = {
* type: "size",
* field: "WIND_SPEED",
* minDataValue: 0,
* maxDataValue: 60,
* minSize: 8,
* maxSize: 40
* };
* renderer.visualVariables = [ sizeVisualVariable ];
* ```
*
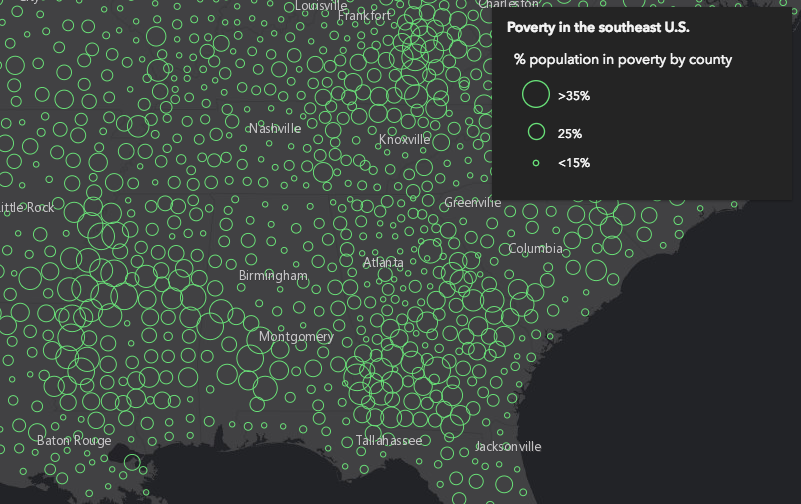
* **Intermediate bounded proportional symbols**
*
* Symbol sizes are generally proportional to data values, but may be defined with 2-6 stops at which symbol sizes are mapped to
* specific data values (and interpolated between those stops). This is a variation on the bounded proportional symbols, and is good
* for emphasizing certain ranges of data values. It also provides you with control over the legend labels.
*
* ```js
* // features with POP_POVERTY / TOTPOP_CY = 0.15 will be rendered with a size of 4pts
* // features with POP_POVERTY / TOTPOP_CY = 0.25 will be rendered with a size of 12pts
* // features with POP_POVERTY / TOTPOP_CY = 0.35 will be rendered with a size of 24pts
* // features with POP_POVERTY / TOTPOP_CY between those values will be rendered
* // will be rendered with sizes between the defined stops, interpolated linearly
* // the legend will show the labels defined in each stop
*
* renderer.visualVariables = [{
* type: "size",
* field: "POP_POVERTY",
* normalizationField: "TOTPOP_CY",
* legendOptions: {
* title: "% population in poverty by county"
* },
* stops: [
* { value: 0.15, size: 4, label: "<15%" },
* { value: 0.25, size: 12, label: "25%" },
* { value: 0.35, size: 24, label: ">35%" }
* ]
* }];
* ```
*
* **Scale-dependent stops**
*
* Symbol sizes vary depending on the view scale and are otherwise not data-driven. This is used
* to create symbols with all the same sizes at a given scale, but the symbol sizes change as the user zooms in and out.
* It may also be used to define scale-dependent stops for polygon outline widths.
*
* ```js
* // all features will be rendered with the same outline width at a given view scale
* // outline width will shrink as the user zooms out (until it eventually disappears),
* // and grow as the user zooms in.
*
* const sizeVisualVariable = {
* type: "size",
* valueExpression: "$view.scale",
* target: "outline",
* stops: [
* { size: 2, value: 1155581.108577 },
* { size: 1, value: 9244648.868618 },
* { size: 0.5, value: 73957190.948944 },
* { size: 0, value: 591657527.591555 }
* ]
* };
* renderer.visualVariables = [ sizeVisualVariable ];
* ```
*
* **Scale-dependent bounded proportional symbols**
*
* Symbol sizes vary depending on the view scale, but are also data-driven.
* Sizes are bounded by [min](https://developers.arcgis.com/javascript/latest/references/core/renderers/visualVariables/SizeVariable/#minDataValue) and [max](https://developers.arcgis.com/javascript/latest/references/core/renderers/visualVariables/SizeVariable/#maxDataValue) data values, but the
* [minSize](https://developers.arcgis.com/javascript/latest/references/core/renderers/visualVariables/SizeVariable/#minSize) and [maxSize](https://developers.arcgis.com/javascript/latest/references/core/renderers/visualVariables/SizeVariable/#maxSize) (and
* interpolated sizes) vary based on the scale of the [MapView.scale](https://developers.arcgis.com/javascript/latest/references/core/views/MapView/#scale).
* This doesn't apply to a 3D [SceneView](https://developers.arcgis.com/javascript/latest/references/core/views/SceneView/).
*
* ```js
* // features are rendered as bounded proportional symbols based on the poverty rate, but the overall
* // sizes of the symbols will grow as the user zooms in and shrink as the user zooms out, providing
* // a cleaner visualization of the data at each scale.
*
* // features with poverty rates of 15% will be rendered with a size of 3pts at scale 1:15,886,548
* // and a size of 12pts at scale 1:1,128
* // features with poverty rates of 45% will be rendered with a size of 32pts at scale 1:15,886,548
* // and a size of 60pts at scale 1:1,128
* // features with poverty rates between 15-45% will be rendered with sizes between those values,
* // depending on the view scale.
*
* const sizeVisualVariable = {
* type: "size",
* valueExpression: "( $feature.POP_POVERTY / $feature.TOTPOP_CY ) * 100",
* legendOptions: {
* title: "% population living in poverty"
* },
* maxDataValue: 45,
* // the max symbol size will map to the minDataValue at an
* // interpolated size depending on the current view scale
* maxSize: {
* type: "size",
* valueExpression: "$view.scale",
* stops: [
* { size: 60, value: 1128 },
* { size: 50, value: 36111 },
* { size: 37.5, value: 43334 },
* { size: 32, value: 15886548 }
* ]
* },
* minDataValue: 15,
* // the min symbol size will map to the minDataValue at an
* // interpolated size depending on the current view scale
* minSize: {
* type: "size",
* valueExpression: "$view.scale",
* stops: [
* { size: 12, value: 1128 },
* { size: 8, value: 36111 },
* { size: 5, value: 43334 },
* { size: 3, value: 15886548 }
* ]
* }
* };
* renderer.visualVariables = [ sizeVisualVariable ];
* ```
*
* **RealWorldSize**
*
* Symbol sizes are determined based on real-world measurements and units, not thematic values and screen units.
* This is useful for visualizing features with realistic sizes in either a [MapView](https://developers.arcgis.com/javascript/latest/references/core/views/MapView/) or a
* [SceneView](https://developers.arcgis.com/javascript/latest/references/core/views/SceneView/). It can also be used for thematic volumetric visualizations in 3D.
*
* ```js
* // features will be rendered with a height based on the "Height" attribute field
* // and a width and depth based on the "Width_EW" and "Width_NS" attribute fields
*
* const treeSizeVisualVariables = [{
* type: "size",
* axis: "height",
* field: "Height", // tree height
* valueUnit: "feet"
* }, {
* type: "size",
* axis: "width",
* field: "Width_EW", // crown diameter from east to west
* valueUnit: "feet"
* }, {
* type: "size",
* axis: "depth",
* field: "Width_NS", // crown diameter from north to south
* valueUnit: "feet"
* }];
* renderer.visualVariables = treeSizeVisualVariables;
* ```
*
* Thematic Icon size | Thematic extrusion | Real world size
* -------------------|--------------------|-----------------
* [](https://developers.arcgis.com/javascript/latest/sample-code/visualization-vv-size/) | [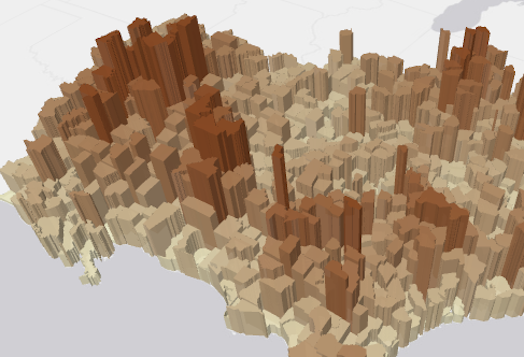](https://developers.arcgis.com/javascript/latest/sample-code/visualization-vv-extrusion/) | [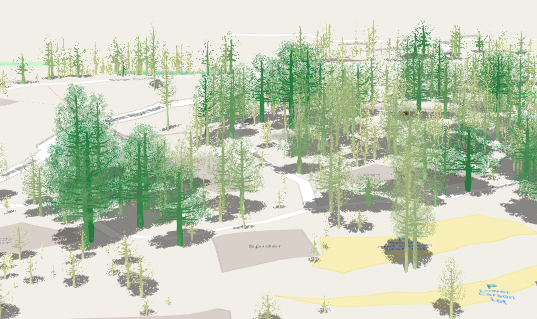](https://developers.arcgis.com/javascript/latest/sample-code/visualization-trees-realistic/)
*
* For [CIMSymbol](https://developers.arcgis.com/javascript/latest/references/core/symbols/CIMSymbol/)s, the size value is only applied to the largest symbol layer instead of the full symbol.
* All other symbol layers will scale proportionally.
*
* @since 4.10
* @see [Sample - Continuous size](https://developers.arcgis.com/javascript/latest/sample-code/visualization-vv-size/)
* @see [Sample - Visualize features thematically with extrusion](https://developers.arcgis.com/javascript/latest/sample-code/visualization-vv-extrusion/)
* @see [Sample - Scale feature sizes based on real world sizes (2D)](https://developers.arcgis.com/javascript/latest/sample-code/visualization-trees-2d/)
* @see [Sample - Visualize features with realistic 3D symbols](https://developers.arcgis.com/javascript/latest/sample-code/visualization-trees-realistic/)
* @see [Sample - Extrude building footprints based on real world heights](https://developers.arcgis.com/javascript/latest/sample-code/visualization-buildings-3d/)
*/
export default class SizeVariable extends VisualVariable {
constructor(properties?: SizeVariableProperties);
/**
* Only applicable when working in a [SceneView](https://developers.arcgis.com/javascript/latest/references/core/views/SceneView/).
* Defines the axis the size visual variable should be applied to when rendering features with an
* [ObjectSymbol3DLayer](https://developers.arcgis.com/javascript/latest/references/core/symbols/ObjectSymbol3DLayer/). See the
* [local scene sample](https://developers.arcgis.com/javascript/latest/sample-code/scene-local/) for an example of this.
*
* Possible Value | Description
* ----------------|-----------
* width | The diameter of the symbol from east to west.
* depth | The diameter of the symbol from north to south.
* height | The height of the symbol.
* width-and-depth | Applies the size visual variable to both width and depth axes.
* all | Applies the size visual variable to all axes.
*
* @default "all"
*/
accessor axis: SizeVariableAxis;
/**
* An object providing options for displaying the visual variable in
* the [Legend](https://developers.arcgis.com/javascript/latest/references/map-components/components/arcgis-legend/).
*/
get legendOptions(): SizeVariableLegendOptions | null | undefined;
set legendOptions(value: SizeVariableLegendOptionsProperties | null | undefined);
/**
* The maximum data value used in the size ramp. Features whose [field](https://developers.arcgis.com/javascript/latest/references/core/renderers/visualVariables/SizeVariable/#field) or
* [valueExpression](https://developers.arcgis.com/javascript/latest/references/core/renderers/visualVariables/SizeVariable/#valueExpression) return a value equal to or higher than
* the value defined in `maxDataValue` will be rendered at the size defined in [maxSize](https://developers.arcgis.com/javascript/latest/references/core/renderers/visualVariables/SizeVariable/#maxSize).
*/
accessor maxDataValue: number | null | undefined;
/**
* The size used to render a feature containing the maximum data value.
*
* * When setting a number, sizes are expressed in points for all 2D symbols and 3D flat symbol layers; size is
* expressed in meters for all 3D volumetric symbols.
* * String values are only supported for 2D symbols and 3D flat symbol layers. Strings may specify size in
* either points or pixels (e.g. `minSize: "16pt"`, `minSize: "12px"`).
* * When an object is used, the
* size of features whose data value (defined in [field](https://developers.arcgis.com/javascript/latest/references/core/renderers/visualVariables/SizeVariable/#field) or [valueExpression](https://developers.arcgis.com/javascript/latest/references/core/renderers/visualVariables/SizeVariable/#valueExpression))
* is greater than or equal to the [maxDataValue](https://developers.arcgis.com/javascript/latest/references/core/renderers/visualVariables/SizeVariable/#maxDataValue) for the given view scale.
*/
get maxSize(): number | SizeVariable | null | undefined;
set maxSize(value: number | SizeVariableProperties | string | null | undefined);
/**
* The minimum data value used in the size ramp. Features whose [field](https://developers.arcgis.com/javascript/latest/references/core/renderers/visualVariables/SizeVariable/#field) or
* [valueExpression](https://developers.arcgis.com/javascript/latest/references/core/renderers/visualVariables/SizeVariable/#valueExpression) return a value equal to or lower than
* the value defined in `maxDataValue` will be rendered at the size defined in [minSize](https://developers.arcgis.com/javascript/latest/references/core/renderers/visualVariables/SizeVariable/#minSize).
*/
accessor minDataValue: number | null | undefined;
/**
* The size used to render a feature containing the minimum data value.
*
* * When setting a number, sizes are expressed in points for all 2D symbols and 3D flat symbol layers; size is
* expressed in meters for all 3D volumetric symbols.
* * String values are only supported for 2D symbols and 3D flat symbol layers. Strings may specify size in
* either points or pixels (e.g. `minSize: "16pt"`, `minSize: "12px"`).
* * When an object is used, the
* size of features whose data value (defined in [field](https://developers.arcgis.com/javascript/latest/references/core/renderers/visualVariables/SizeVariable/#field) or [valueExpression](https://developers.arcgis.com/javascript/latest/references/core/renderers/visualVariables/SizeVariable/#valueExpression))
* is greater than or equal to the [minDataValue](https://developers.arcgis.com/javascript/latest/references/core/renderers/visualVariables/SizeVariable/#minDataValue) for the given view scale.
*/
get minSize(): number | SizeVariable | null | undefined;
set minSize(value: number | SizeVariableProperties | string | null | undefined);
/**
* The name of the numeric attribute field used to normalize
* the data in the given [field](https://developers.arcgis.com/javascript/latest/references/core/renderers/visualVariables/SizeVariable/#field). If this field is used, then the values in [maxDataValue](https://developers.arcgis.com/javascript/latest/references/core/renderers/visualVariables/SizeVariable/#maxDataValue)
* and [minDataValue](https://developers.arcgis.com/javascript/latest/references/core/renderers/visualVariables/SizeVariable/#minDataValue) or [stops](https://developers.arcgis.com/javascript/latest/references/core/renderers/visualVariables/SizeVariable/#stops) should be
* normalized as percentages or ratios.
*/
accessor normalizationField: string | null | undefined;
/**
* An array of objects that defines the mapping of data values returned from [field](https://developers.arcgis.com/javascript/latest/references/core/renderers/visualVariables/SizeVariable/#field) or
* [valueExpression](https://developers.arcgis.com/javascript/latest/references/core/renderers/visualVariables/SizeVariable/#valueExpression) to icon sizes. You must specify 2 - 6 stops. The stops must be listed in ascending order
* based on the value of the `value` property in each stop.
*/
get stops(): SizeStop[] | null | undefined;
set stops(value: SizeStopProperties[] | null | undefined);
/**
* This value must be `outline` when scaling polygon outline widths
* based on the view scale. If scale-dependent icons are desired, then this property should be ignored.
*/
accessor target: "outline" | null | undefined;
/** The visual variable type. */
get type(): "size";
/**
* When setting a size visual variable on a renderer using an
* [ObjectSymbol3DLayer](https://developers.arcgis.com/javascript/latest/references/core/symbols/ObjectSymbol3DLayer/), this property indicates whether to apply the value
* defined by the [ObjectSymbol3DLayer.height](https://developers.arcgis.com/javascript/latest/references/core/symbols/ObjectSymbol3DLayer/#height),
* [ObjectSymbol3DLayer.width](https://developers.arcgis.com/javascript/latest/references/core/symbols/ObjectSymbol3DLayer/#width), or
* [ObjectSymbol3DLayer.depth](https://developers.arcgis.com/javascript/latest/references/core/symbols/ObjectSymbol3DLayer/#depth) properties to the corresponding [axis](https://developers.arcgis.com/javascript/latest/references/core/renderers/visualVariables/SizeVariable/#axis) of
* this visual variable instead of proportionally scaling this axis' value.
* [View an example](https://developers.arcgis.com/javascript/latest/sample-code/visualization-multivariate-3d/) of this.
*/
accessor useSymbolValue: boolean | null | undefined;
/**
* Specifies how to apply the data value when mapping real-world sizes. See table below for supported values.
*
* Value | Description
* ------|-----------
* radius | The point data value represents the radius of a circular feature.
* diameter | The point data value represents the diameter of a circular feature.
* area | The point data value represents the area of a feature.
* width | The polyline data value represents the width of a line.
* distance | The polyline data value represents the distance from the center line (one half of the width).
*
* > [!WARNING]
* >
* > **Known Limitations**
* >
* > * This property is not supported for flat (2D) line symbols driven by real world sizes in 3D [SceneView](https://developers.arcgis.com/javascript/latest/references/core/views/SceneView/)s.
* > * Data values must refer to the planar size of the feature in the units of the view's spatial reference.
*/
accessor valueRepresentation: SizeVariableRepresentation | null | undefined;
/**
* Indicates the unit of measurement used to interpret the value returned by [field](https://developers.arcgis.com/javascript/latest/references/core/renderers/visualVariables/SizeVariable/#field) or [valueExpression](https://developers.arcgis.com/javascript/latest/references/core/renderers/visualVariables/SizeVariable/#valueExpression).
* For 3D volumetric symbols the default is `meters`. This property should not be used if the data value
* represents a thematic quantity (e.g. traffic count, census data, etc.).
*
* > [!WARNING]
* >
* > **Known Limitations**
* >
* > * This property is not supported for flat (2D) line symbols driven by real world sizes in 3D [SceneView](https://developers.arcgis.com/javascript/latest/references/core/views/SceneView/)s.
* > * Data values must refer to the planar size of the feature in the units of the view's spatial reference.
*/
accessor valueUnit: SizeVariableUnit;
/**
* Creates a deep clone of the SizeVisualVariable.
*
* @returns A deep clone of the size
* visual variable that invoked this method.
* @example
* // Creates a deep clone of the visual variable
* let renderer = renderer.visualVariables[0].clone();
*/
clone(): SizeVariable;
/**
* Modifies the SizeVariable in place by flipping the sizes in the [stops](https://developers.arcgis.com/javascript/latest/references/core/renderers/visualVariables/SizeVariable/#stops).
* This is designed for scenarios where you want small numbers (such as rankings 1, 2, 3) to
* be rendered with larger icons. This function is particularly useful for
* flipping the sizes of a SizeVariable after it has been returned from a method in the
* [sizeRendererCreator](https://developers.arcgis.com/javascript/latest/references/core/smartMapping/renderers/size/) module.
*
* @example
* // flips the size ramp when a checkbox is clicked in the app UI
* checkbox.addEventListener("change", function() {
* const renderer = layer.renderer.clone();
* const sizeVariable = renderer.visualVariables[0];
* sizeVariable.flipSizes();
* layer.renderer = renderer;
* });
*/
flipSizes(): this;
}