@arcgis/core
Version:
ArcGIS Maps SDK for JavaScript: A complete 2D and 3D mapping and data visualization API
79 lines (77 loc) • 3.94 kB
TypeScript
import type VisualVariable from "./VisualVariable.js";
import type OpacityStop from "./support/OpacityStop.js";
import type { VisualVariableProperties } from "./VisualVariable.js";
import type { OpacityStopProperties } from "./support/OpacityStop.js";
export interface OpacityVariableProperties extends VisualVariableProperties, Partial<Pick<OpacityVariable, "normalizationField">> {
/**
* An array of objects that defines the opacity to apply to features in a layer in a sequence of stops.
* You must specify 2 - 8 stops. In most cases, no more than five are needed. Features with data values that fall
* between the given stops will be assigned opacity values
* linearly interpolated along the ramp in relation to the stop values. The stops must be listed in ascending order
* based on the value of the `value` property in each stop.
*/
stops?: OpacityStopProperties[];
}
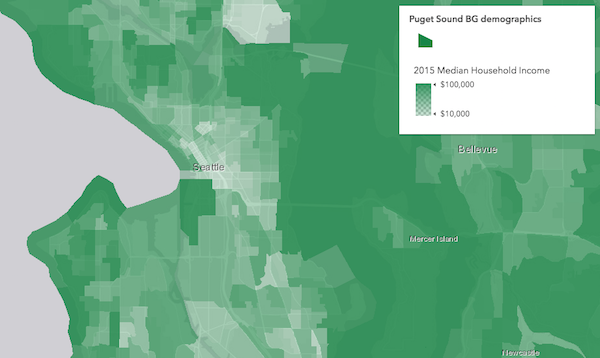
/**
* The opacity visual variable defines the opacity of each feature's symbol based on a numeric
* [field](https://developers.arcgis.com/javascript/latest/references/core/renderers/visualVariables/OpacityVariable/#field) value or number returned from an [expression](https://developers.arcgis.com/javascript/latest/references/core/renderers/visualVariables/OpacityVariable/#valueExpression).
* You must specify [stops](https://developers.arcgis.com/javascript/latest/references/core/renderers/visualVariables/OpacityVariable/#stops) to construct the opacity ramp.
*
* [](https://developers.arcgis.com/javascript/latest/sample-code/visualization-vv-opacity/)
*
* @since 4.10
* @see [Sample - Add transparency to features based on field values](https://developers.arcgis.com/javascript/latest/sample-code/visualization-vv-opacity/)
* @example
* const opacityVisualVariable = {
* type: "opacity",
* field: "PERCENTAGE",
* // maps data values to opacity values
* stops: [
* { value: 0, opacity: 0.1 },
* { value: 100, opacity: 1 }
* ]
* };
* renderer.visualVariables = [ opacityVisualVariable ];
* @example
* // opacity visual variable with arcade
* const opacityVisualVariable = {
* type: "opacity",
* // calculate a value to visualize with opacity
* valueExpression: "( $feature.TOT_VOTES / $feature.REG_VOTERS ) * 100",
* stops: [
* { value: 30, opacity: 0.15 },
* { value: 70, opacity: 0.15 }
* ]
* };
* renderer.visualVariables = [ opacityVisualVariable ];
*/
export default class OpacityVariable extends VisualVariable {
constructor(properties?: OpacityVariableProperties);
/**
* Name of the numeric attribute field by which to normalize
* the data. If this field is used, then the values in [stops](https://developers.arcgis.com/javascript/latest/references/core/renderers/visualVariables/OpacityVariable/#stops) should be
* normalized as percentages or ratios.
*/
accessor normalizationField: string | null | undefined;
/**
* An array of objects that defines the opacity to apply to features in a layer in a sequence of stops.
* You must specify 2 - 8 stops. In most cases, no more than five are needed. Features with data values that fall
* between the given stops will be assigned opacity values
* linearly interpolated along the ramp in relation to the stop values. The stops must be listed in ascending order
* based on the value of the `value` property in each stop.
*/
get stops(): OpacityStop[];
set stops(value: OpacityStopProperties[]);
/** The visual variable type. */
get type(): "opacity";
/**
* Creates a deep clone of the OpacityVariable.
*
* @returns A deep clone of the opacity
* visual variable that invoked this method.
* @example
* // Creates a deep clone of the visual variable
* let renderer = renderer.visualVariables[0].clone();
*/
clone(): OpacityVariable;
}