@arcgis/core
Version:
ArcGIS Maps SDK for JavaScript: A complete 2D and 3D mapping and data visualization API
167 lines (165 loc) • 11.8 kB
TypeScript
import type { VisualVariable } from "../types.js";
import type { RotationVariableProperties } from "../visualVariables/RotationVariable.js";
import type { OpacityVariableProperties } from "../visualVariables/OpacityVariable.js";
import type { SizeVariableProperties } from "../visualVariables/SizeVariable.js";
import type { ColorVariableProperties } from "../visualVariables/ColorVariable.js";
export interface VisualVariablesMixinProperties {
/**
* An array of [VisualVariable](https://developers.arcgis.com/javascript/latest/references/core/renderers/visualVariables/VisualVariable/) objects.
* Each object must indicate
* the type of visual variable to apply (e.g. [ColorVisualVariable](https://developers.arcgis.com/javascript/latest/references/core/renderers/visualVariables/ColorVariable/),
* [SizeVisualVariable](https://developers.arcgis.com/javascript/latest/references/core/renderers/visualVariables/SizeVariable/), [OpacityVisualVariable](https://developers.arcgis.com/javascript/latest/references/core/renderers/visualVariables/OpacityVariable/),
* [RotationVisualVariable](https://developers.arcgis.com/javascript/latest/references/core/renderers/visualVariables/RotationVariable/)), the numeric
* field or expression from which to drive the visualization, and the visual values to map to the data.
* The following list identifies each visual variable type and provides a link to the specification table
* of each.
*
* Type | Object Specification | Legend Example
* -----|----------------------|---------------
* color | [ColorVisualVariable](https://developers.arcgis.com/javascript/latest/references/core/renderers/visualVariables/ColorVariable/) | 
* size | [SizeVisualVariable](https://developers.arcgis.com/javascript/latest/references/core/renderers/visualVariables/SizeVariable/) | 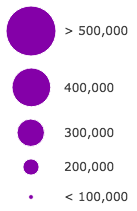
* opacity | [OpacityVisualVariable](https://developers.arcgis.com/javascript/latest/references/core/renderers/visualVariables/OpacityVariable/) | 
* rotation | [RotationVisualVariable](https://developers.arcgis.com/javascript/latest/references/core/renderers/visualVariables/RotationVariable/) | -
*
* Visual variables are primarily be used in two ways.
*
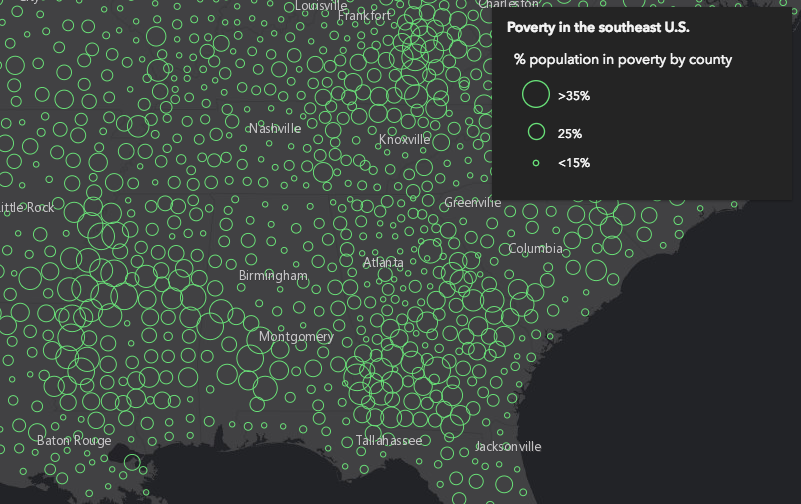
* #### 1. Thematic mapping
*
* In most cases, visual variables are used to create visualizations
* based on a thematic attribute (e.g. population, education, rank, money, magnitude, etc.) in
* either 2D or 3D.
*
* ```js
* renderer.visualVariables = [{
* type: "size",
* field: "POP_POVERTY",
* normalizationField: "TOTPOP_CY",
* legendOptions: {
* title: "% population in poverty by county"
* },
* stops: [
* { value: 0.15, size: 4, label: "<15%" },
* { value: 0.25, size: 12, label: "25%" },
* { value: 0.35, size: 24, label: ">35%" }
* ]
* }];
* ```
*
* [](https://developers.arcgis.com/javascript/latest/sample-code/visualization-vv-size/)
*
* You can take the visualization a step further and use multiple visual variables in the same renderer.
* The sample below uses
* three visual variables (size, color, and opacity).
*
* [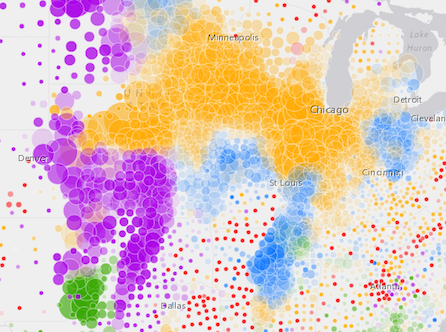](https://developers.arcgis.com/javascript/latest/sample-code/visualization-multivariate-2d/)
*
* #### 2. Mapping real-world sizes
*
* The [size](https://developers.arcgis.com/javascript/latest/references/core/renderers/visualVariables/SizeVariable/) visual variable can be used to
* visualize the true sizes of features (e.g. tree canopy, road width, building height, etc.)
* based on their size in the real world. This can be particularly powerful when working in a 3D
* [SceneView](https://developers.arcgis.com/javascript/latest/references/core/views/SceneView/). The image below shows a layer of trees
* that uses visual variables to size each feature to the true dimensions of each tree
* based on data stored in multiple attribute fields.
*
* [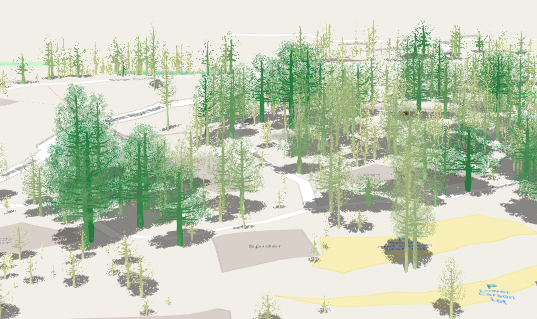](https://developers.arcgis.com/javascript/latest/sample-code/visualization-trees-realistic/)
*
* See the [Thematic visualization with realistic 3D symbols](https://developers.arcgis.com/javascript/latest/sample-code/visualization-trees-realistic/)
* for an example of using multiple visual variables to visualize your data.
*
* > [!WARNING]
* >
* > **Known Limitations**
* >
* > Color and opacity visual variables must not have more than 8 stops and
* > size visual variables must not have more than 6 stops. This does not apply to variables driven by view scale.
* >
* > For apps where users can interactively change the `field` or `valueExpression` of a visual variable, we suggest
* > you include all potential fields referenced by visual variables in the [FeatureLayer.outFields](https://developers.arcgis.com/javascript/latest/references/core/layers/FeatureLayer/#outFields)
* > of the layer. This ensures the best user experience when switching or updating fields in renderers.
*
* @see [Styles and data visualization](https://developers.arcgis.com/javascript/latest/visualization/)
*/
visualVariables?: ((ColorVariableProperties & { type: "color" }) | (SizeVariableProperties & { type: "size" }) | (OpacityVariableProperties & { type: "opacity" }) | (RotationVariableProperties & { type: "rotation" }))[] | null;
}
export abstract class VisualVariablesMixin {
constructor(...args: any[]);
/**
* An array of [VisualVariable](https://developers.arcgis.com/javascript/latest/references/core/renderers/visualVariables/VisualVariable/) objects.
* Each object must indicate
* the type of visual variable to apply (e.g. [ColorVisualVariable](https://developers.arcgis.com/javascript/latest/references/core/renderers/visualVariables/ColorVariable/),
* [SizeVisualVariable](https://developers.arcgis.com/javascript/latest/references/core/renderers/visualVariables/SizeVariable/), [OpacityVisualVariable](https://developers.arcgis.com/javascript/latest/references/core/renderers/visualVariables/OpacityVariable/),
* [RotationVisualVariable](https://developers.arcgis.com/javascript/latest/references/core/renderers/visualVariables/RotationVariable/)), the numeric
* field or expression from which to drive the visualization, and the visual values to map to the data.
* The following list identifies each visual variable type and provides a link to the specification table
* of each.
*
* Type | Object Specification | Legend Example
* -----|----------------------|---------------
* color | [ColorVisualVariable](https://developers.arcgis.com/javascript/latest/references/core/renderers/visualVariables/ColorVariable/) | 
* size | [SizeVisualVariable](https://developers.arcgis.com/javascript/latest/references/core/renderers/visualVariables/SizeVariable/) | 
* opacity | [OpacityVisualVariable](https://developers.arcgis.com/javascript/latest/references/core/renderers/visualVariables/OpacityVariable/) | 
* rotation | [RotationVisualVariable](https://developers.arcgis.com/javascript/latest/references/core/renderers/visualVariables/RotationVariable/) | -
*
* Visual variables are primarily be used in two ways.
*
* #### 1. Thematic mapping
*
* In most cases, visual variables are used to create visualizations
* based on a thematic attribute (e.g. population, education, rank, money, magnitude, etc.) in
* either 2D or 3D.
*
* ```js
* renderer.visualVariables = [{
* type: "size",
* field: "POP_POVERTY",
* normalizationField: "TOTPOP_CY",
* legendOptions: {
* title: "% population in poverty by county"
* },
* stops: [
* { value: 0.15, size: 4, label: "<15%" },
* { value: 0.25, size: 12, label: "25%" },
* { value: 0.35, size: 24, label: ">35%" }
* ]
* }];
* ```
*
* [](https://developers.arcgis.com/javascript/latest/sample-code/visualization-vv-size/)
*
* You can take the visualization a step further and use multiple visual variables in the same renderer.
* The sample below uses
* three visual variables (size, color, and opacity).
*
* [](https://developers.arcgis.com/javascript/latest/sample-code/visualization-multivariate-2d/)
*
* #### 2. Mapping real-world sizes
*
* The [size](https://developers.arcgis.com/javascript/latest/references/core/renderers/visualVariables/SizeVariable/) visual variable can be used to
* visualize the true sizes of features (e.g. tree canopy, road width, building height, etc.)
* based on their size in the real world. This can be particularly powerful when working in a 3D
* [SceneView](https://developers.arcgis.com/javascript/latest/references/core/views/SceneView/). The image below shows a layer of trees
* that uses visual variables to size each feature to the true dimensions of each tree
* based on data stored in multiple attribute fields.
*
* [](https://developers.arcgis.com/javascript/latest/sample-code/visualization-trees-realistic/)
*
* See the [Thematic visualization with realistic 3D symbols](https://developers.arcgis.com/javascript/latest/sample-code/visualization-trees-realistic/)
* for an example of using multiple visual variables to visualize your data.
*
* > [!WARNING]
* >
* > **Known Limitations**
* >
* > Color and opacity visual variables must not have more than 8 stops and
* > size visual variables must not have more than 6 stops. This does not apply to variables driven by view scale.
* >
* > For apps where users can interactively change the `field` or `valueExpression` of a visual variable, we suggest
* > you include all potential fields referenced by visual variables in the [FeatureLayer.outFields](https://developers.arcgis.com/javascript/latest/references/core/layers/FeatureLayer/#outFields)
* > of the layer. This ensures the best user experience when switching or updating fields in renderers.
*
* @see [Styles and data visualization](https://developers.arcgis.com/javascript/latest/visualization/)
*/
get visualVariables(): VisualVariable[] | null | undefined;
set visualVariables(value: ((ColorVariableProperties & { type: "color" }) | (SizeVariableProperties & { type: "size" }) | (OpacityVariableProperties & { type: "opacity" }) | (RotationVariableProperties & { type: "rotation" }))[] | null | undefined);
}