@arcgis/core
Version:
ArcGIS Maps SDK for JavaScript: A complete 2D and 3D mapping and data visualization API
193 lines (191 loc) • 10.6 kB
TypeScript
import type { JSONSupport } from "../core/JSONSupport.js";
import type { SpeedUnit } from "../core/units.js";
import type { VectorFieldStyles, VisualVariable } from "./types.js";
import type { VisualVariablesMixin, VisualVariablesMixinProperties } from "./mixins/VisualVariablesMixin.js";
import type { ColorVariableProperties } from "./visualVariables/ColorVariable.js";
import type { OpacityVariableProperties } from "./visualVariables/OpacityVariable.js";
import type { RotationVariableProperties } from "./visualVariables/RotationVariable.js";
import type { SizeVariableProperties } from "./visualVariables/SizeVariable.js";
export interface VectorFieldRendererProperties extends VisualVariablesMixinProperties, Partial<Pick<VectorFieldRenderer, "attributeField" | "flowRepresentation" | "inputUnit" | "outputUnit" | "style" | "symbolTileSize">> {
/**
* An array of [VisualVariable](https://developers.arcgis.com/javascript/latest/references/core/renderers/visualVariables/VisualVariable/) objects.
* Each object must indicate
* the type of visual variable to apply (e.g. [SizeVisualVariable](https://developers.arcgis.com/javascript/latest/references/core/renderers/visualVariables/SizeVariable/),
* [RotationVisualVariable](https://developers.arcgis.com/javascript/latest/references/core/renderers/visualVariables/RotationVariable/)), the numeric
* field or expression from which to drive the visualization, and the visual values to map to the data.
*
* When setting fields for the visual variables set on the VectorFieldRenderer, use `Magnitude` and `Direction` fields. `Magnitude` will return pixel values from the
* first band. `Direction` will return values from the second band. If the data represents u (zonal) and v (meridional) speed components, values are automatically converted
* to `Magnitude` and `Direction`.
*
* @see [Sample - Visualizing wind data with VectorFieldRenderer](https://developers.arcgis.com/javascript/latest/sample-code/layers-imagery-vfrenderer/)
* @see [Styles and data visualization](https://developers.arcgis.com/javascript/latest/visualization/)
* @example
* const renderer = new VectorFieldRenderer({
* style: "beaufort-kn", // Beaufort point symbol (knots)
* flowRepresentation: "flow-from", // show flow to angle for wind direction
* symbolTileSize: 10, // controls the density of the displayed vector symbols.
* visualVariables: [
* {
* type: "size",
* field: "Magnitude", // values read from the first band
* maxDataValue: 32,
* maxSize: "100px",
* minDataValue: 0.04,
* minSize: "8px"
* },
* {
* type: "rotation",
* field: "Direction", // values read from the second band
* rotationType: "geographic"
* }
* ]
* });
* @see [Styles and data visualization](https://developers.arcgis.com/javascript/latest/visualization/)
*/
visualVariables?: ((ColorVariableProperties & { type: "color"; }) | (SizeVariableProperties & { type: "size"; }) | (OpacityVariableProperties & { type: "opacity"; }) | (RotationVariableProperties & { type: "rotation"; }))[] | null;
}
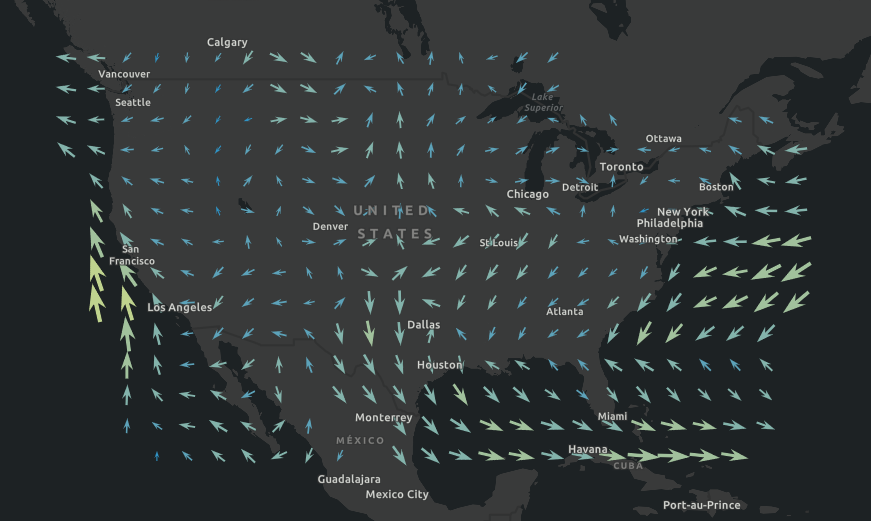
/**
* The VectorFieldRenderer allows you to display your raster data with vector symbols.
* This renderer is often used for visualizing flow direction and magnitude information
* in meteorology and oceanography raster data.
* It can also be used to symbolize a single raster layer where the symbols are scalar.
* The direction of the raster defines the angles, while the magnitude of the raster defines the size of the symbol.
*
* [](https://developers.arcgis.com/javascript/latest/sample-code/layers-imagery-vfrenderer/)
*
* > [!WARNING]
* >
* > **Known Limitations**
* >
* > The VectorFieldRenderer is only supported with [ImageryLayer](https://developers.arcgis.com/javascript/latest/references/core/layers/ImageryLayer/) and [ImageryTileLayer](https://developers.arcgis.com/javascript/latest/references/core/layers/ImageryTileLayer/).
* > The VectorFieldRenderer is only supported in 2D [MapView](https://developers.arcgis.com/javascript/latest/references/core/views/MapView/).
* > The [visualVariables](https://developers.arcgis.com/javascript/latest/references/core/renderers/VectorFieldRenderer/#visualVariables) set on the VectorFieldRenderer are not supported in the [Legend](https://developers.arcgis.com/javascript/latest/references/map-components/components/arcgis-legend/).
*
* @since 4.17
* @see [Sample - Visualizing wind data with VectorFieldRenderer](https://developers.arcgis.com/javascript/latest/sample-code/layers-imagery-vfrenderer/)
* @example
* const renderer = new VectorFieldRenderer({
* style: "beaufort-kn", // Beaufort point symbol (knots)
* flowRepresentation: "flow-from", // show flow to angle for wind direction
* symbolTileSize: 10, // draw one symbol in every 10x10 pixels
* visualVariables: [
* {
* type: "size",
* field: "Magnitude", // values read from the first band
* maxDataValue: 32,
* maxSize: "100px",
* minDataValue: 0.04,
* minSize: "8px"
* },
* {
* type: "rotation",
* field: "Direction", // values read from the second band
* rotationType: "geographic"
* }
* ]
* });
*/
export default class VectorFieldRenderer extends VectorFieldRendererSuperclass {
constructor(properties?: VectorFieldRendererProperties);
/**
* Attribute field presenting the magnitude.
*
* @default "Magnitude"
*/
accessor attributeField: "Magnitude";
/**
* Defines the flow direction of the data. If you have a data showing wind direction, it is recommended to use `flow-to` to show the natural flow direction
* of the wind on the map.
*
* Value | Description
* ------|------------
* flow-from | VectorFieldRenderer symbol [style](https://developers.arcgis.com/javascript/latest/references/core/renderers/VectorFieldRenderer/#style) point towards the direction of the data.
* flow-to | VectorFieldRenderer symbol [style](https://developers.arcgis.com/javascript/latest/references/core/renderers/VectorFieldRenderer/#style) point to the opposite direction of the data.
*
* @default "flow-from"
*/
accessor flowRepresentation: "flow-from" | "flow-to";
/** Magnitude input unit. */
accessor inputUnit: SpeedUnit;
/** Magnitude output unit */
accessor outputUnit: SpeedUnit;
/**
* Predefined symbol styles used to represent the vector flow.
*
* Value | Description
* ------|------------
* beaufort-ft | Beaufort point symbol (feet)
* beaufort-km | Beaufort point symbol (kilometers)
* beaufort-kn | Beaufort point symbol (knots)
* beaufort-m | Beaufort point symbol (meters)
* beaufort-mi | Beaufort point symbol (miles)
* classified-arrow | Classified arrow point symbol
* ocean-current-kn | Ocean current point symbol (knots)
* ocean-current-m | Ocean current point symbol (meters)
* simple-scalar | Simple scalar point symbol
* single-arrow | Single arrow point symbol
* wind-barb | Barb wind speed point symbol
*
* @default "single-arrow"
*/
accessor style: VectorFieldStyles;
/**
* Determines the density of the symbols. Larger tile size, fewer symbols.
* The VectorFieldRenderer draws one symbol within a defined tile size (in screen pixels).
*
* @default 50
*/
accessor symbolTileSize: number;
/** The type of Renderer. */
readonly type: "vector-field";
/**
* An array of [VisualVariable](https://developers.arcgis.com/javascript/latest/references/core/renderers/visualVariables/VisualVariable/) objects.
* Each object must indicate
* the type of visual variable to apply (e.g. [SizeVisualVariable](https://developers.arcgis.com/javascript/latest/references/core/renderers/visualVariables/SizeVariable/),
* [RotationVisualVariable](https://developers.arcgis.com/javascript/latest/references/core/renderers/visualVariables/RotationVariable/)), the numeric
* field or expression from which to drive the visualization, and the visual values to map to the data.
*
* When setting fields for the visual variables set on the VectorFieldRenderer, use `Magnitude` and `Direction` fields. `Magnitude` will return pixel values from the
* first band. `Direction` will return values from the second band. If the data represents u (zonal) and v (meridional) speed components, values are automatically converted
* to `Magnitude` and `Direction`.
*
* @see [Sample - Visualizing wind data with VectorFieldRenderer](https://developers.arcgis.com/javascript/latest/sample-code/layers-imagery-vfrenderer/)
* @see [Styles and data visualization](https://developers.arcgis.com/javascript/latest/visualization/)
* @example
* const renderer = new VectorFieldRenderer({
* style: "beaufort-kn", // Beaufort point symbol (knots)
* flowRepresentation: "flow-from", // show flow to angle for wind direction
* symbolTileSize: 10, // controls the density of the displayed vector symbols.
* visualVariables: [
* {
* type: "size",
* field: "Magnitude", // values read from the first band
* maxDataValue: 32,
* maxSize: "100px",
* minDataValue: 0.04,
* minSize: "8px"
* },
* {
* type: "rotation",
* field: "Direction", // values read from the second band
* rotationType: "geographic"
* }
* ]
* });
* @see [Styles and data visualization](https://developers.arcgis.com/javascript/latest/visualization/)
*/
get visualVariables(): VisualVariable[] | null | undefined;
set visualVariables(value: ((ColorVariableProperties & { type: "color"; }) | (SizeVariableProperties & { type: "size"; }) | (OpacityVariableProperties & { type: "opacity"; }) | (RotationVariableProperties & { type: "rotation"; }))[] | null | undefined);
/**
* Creates a deep clone of the renderer.
*
* @returns A deep clone of the object that
* invoked this method.
* @example
* // Creates a deep clone of the first layer's renderer
* let renderer = view.map.layers.at(0).renderer.clone();
*/
clone(): VectorFieldRenderer;
}
declare const VectorFieldRendererSuperclass: typeof JSONSupport & typeof VisualVariablesMixin