@arcgis/core
Version:
ArcGIS Maps SDK for JavaScript: A complete 2D and 3D mapping and data visualization API
738 lines (736 loc) • 39.9 kB
TypeScript
import type Graphic from "../Graphic.js";
import type Renderer from "./Renderer.js";
import type RendererLegendOptions from "./support/RendererLegendOptions.js";
import type UniqueValueGroup from "./support/UniqueValueGroup.js";
import type UniqueValueInfo from "./support/UniqueValueInfo.js";
import type CIMSymbol from "../symbols/CIMSymbol.js";
import type FillSymbol from "../symbols/FillSymbol.js";
import type PolygonSymbol3D from "../symbols/PolygonSymbol3D.js";
import type { VisualVariablesMixin, VisualVariablesMixinProperties } from "./mixins/VisualVariablesMixin.js";
import type { UniqueValueInfoProperties } from "./support/UniqueValueInfo.js";
import type { SymbolUnion, SymbolUnionProperties } from "../symbols/types.js";
import type { CIMSymbolProperties } from "../symbols/CIMSymbol.js";
import type { PolygonSymbol3DProperties } from "../symbols/PolygonSymbol3D.js";
import type { FillSymbolProperties } from "../symbols/FillSymbol.js";
import type { RendererLegendOptionsProperties } from "./support/RendererLegendOptions.js";
import type { WebStyleSymbolProperties } from "../symbols/WebStyleSymbol.js";
import type { PointSymbol3DProperties } from "../symbols/PointSymbol3D.js";
import type { MeshSymbol3DProperties } from "../symbols/MeshSymbol3D.js";
import type { LineSymbol3DProperties } from "../symbols/LineSymbol3D.js";
import type { LabelSymbol3DProperties } from "../symbols/LabelSymbol3D.js";
import type { TextSymbolProperties } from "../symbols/TextSymbol.js";
import type { SimpleMarkerSymbolProperties } from "../symbols/SimpleMarkerSymbol.js";
import type { SimpleLineSymbolProperties } from "../symbols/SimpleLineSymbol.js";
import type { SimpleFillSymbolProperties } from "../symbols/SimpleFillSymbol.js";
import type { PictureMarkerSymbolProperties } from "../symbols/PictureMarkerSymbol.js";
import type { PictureFillSymbolProperties } from "../symbols/PictureFillSymbol.js";
import type { UniqueValueGroupProperties } from "./support/UniqueValueGroup.js";
import type { RendererProperties } from "./Renderer.js";
export interface UniqueValueRendererProperties extends RendererProperties, VisualVariablesMixinProperties, Partial<Pick<UniqueValueRenderer, "defaultLabel" | "field" | "field2" | "field3" | "fieldDelimiter" | "orderByClassesEnabled" | "valueExpression" | "valueExpressionTitle">> {
/**
* This property is only relevant when symbolizing polygon features with marker symbols
* (or [IconSymbol3DLayer](https://developers.arcgis.com/javascript/latest/references/core/symbols/IconSymbol3DLayer/)) in the [uniqueValueInfos](https://developers.arcgis.com/javascript/latest/references/core/renderers/UniqueValueRenderer/#uniqueValueInfos) of this renderer.
* This is usually done when adding a [SizeVariable](https://developers.arcgis.com/javascript/latest/references/core/renderers/visualVariables/SizeVariable/) to the [visualVariables](https://developers.arcgis.com/javascript/latest/references/core/renderers/UniqueValueRenderer/#visualVariables))
* in a bivariate visualization (color indicates a type-based value and size indicates the value of a separate numeric field).
* Use this property to set a background [FillSymbol](https://developers.arcgis.com/javascript/latest/references/core/symbols/FillSymbol/) (or [PolygonSymbol3D](https://developers.arcgis.com/javascript/latest/references/core/symbols/PolygonSymbol3D/) if
* visualizing data in 3D) to visualize the boundaries of each polygon.
*
* > [!WARNING]
* >
* > Support for [CIMSymbol](https://developers.arcgis.com/javascript/latest/references/core/symbols/CIMSymbol/) was added at version 4.31 and is limited to 2D MapView.
*
* @since 4.7
* @example
* // this symbol will be applied to all features. It is only
* // necessary when visualizing polygon data with icons.
* renderer.backgroundFillSymbol = {
* type: "simple-fill",
* outline: {
* width: 1,
* color: "gray"
* }
* };
*/
backgroundFillSymbol?: FillSymbolProperties | (PolygonSymbol3DProperties & { type: "polygon-3d" }) | (CIMSymbolProperties & { type: "cim" }) | null;
/**
* The symbol used to draw
* all features with values not referenced by [uniqueValueInfos](https://developers.arcgis.com/javascript/latest/references/core/renderers/UniqueValueRenderer/#uniqueValueInfos) or
* [uniqueValueGroups](https://developers.arcgis.com/javascript/latest/references/core/renderers/UniqueValueRenderer/#uniqueValueGroups). If `null`, unmatched features will not be assigned a symbol.
*
* > [!WARNING]
* >
* > **Known Limitations**
* >
* > SceneLayers with a `mesh` [SceneLayer.geometryType](https://developers.arcgis.com/javascript/latest/references/core/layers/SceneLayer/#geometryType)
* > will display unmatching features with a generic symbol even if the `defaultSymbol` is
* > `null`.
*/
defaultSymbol?: (((PictureFillSymbolProperties & { type: "picture-fill" }) | (PictureMarkerSymbolProperties & { type: "picture-marker" }) | (SimpleFillSymbolProperties & { type: "simple-fill" }) | (SimpleLineSymbolProperties & { type: "simple-line" }) | (SimpleMarkerSymbolProperties & { type: "simple-marker" }) | (TextSymbolProperties & { type: "text" }) | (CIMSymbolProperties & { type: "cim" })) | ((LabelSymbol3DProperties & { type: "label-3d" }) | (LineSymbol3DProperties & { type: "line-3d" }) | (MeshSymbol3DProperties & { type: "mesh-3d" }) | (PointSymbol3DProperties & { type: "point-3d" }) | (PolygonSymbol3DProperties & { type: "polygon-3d" })) | (WebStyleSymbolProperties & { type: "web-style" })) | null;
/**
* An object providing options for displaying the renderer in the Legend.
*
* @example
* renderer.legendOptions = {
* title: "Classification",
* order: "descending-values",
* };
*/
legendOptions?: RendererLegendOptionsProperties | null;
/**
* An array of objects defining groups of unique values. This is required if you want to
* group sets of unique values under subheadings. Unique value groups also allow you to
* combine or merge multiple unique values
* to a single class so they are represented by one symbol and one label.
*
* This property should be used in favor of [uniqueValueInfos](https://developers.arcgis.com/javascript/latest/references/core/renderers/UniqueValueRenderer/#uniqueValueInfos).
*
* @since 4.25
* @example
* layer.renderer = {
* type: "unique-value",
* field: "zonecode",
* uniqueValueGroups: [{
* heading: "Commercial",
* classes: [{
* label: "C-2 | Community Commercial",
* symbol: createSymbol([255,179,219]),
* values: ["C-1", "C-2"]
* }, {
* label: "C-3 | Major Commercial",
* symbol: createSymbol([255,0,0]),
* values: "C-3"
* }]
* }, {
* heading: "Residential",
* classes: [{
* label: "R-1 | Low-Density Residential",
* symbol: createSymbol([255,255,224]),
* values: "R-1"
* }, {
* label: "R-3 | Limited High-Density Residential",
* symbol: createSymbol([255,214,0]),
* values: "R-3"
* }, {
* label: "R-4 | High-Density Residential",
* symbol: createSymbol([255,166,0]),
* values: "R-4",
* }]
* }, {
* heading: "Other",
* classes: [{
* label: "S | Special Area",
* symbol: createSymbol([161,237,237]),
* values: ["S-DW", "S-DR", "S-RP", "S-JW", "S-RN", "S-WS"]
* }]
* }]
* };
*/
uniqueValueGroups?: UniqueValueGroupProperties[] | null;
/**
* Defines categories and their corresponding symbols based on a set of values expected
* from the provided [field](https://developers.arcgis.com/javascript/latest/references/core/renderers/UniqueValueRenderer/#field) or [valueExpression](https://developers.arcgis.com/javascript/latest/references/core/renderers/UniqueValueRenderer/#valueExpression).
*
* @example
* layer.renderer = {
* type: "unique-value",
* field: "zonecode",
* uniqueValueInfos: [{
* label: "C-2 | Community Commercial",
* symbol: createSymbol([255,179,219]),
* value: "C-2"
* }, {
* label: "C-3 | Major Commercial",
* symbol: createSymbol([255,0,0]),
* value: "C-3"
* }, {
* label: "R-1 | Low-Density Residential",
* symbol: createSymbol([255,255,224]),
* value: "R-1"
* }, {
* label: "R-3 | Limited High-Density Residential",
* symbol: createSymbol([255,214,0]),
* value: "R-3"
* }, {
* label: "R-4 | High-Density Residential",
* symbol: createSymbol([255,166,0]),
* value: "R-4"
* }]
* };
*/
uniqueValueInfos?: UniqueValueInfoProperties[] | null;
}
/**
* UniqueValueRenderer allows you to symbolize features in a [Layer](https://developers.arcgis.com/javascript/latest/references/core/layers/Layer/) based on one
* or more categorical attributes. This is typically done by using unique colors, fill styles, or images
* to represent features with equal values in a string field.
*
* > [!WARNING]
* >
* > **Supported layers**
* >
* > UniqueValueRenderer may only be used to create visualizations for the following layer types: [FeatureLayer](https://developers.arcgis.com/javascript/latest/references/core/layers/FeatureLayer/), [SceneLayer](https://developers.arcgis.com/javascript/latest/references/core/layers/SceneLayer/), [MapImageLayer](https://developers.arcgis.com/javascript/latest/references/core/layers/MapImageLayer/), [CSVLayer](https://developers.arcgis.com/javascript/latest/references/core/layers/CSVLayer/), [GeoJSONLayer](https://developers.arcgis.com/javascript/latest/references/core/layers/GeoJSONLayer/), [OGCFeatureLayer](https://developers.arcgis.com/javascript/latest/references/core/layers/OGCFeatureLayer/), [WFSLayer](https://developers.arcgis.com/javascript/latest/references/core/layers/WFSLayer/), [StreamLayer](https://developers.arcgis.com/javascript/latest/references/core/layers/StreamLayer/), [ImageryLayer](https://developers.arcgis.com/javascript/latest/references/core/layers/ImageryLayer/), and [ImageryTileLayer](https://developers.arcgis.com/javascript/latest/references/core/layers/ImageryTileLayer/)
*
* At a minimum, this renderer requires you specify a [field](https://developers.arcgis.com/javascript/latest/references/core/renderers/UniqueValueRenderer/#field) (or [valueExpression](https://developers.arcgis.com/javascript/latest/references/core/renderers/UniqueValueRenderer/#valueExpression))
* from which the unique types or categories originate. You must also specify expected values and their corresponding
* symbols using either [uniqueValueInfos](https://developers.arcgis.com/javascript/latest/references/core/renderers/UniqueValueRenderer/#uniqueValueInfos) or [uniqueValueGroups](https://developers.arcgis.com/javascript/latest/references/core/renderers/UniqueValueRenderer/#uniqueValueGroups).
*
* In the image below, each polyline is symbolized with a color depending on the
* road classification of each feature in a layer representing major highways. For example, blue features
* represent interstate highways (freeways), orange lines represent U.S. Highways, and pink lines
* represent state highways.
*
* [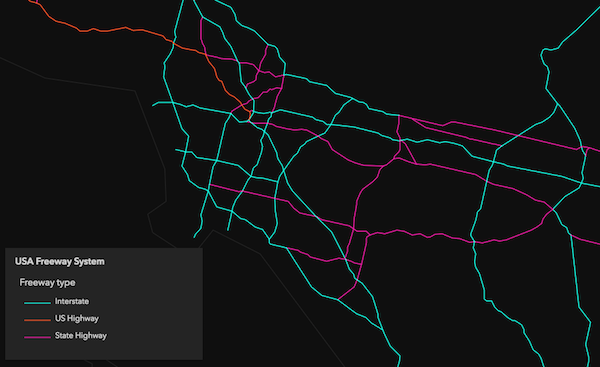](https://developers.arcgis.com/javascript/latest/sample-code/visualization-location-types/)
*
* UniqueValueRenderer can also be used to visualize numeric data attributes in conjunction
* with unique values. This is accomplished with [visual variables](https://developers.arcgis.com/javascript/latest/references/core/renderers/UniqueValueRenderer/#visualVariables).
* Visual variables define the parameters for data-driven visualizations of numeric data. They allow you to
* easily map continuous ramps of [color](https://developers.arcgis.com/javascript/latest/references/core/renderers/visualVariables/ColorVariable/), [size](https://developers.arcgis.com/javascript/latest/references/core/renderers/visualVariables/SizeVariable/), and [opacity](https://developers.arcgis.com/javascript/latest/references/core/renderers/visualVariables/OpacityVariable/)
* to minimum and maximum data values from one of the layer's numeric attribute fields.
*
* When used in a UniqueValueRenderer, the unique symbol types are typically defined with color
* while [size](https://developers.arcgis.com/javascript/latest/references/core/renderers/visualVariables/SizeVariable/) and/or [opacity](https://developers.arcgis.com/javascript/latest/references/core/renderers/visualVariables/OpacityVariable/) [visual variables](https://developers.arcgis.com/javascript/latest/references/core/renderers/UniqueValueRenderer/#visualVariables)
* are added to create a multivariate map. However, the [SimpleFillSymbol.style](https://developers.arcgis.com/javascript/latest/references/core/symbols/SimpleFillSymbol/#style) of a symbol
* may be used as the primary representation of categories, so a color visual variable can be used for another attribute.
*
* The example below uses a UniqueValueRenderer to shade each building feature with a color depending on
* its type (e.g. purple represents condominium, green represents hotels, orange is residential, etc.).
* A [size](https://developers.arcgis.com/javascript/latest/references/core/renderers/visualVariables/SizeVariable/) visual variable is then added to depict the real-world height of each building.
*
* [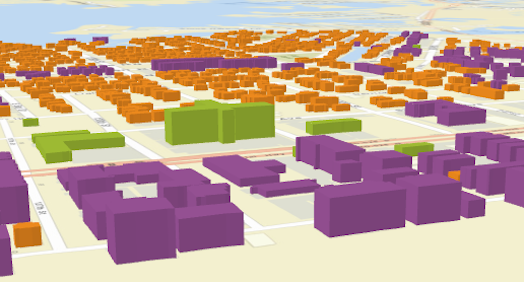](https://developers.arcgis.com/javascript/latest/sample-code/visualization-buildings-3d/)
*
* To read more about visual variables see the [visualVariables](https://developers.arcgis.com/javascript/latest/references/core/renderers/UniqueValueRenderer/#visualVariables) property.
*
* @since 4.0
* @see [Styles and data visualization - Unique types](https://developers.arcgis.com/javascript/latest/visualization/data-driven-styles/unique-types/)
* @see [Sample - Symbolize features by type](https://developers.arcgis.com/javascript/latest/sample-code/visualization-location-types/)
* @see [Sample - Extrude building footprints based on real world heights](https://developers.arcgis.com/javascript/latest/sample-code/visualization-buildings-3d/)
* @see [Guide - Esri color ramps](https://developers.arcgis.com/javascript/latest/esri-color-ramps/)
* @see [Guide - Visualization best practices](https://developers.arcgis.com/javascript/latest/visualization-best-practices/)
* @example
* layer.renderer = {
* type: "unique-value", // autocasts as new UniqueValueRenderer()
* field: "REGION",
* defaultSymbol: { type: "simple-fill" }, // autocasts as new SimpleFillSymbol()
* uniqueValueInfos: [{
* // All features with value of "North" will be blue
* value: "North",
* symbol: {
* type: "simple-fill", // autocasts as new SimpleFillSymbol()
* color: "blue"
* }
* }, {
* // All features with value of "East" will be green
* value: "East",
* symbol: {
* type: "simple-fill", // autocasts as new SimpleFillSymbol()
* color: "green"
* }
* }, {
* // All features with value of "South" will be red
* value: "South",
* symbol: {
* type: "simple-fill", // autocasts as new SimpleFillSymbol()
* color: "red"
* }
* }, {
* // All features with value of "West" will be yellow
* value: "West",
* symbol: {
* type: "simple-fill", // autocasts as new SimpleFillSymbol()
* color: "yellow"
* }
* }],
* visualVariables: [{
* type: "opacity",
* field: "POPULATION",
* normalizationField: "SQ_KM",
* // features with 30 ppl/sq km or below are assigned the first opacity value
* stops: [{ value: 100, opacity: 0.15 },
* { value: 1000, opacity: 0.90 }]
* }]
* };
*/
export default class UniqueValueRenderer extends UniqueValueRendererSuperclass {
/**
* @example
* // Typical usage
* let renderer = {
* type: "unique-value", // autocasts as new UniqueValueRenderer()
* field: "fieldName",
* uniqueValueInfos: [ ]
* };
*/
constructor(properties?: UniqueValueRendererProperties);
/**
* This property is only relevant when symbolizing polygon features with marker symbols
* (or [IconSymbol3DLayer](https://developers.arcgis.com/javascript/latest/references/core/symbols/IconSymbol3DLayer/)) in the [uniqueValueInfos](https://developers.arcgis.com/javascript/latest/references/core/renderers/UniqueValueRenderer/#uniqueValueInfos) of this renderer.
* This is usually done when adding a [SizeVariable](https://developers.arcgis.com/javascript/latest/references/core/renderers/visualVariables/SizeVariable/) to the [visualVariables](https://developers.arcgis.com/javascript/latest/references/core/renderers/UniqueValueRenderer/#visualVariables))
* in a bivariate visualization (color indicates a type-based value and size indicates the value of a separate numeric field).
* Use this property to set a background [FillSymbol](https://developers.arcgis.com/javascript/latest/references/core/symbols/FillSymbol/) (or [PolygonSymbol3D](https://developers.arcgis.com/javascript/latest/references/core/symbols/PolygonSymbol3D/) if
* visualizing data in 3D) to visualize the boundaries of each polygon.
*
* > [!WARNING]
* >
* > Support for [CIMSymbol](https://developers.arcgis.com/javascript/latest/references/core/symbols/CIMSymbol/) was added at version 4.31 and is limited to 2D MapView.
*
* @since 4.7
* @example
* // this symbol will be applied to all features. It is only
* // necessary when visualizing polygon data with icons.
* renderer.backgroundFillSymbol = {
* type: "simple-fill",
* outline: {
* width: 1,
* color: "gray"
* }
* };
*/
get backgroundFillSymbol(): FillSymbol | PolygonSymbol3D | CIMSymbol | null | undefined;
set backgroundFillSymbol(value: FillSymbolProperties | (PolygonSymbol3DProperties & { type: "polygon-3d" }) | (CIMSymbolProperties & { type: "cim" }) | null | undefined);
/**
* The label used in the [Legend](https://developers.arcgis.com/javascript/latest/references/map-components/components/arcgis-legend/) to describe features assigned the
* [default symbol](https://developers.arcgis.com/javascript/latest/references/core/renderers/UniqueValueRenderer/#defaultSymbol). The [default symbol](https://developers.arcgis.com/javascript/latest/references/core/renderers/UniqueValueRenderer/#defaultSymbol) is used to draw
* all features with values not referenced by [uniqueValueInfos](https://developers.arcgis.com/javascript/latest/references/core/renderers/UniqueValueRenderer/#uniqueValueInfos) or
* [uniqueValueGroups](https://developers.arcgis.com/javascript/latest/references/core/renderers/UniqueValueRenderer/#uniqueValueGroups).
*/
accessor defaultLabel: string | null | undefined;
/**
* The symbol used to draw
* all features with values not referenced by [uniqueValueInfos](https://developers.arcgis.com/javascript/latest/references/core/renderers/UniqueValueRenderer/#uniqueValueInfos) or
* [uniqueValueGroups](https://developers.arcgis.com/javascript/latest/references/core/renderers/UniqueValueRenderer/#uniqueValueGroups). If `null`, unmatched features will not be assigned a symbol.
*
* > [!WARNING]
* >
* > **Known Limitations**
* >
* > SceneLayers with a `mesh` [SceneLayer.geometryType](https://developers.arcgis.com/javascript/latest/references/core/layers/SceneLayer/#geometryType)
* > will display unmatching features with a generic symbol even if the `defaultSymbol` is
* > `null`.
*/
get defaultSymbol(): SymbolUnion | null | undefined;
set defaultSymbol(value: (((PictureFillSymbolProperties & { type: "picture-fill" }) | (PictureMarkerSymbolProperties & { type: "picture-marker" }) | (SimpleFillSymbolProperties & { type: "simple-fill" }) | (SimpleLineSymbolProperties & { type: "simple-line" }) | (SimpleMarkerSymbolProperties & { type: "simple-marker" }) | (TextSymbolProperties & { type: "text" }) | (CIMSymbolProperties & { type: "cim" })) | ((LabelSymbol3DProperties & { type: "label-3d" }) | (LineSymbol3DProperties & { type: "line-3d" }) | (MeshSymbol3DProperties & { type: "mesh-3d" }) | (PointSymbol3DProperties & { type: "point-3d" }) | (PolygonSymbol3DProperties & { type: "polygon-3d" })) | (WebStyleSymbolProperties & { type: "web-style" })) | null | undefined);
/**
* The name of the attribute field containing types or categorical values referenced
* in [uniqueValueInfos](https://developers.arcgis.com/javascript/latest/references/core/renderers/UniqueValueRenderer/#uniqueValueInfos) or [uniqueValueGroups](https://developers.arcgis.com/javascript/latest/references/core/renderers/UniqueValueRenderer/#uniqueValueGroups).
*
* @example
* let renderer = {
* type: "unique-value", // autocasts as new UniqueValueRenderer()
* field: "RANK", // contains values referenced in uniqueValueInfos
* uniqueValueInfos: [
* {
* value: "high", // features labeled as "high"
* symbol: sym1 // will be assigned sym1
* }, {
* value: "medium", // features labeled as "medium"
* symbol: sym2 // will be assigned sym2
* }, {
* value: "low", // features labeled as "low"
* symbol: sym3 // will be assigned sym2
* }
* ]
* };
*/
accessor field: string | null | undefined;
/**
* Specifies the name of an additional attribute field used to categorize features.
* All combinations of [field](https://developers.arcgis.com/javascript/latest/references/core/renderers/UniqueValueRenderer/#field) and `field2` values are unique categories and
* may have their own symbol.
*
* When defining a set of [uniqueValueInfos](https://developers.arcgis.com/javascript/latest/references/core/renderers/UniqueValueRenderer/#uniqueValueInfos), a [fieldDelimiter](https://developers.arcgis.com/javascript/latest/references/core/renderers/UniqueValueRenderer/#fieldDelimiter)
* must be specified.
*
* @see [fieldDelimiter](https://developers.arcgis.com/javascript/latest/references/core/renderers/UniqueValueRenderer/#fieldDelimiter)
* @example
* // categorizes combinations of values in field and field2 with uniqueValueInfos
* let renderer = {
* type: "unique-value", // autocasts as new UniqueValueRenderer()
* field: "REGION",
* field2: "RANK",
* fieldDelimiter: ", ", // comma + space used to separate values from all fields
* uniqueValueInfos: [
* {
* value: "North, 1", // features in the "North" region and a rank of 1
* symbol: sym1 // will be assigned sym1
* }, {
* value: "North, 2", // features in the "North" region and a rank of 2
* symbol: sym2 // will be assigned sym2
* }, {
* value: "South, 1", // features in the "South" region and a rank of 1
* symbol: sym3 // will be assigned sym3
* }, {
* value: "South, 2", // features in the "South" region and a rank of 2
* symbol: sym4 // will be assigned sym4
* }
* ]
* };
* @example
* // categorizes combinations of values in field and field2 with uniqueValueGroups
* let renderer = {
* type: "unique-value", // autocasts as new UniqueValueRenderer()
* field: "Obesity_prevalence", // values are either "high" or "low"
* field2: "Diabetes_prevalence", // values are either "high" or "low"
* uniqueValueGroups: [{
* classes: [{
* symbol: {
* // an object of common symbol properties
* ...commonProperties,
* color: "yellow"
* },
* label: "Low obesity; Low diabetes",
* values: {
* value: "low",
* value2: "low"
* }
* }, {
* symbol: {
* ...commonProperties,
* color: "orange"
* },
* label: "Low obesity; High diabetes",
* values: {
* value: "low",
* value2: "high"
* }
* }, {
* symbol: {
* ...commonProperties,
* color: "red"
* },
* label: "High obesity; Low diabetes",
* values: {
* value: "high",
* value2: "low"
* }
* }, {
* symbol: {
* ...commonProperties,
* color: "purple"
* },
* label: "High obesity; High diabetes",
* values: {
* value: "high",
* value2: "high"
* }
* }]
* }]
* };
*/
accessor field2: string | null | undefined;
/**
* Specifies the name of a third attribute field used to categorize features.
* All combinations of [field](https://developers.arcgis.com/javascript/latest/references/core/renderers/UniqueValueRenderer/#field), [field2](https://developers.arcgis.com/javascript/latest/references/core/renderers/UniqueValueRenderer/#field2), and `field3` values are unique categories and
* may have their own symbol.
*
* When defining a set of [uniqueValueInfos](https://developers.arcgis.com/javascript/latest/references/core/renderers/UniqueValueRenderer/#uniqueValueInfos), a [fieldDelimiter](https://developers.arcgis.com/javascript/latest/references/core/renderers/UniqueValueRenderer/#fieldDelimiter)
* must be specified.
*
* @see [fieldDelimiter](https://developers.arcgis.com/javascript/latest/references/core/renderers/UniqueValueRenderer/#fieldDelimiter)
* @example
* // categorizes combinations of values in field, field2, and field3 with uniqueValueInfos
* let renderer = {
* type: "unique-value", // autocasts as new UniqueValueRenderer()
* field: "REGION",
* field2: "RANK",
* field3: "CLASS",
* fieldDelimiter: " | ", // pipe symbol padded with spaces used to separate values from all fields
* uniqueValueInfos: [
* {
* value: "North | 1 | medium", // features in the "North" region, a rank of 1, and "medium" class
* symbol: sym1 // will be assigned sym1
* }, {
* value: "North | 2 | medium", // features in the "North" region, a rank of 2, and a "medium class
* symbol: sym2 // will be assigned sym2
* },
* ...
* ]
* };
* @example
* // categorizes combinations of values in field, field2, and field3 with uniqueValueGroups
* let renderer = {
* type: "unique-value", // autocasts as new UniqueValueRenderer()
* field: "Obesity_prevalence", // values are either "high" or "low"
* field2: "Diabetes_prevalence", // values are either "high" or "low"
* field3: "Alcohol_nat_avg" // values are either "above" or "below" national average
* uniqueValueGroups: [{
* classes: [{
* symbol: {
* // an object of common symbol properties
* ...commonProperties,
* color: "yellow"
* },
* label: "Low obesity; Low diabetes; Low alcohol",
* values: {
* value: "low",
* value2: "low",
* value3: "low"
* }
* }, {
* symbol: {
* ...commonProperties,
* color: "orange"
* },
* label: "Low obesity; High diabetes; High alcohol",
* values: {
* value: "low",
* value2: "high",
* value3: "high"
* }
* }]
* }]
* };
*/
accessor field3: string | null | undefined;
/**
* A string used as a separator between the values in the legend
* if multiple attribute fields are used to categorize values. This property only
* applies when [uniqueValueInfos](https://developers.arcgis.com/javascript/latest/references/core/renderers/UniqueValueRenderer/#uniqueValueInfos) are used to categorize values. It
* does not apply for [uniqueValueGroups](https://developers.arcgis.com/javascript/latest/references/core/renderers/UniqueValueRenderer/#uniqueValueGroups).
*
* By default, a comma is used as the field delimiter if [field](https://developers.arcgis.com/javascript/latest/references/core/renderers/UniqueValueRenderer/#field) and [field2](https://developers.arcgis.com/javascript/latest/references/core/renderers/UniqueValueRenderer/#field2)
* are defined (since version 4.25).
*
* @see [field2](https://developers.arcgis.com/javascript/latest/references/core/renderers/UniqueValueRenderer/#field2)
* @see [field3](https://developers.arcgis.com/javascript/latest/references/core/renderers/UniqueValueRenderer/#field3)
* @example
* let renderer = {
* type: "unique-value", // autocasts as new UniqueValueRenderer()
* field: "REGION",
* field2: "RANK",
* fieldDelimiter: ", ", // comma + space used to separate values from all fields
* uniqueValueInfos: [
* {
* value: "North, 1", // features in the "North" region and a rank of 1
* symbol: sym1 // will be assigned sym1
* }, {
* value: "North, 2", // features in the "North" region and a rank of 2
* symbol: sym2 // will be assigned sym2
* },
* ...
* ]
* };
*/
accessor fieldDelimiter: string | null | undefined;
/**
* An object providing options for displaying the renderer in the Legend.
*
* @example
* renderer.legendOptions = {
* title: "Classification",
* order: "descending-values",
* };
*/
get legendOptions(): RendererLegendOptions | null | undefined;
set legendOptions(value: RendererLegendOptionsProperties | null | undefined);
/**
* Indicates whether the order of the classes or [uniqueValueInfos](https://developers.arcgis.com/javascript/latest/references/core/renderers/UniqueValueRenderer/#uniqueValueInfos) in the renderer definition
* should be used for the feature drawing order of the layer. If [FeatureLayer.orderBy](https://developers.arcgis.com/javascript/latest/references/core/layers/FeatureLayer/#orderBy)
* is set on the layer, then the drawing order specified in that property will take precedence over this property.
*
* > [!WARNING]
* >
* > **Known Limitations**
* >
* > This property only controls feature drawing order in [MapView](https://developers.arcgis.com/javascript/latest/references/core/views/MapView/). Configuring
* > feature drawing order in [SceneView](https://developers.arcgis.com/javascript/latest/references/core/views/SceneView/) is not supported.
*
* @default false
* @since 4.26
* @example renderer.orderByClassesEnabled = true;
*/
accessor orderByClassesEnabled: boolean;
/** The type of Renderer. */
get type(): "unique-value";
/**
* An array of objects defining groups of unique values. This is required if you want to
* group sets of unique values under subheadings. Unique value groups also allow you to
* combine or merge multiple unique values
* to a single class so they are represented by one symbol and one label.
*
* This property should be used in favor of [uniqueValueInfos](https://developers.arcgis.com/javascript/latest/references/core/renderers/UniqueValueRenderer/#uniqueValueInfos).
*
* @since 4.25
* @example
* layer.renderer = {
* type: "unique-value",
* field: "zonecode",
* uniqueValueGroups: [{
* heading: "Commercial",
* classes: [{
* label: "C-2 | Community Commercial",
* symbol: createSymbol([255,179,219]),
* values: ["C-1", "C-2"]
* }, {
* label: "C-3 | Major Commercial",
* symbol: createSymbol([255,0,0]),
* values: "C-3"
* }]
* }, {
* heading: "Residential",
* classes: [{
* label: "R-1 | Low-Density Residential",
* symbol: createSymbol([255,255,224]),
* values: "R-1"
* }, {
* label: "R-3 | Limited High-Density Residential",
* symbol: createSymbol([255,214,0]),
* values: "R-3"
* }, {
* label: "R-4 | High-Density Residential",
* symbol: createSymbol([255,166,0]),
* values: "R-4",
* }]
* }, {
* heading: "Other",
* classes: [{
* label: "S | Special Area",
* symbol: createSymbol([161,237,237]),
* values: ["S-DW", "S-DR", "S-RP", "S-JW", "S-RN", "S-WS"]
* }]
* }]
* };
*/
get uniqueValueGroups(): UniqueValueGroup[] | null | undefined;
set uniqueValueGroups(value: UniqueValueGroupProperties[] | null | undefined);
/**
* Defines categories and their corresponding symbols based on a set of values expected
* from the provided [field](https://developers.arcgis.com/javascript/latest/references/core/renderers/UniqueValueRenderer/#field) or [valueExpression](https://developers.arcgis.com/javascript/latest/references/core/renderers/UniqueValueRenderer/#valueExpression).
*
* @example
* layer.renderer = {
* type: "unique-value",
* field: "zonecode",
* uniqueValueInfos: [{
* label: "C-2 | Community Commercial",
* symbol: createSymbol([255,179,219]),
* value: "C-2"
* }, {
* label: "C-3 | Major Commercial",
* symbol: createSymbol([255,0,0]),
* value: "C-3"
* }, {
* label: "R-1 | Low-Density Residential",
* symbol: createSymbol([255,255,224]),
* value: "R-1"
* }, {
* label: "R-3 | Limited High-Density Residential",
* symbol: createSymbol([255,214,0]),
* value: "R-3"
* }, {
* label: "R-4 | High-Density Residential",
* symbol: createSymbol([255,166,0]),
* value: "R-4"
* }]
* };
*/
get uniqueValueInfos(): UniqueValueInfo[] | null | undefined;
set uniqueValueInfos(value: UniqueValueInfoProperties[] | null | undefined);
/**
* An [Arcade](https://developers.arcgis.com/javascript/latest/arcade/) expression following the specification
* defined by the [Arcade Visualization Profile](https://developers.arcgis.com/javascript/latest/arcade/#visualization). Expressions
* in UniqueValueRenderer may reference field values using the `$feature` profile variable
* and must return a string or a number.
*
* The values returned from this expression should match categories
* defined in [uniqueValueInfos](https://developers.arcgis.com/javascript/latest/references/core/renderers/UniqueValueRenderer/#uniqueValueInfos) or [uniqueValueGroups](https://developers.arcgis.com/javascript/latest/references/core/renderers/UniqueValueRenderer/#uniqueValueGroups).
*
* This property is typically used as an alternative to [field](https://developers.arcgis.com/javascript/latest/references/core/renderers/UniqueValueRenderer/#field) for data-driven
* visualizations.
*
* @see [Arcade Visualization Profile](https://developers.arcgis.com/javascript/latest/arcade/#visualization)
* @example
* let renderer = {
* type: "unique-value", // autocasts as new UniqueValueRenderer()
* valueExpression: "When($feature.count < 20, 'low', $feature.count >= 20 && $feature.count < 70, 'moderate', $feature.count >=70, 'high', 'other')",
* uniqueValueInfos: [ ... ], // assigns symbols to features evaluating to 'low', 'moderate', or 'high'
* };
*/
accessor valueExpression: string | null | undefined;
/**
* The title identifying and describing the associated [Arcade](https://developers.arcgis.com/javascript/latest/arcade/)
* expression as defined in the [valueExpression](https://developers.arcgis.com/javascript/latest/references/core/renderers/UniqueValueRenderer/#valueExpression) property. This is displayed
* as the title of the categories or groups in the [Legend](https://developers.arcgis.com/javascript/latest/references/map-components/components/arcgis-legend/)
* in the absence of a provided `title` in the [legendOptions](https://developers.arcgis.com/javascript/latest/references/core/renderers/UniqueValueRenderer/#legendOptions) property.
*
* @example
* renderer.valueExpression = "IIF($feature.POP > 500000, 'high', 'low')";
* renderer.valueExpressionTitle = "Classification";
*/
accessor valueExpressionTitle: string | null | undefined;
/**
* Adds a unique value and symbol to the renderer. You can provide the value and its associated symbol as
* individual arguments or as an info object.
*
* @param valueOrInfo - The value to match. The value can be provided
* as an individual argument or as an [info object described in uniqueValueInfos](https://developers.arcgis.com/javascript/latest/references/core/renderers/UniqueValueRenderer/#uniqueValueInfos).
* @param symbol - The symbol used to represent features matching the
* specified `value`.
* @example
* let renderer = {
* type: "unique-value", // autocasts as new UniqueValueRenderer()
* field: "REGION",
* defaultSymbol: { type: "simple-fill" } // autocasts as new SimpleFillSymbol()
* };
* // Add a unique value info for the "North" region
* // using individual function arguments
* renderer.addUniqueValueInfo({
* value: "North",
* symbol: {
* type: "simple-fill", // autocasts as new SimpleFillSymbol()
* color: "blue"
* }
* });
* @example
* // Add a unique value info for the "West" region
* // using a unique info object
* renderer.addUniqueValueInfo({
* value: "West",
* symbol: new SimpleFillSymbol({
* color: "yellow"
* }),
* label: "West region" // will display this text in legend
* });
*/
addUniqueValueInfo(valueOrInfo: string | UniqueValueInfoProperties, symbol?: SymbolUnionProperties): void;
/**
* Creates a deep clone of the renderer.
*
* @returns A deep clone of the object that
* invoked this method.
* @example
* // Creates a deep clone of the first layer's renderer
* let renderer = view.map.layers.at(0).renderer.clone();
*/
clone(): UniqueValueRenderer;
/**
* Returns rendering and legend information (as defined by the renderer) associated with the given graphic.
*
* @param graphic - The graphic whose rendering and legend information will be returned.
* @returns Resolves to an object describing the UniqueValueInfo
* object to which the input graphic belongs as defined by the renderer.
* @example
* view.on("click", function(event){
* view.hitTest(event)
* .then(function(hitResponse){
* const resultGraphic = hitResponse.results[0].graphic;
* // assumes the layer's renderer is a UniqueValueRenderer instance
* return layer.renderer.getUniqueValueInfo(resultGraphic);
* }).then(function(uniqueValueInfo){
* // returns the unique value info to which the graphic belongs.
* });
* });
*/
getUniqueValueInfo(graphic: Graphic): Promise<UniqueValueInfo>;
/**
* Removes a unique value from the renderer.
*
* @param value - Value to remove from [uniqueValueInfos](https://developers.arcgis.com/javascript/latest/references/core/renderers/UniqueValueRenderer/#uniqueValueInfos).
* @example
* // removes the unique value info object for
* // features in the West region. They will now
* // be displayed with the default symbol and label
* renderer.removeUniqueValueInfo("West");
*/
removeUniqueValueInfo(value: string | number): void;
}
declare const UniqueValueRendererSuperclass: typeof Renderer & typeof VisualVariablesMixin