@arcgis/core
Version:
ArcGIS Maps SDK for JavaScript: A complete 2D and 3D mapping and data visualization API
160 lines (158 loc) • 11.1 kB
TypeScript
import type Renderer from "./Renderer.js";
import type { VisualVariablesMixin, VisualVariablesMixinProperties } from "./mixins/VisualVariablesMixin.js";
import type { SymbolUnion } from "../symbols/types.js";
import type { WebStyleSymbolProperties } from "../symbols/WebStyleSymbol.js";
import type { PolygonSymbol3DProperties } from "../symbols/PolygonSymbol3D.js";
import type { PointSymbol3DProperties } from "../symbols/PointSymbol3D.js";
import type { MeshSymbol3DProperties } from "../symbols/MeshSymbol3D.js";
import type { LineSymbol3DProperties } from "../symbols/LineSymbol3D.js";
import type { LabelSymbol3DProperties } from "../symbols/LabelSymbol3D.js";
import type { CIMSymbolProperties } from "../symbols/CIMSymbol.js";
import type { TextSymbolProperties } from "../symbols/TextSymbol.js";
import type { SimpleMarkerSymbolProperties } from "../symbols/SimpleMarkerSymbol.js";
import type { SimpleLineSymbolProperties } from "../symbols/SimpleLineSymbol.js";
import type { SimpleFillSymbolProperties } from "../symbols/SimpleFillSymbol.js";
import type { PictureMarkerSymbolProperties } from "../symbols/PictureMarkerSymbol.js";
import type { PictureFillSymbolProperties } from "../symbols/PictureFillSymbol.js";
import type { RendererProperties } from "./Renderer.js";
export interface SimpleRendererProperties extends RendererProperties, VisualVariablesMixinProperties, Partial<Pick<SimpleRenderer, "label">> {
/**
* The symbol used by the renderer to visualize all features in the layer.
*
* @example
* let renderer = {
* type: "simple", // autocasts as new SimpleRenderer()
* symbol: {
* type: "simple-fill", // autocasts as new SimpleFillSymbol()
* color: [ 255, 128, 0, 0.5 ],
* outline: { // autocasts as new SimpleLineSymbol()
* width: 1,
* color: "white"
* }
* }
* };
*/
symbol?: (((PictureFillSymbolProperties & { type: "picture-fill" }) | (PictureMarkerSymbolProperties & { type: "picture-marker" }) | (SimpleFillSymbolProperties & { type: "simple-fill" }) | (SimpleLineSymbolProperties & { type: "simple-line" }) | (SimpleMarkerSymbolProperties & { type: "simple-marker" }) | (TextSymbolProperties & { type: "text" }) | (CIMSymbolProperties & { type: "cim" })) | ((LabelSymbol3DProperties & { type: "label-3d" }) | (LineSymbol3DProperties & { type: "line-3d" }) | (MeshSymbol3DProperties & { type: "mesh-3d" }) | (PointSymbol3DProperties & { type: "point-3d" }) | (PolygonSymbol3DProperties & { type: "polygon-3d" })) | (WebStyleSymbolProperties & { type: "web-style" })) | null;
}
/**
* SimpleRenderer renders all features in a [Layer](https://developers.arcgis.com/javascript/latest/references/core/layers/Layer/) with one
* [Symbol](https://developers.arcgis.com/javascript/latest/references/core/symbols/Symbol/).
* This renderer may be used to simply visualize the location of geographic features. For example,
* layers representing political boundaries, cities, buildings, rivers, etc. that are typically used for
* providing geographic context in an application may be defined with a single symbol
* per layer.
*
* > [!WARNING]
* >
* > **Supported layers**
* >
* > SimpleRenderer may only be used to create visualizations for the following layer types: [FeatureLayer](https://developers.arcgis.com/javascript/latest/references/core/layers/FeatureLayer/), [SceneLayer](https://developers.arcgis.com/javascript/latest/references/core/layers/SceneLayer/), [MapImageLayer](https://developers.arcgis.com/javascript/latest/references/core/layers/MapImageLayer/), [CSVLayer](https://developers.arcgis.com/javascript/latest/references/core/layers/CSVLayer/), [GeoJSONLayer](https://developers.arcgis.com/javascript/latest/references/core/layers/GeoJSONLayer/), [OGCFeatureLayer](https://developers.arcgis.com/javascript/latest/references/core/layers/OGCFeatureLayer/), [WFSLayer](https://developers.arcgis.com/javascript/latest/references/core/layers/WFSLayer/), and [StreamLayer](https://developers.arcgis.com/javascript/latest/references/core/layers/StreamLayer/)
*
* The example in the screenshot below contains three layers: one of state boundaries, another of highways,
* and another of cities. Each gives geographic context to the map.
*
* [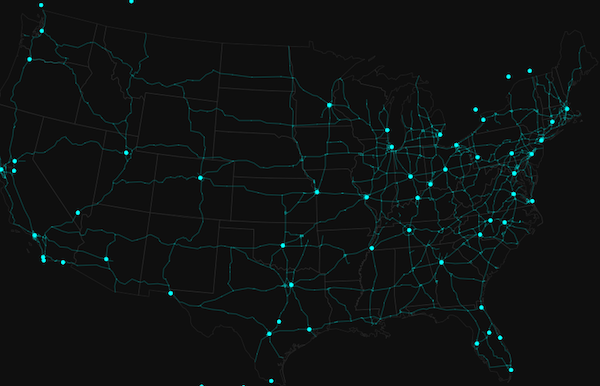](https://developers.arcgis.com/javascript/latest/sample-code/visualization-location-simple/)
*
* SimpleRenderer can also be used to thematically visualize numeric data attributes. This is
* accomplished with [visual variables](https://developers.arcgis.com/javascript/latest/references/core/renderers/SimpleRenderer/#visualVariables). Visual variables define the parameters
* for data-driven visualizations of numeric data. They allow you to
* easily map continuous ramps of [color](https://developers.arcgis.com/javascript/latest/references/core/renderers/visualVariables/ColorVariable/), [size](https://developers.arcgis.com/javascript/latest/references/core/renderers/visualVariables/SizeVariable/), and/or [opacity](https://developers.arcgis.com/javascript/latest/references/core/renderers/visualVariables/OpacityVariable/)
* to minimum and maximum data values of one of the layer's numeric attribute fields.
*
* The example below adds [size](https://developers.arcgis.com/javascript/latest/references/core/renderers/visualVariables/SizeVariable/) and [color](https://developers.arcgis.com/javascript/latest/references/core/renderers/visualVariables/ColorVariable/) visual variables in a 3D
* [SceneView](https://developers.arcgis.com/javascript/latest/references/core/views/SceneView/) to thematically visualize a hurricane's windspeed in
* various locations along its path.
*
* [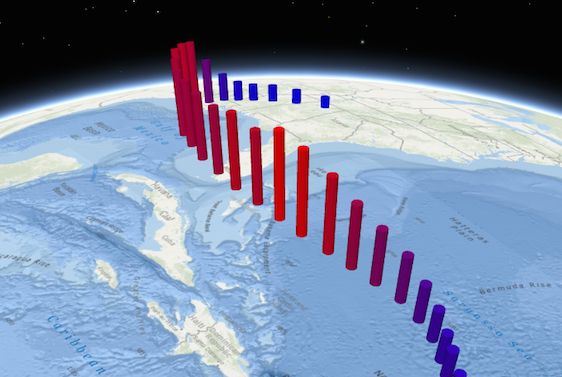](https://developers.arcgis.com/javascript/latest/sample-code/visualization-multivariate-3d/)
*
* To read more about visual variables, see the [visualVariables](https://developers.arcgis.com/javascript/latest/references/core/renderers/SimpleRenderer/#visualVariables) property.
*
* @since 4.0
* @see [Styles and data visualization](https://developers.arcgis.com/javascript/latest/visualization/)
* @see [Sample - Visualize features with simple symbols](https://developers.arcgis.com/javascript/latest/sample-code/visualization-location-simple/)
* @see [Sample - SceneLayer](https://developers.arcgis.com/javascript/latest/sample-code/layers-scenelayer/)
* @see [Sample - Continuous color](https://developers.arcgis.com/javascript/latest/sample-code/visualization-vv-color/)
* @see [Sample - Continuous size](https://developers.arcgis.com/javascript/latest/sample-code/visualization-vv-size/)
* @see [Sample - Visualize features with realistic 3D symbols](https://developers.arcgis.com/javascript/latest/sample-code/visualization-trees-realistic/)
* @example
* // Set a basic symbol on a layer to visualize all features the same way
* let citiesRenderer = {
* type: "simple", // autocasts as new SimpleRenderer()
* symbol: {
* type: "simple-marker", // autocasts as new SimpleMarkerSymbol()
* size: 6,
* color: "black",
* outline: { // autocasts as new SimpleLineSymbol()
* width: 0.5,
* color: "white"
* }
* }
* };
* let citiesLayer = new FeatureLayer({
* url: "http://url.to.service",
* renderer: citiesRenderer
* });
* @example
* // Set a continuous color ramp on the renderer with visual variables
* let citiesRenderer = {
* type: "simple", // autocasts as new SimpleRenderer()
* symbol: { type: "simple-fill" }, // autocasts as new SimpleFillSymbol()
* visualVariables: [{
* type: "color",
* field: "POPULATION",
* normalizationField: "SQ_KM",
* // features with 30 ppl/sq km or below are assigned the first color
* stops: [{ value: 100, color: "#fffcd4" },
* { value: 500, color: "#0d2644" }]
* }]
* };
* let citiesLayer = new FeatureLayer({
* url: "http://url.to.service",
* renderer: citiesRenderer
* });
*/
export default class SimpleRenderer extends SimpleRendererSuperclass {
constructor(properties?: SimpleRendererProperties);
/**
* The label for the renderer. This describes what features with the given [symbol](https://developers.arcgis.com/javascript/latest/references/core/renderers/SimpleRenderer/#symbol)
* represent in the real world. This will display next to the layer's [symbol](https://developers.arcgis.com/javascript/latest/references/core/renderers/SimpleRenderer/#symbol)
* inside the [Legend](https://developers.arcgis.com/javascript/latest/references/map-components/components/arcgis-legend/).
*
* This text is not displayed in the [Legend](https://developers.arcgis.com/javascript/latest/references/map-components/components/arcgis-legend/) when
* [visualVariables](https://developers.arcgis.com/javascript/latest/references/core/renderers/SimpleRenderer/#visualVariables) are used. When the renderer contains
* [visualVariables](https://developers.arcgis.com/javascript/latest/references/core/renderers/SimpleRenderer/#visualVariables), you should set the `title` property in
* `legendOptions` on each visual variable to describe the visualization.
*/
accessor label: string | null | undefined;
/**
* The symbol used by the renderer to visualize all features in the layer.
*
* @example
* let renderer = {
* type: "simple", // autocasts as new SimpleRenderer()
* symbol: {
* type: "simple-fill", // autocasts as new SimpleFillSymbol()
* color: [ 255, 128, 0, 0.5 ],
* outline: { // autocasts as new SimpleLineSymbol()
* width: 1,
* color: "white"
* }
* }
* };
*/
get symbol(): SymbolUnion | null | undefined;
set symbol(value: (((PictureFillSymbolProperties & { type: "picture-fill" }) | (PictureMarkerSymbolProperties & { type: "picture-marker" }) | (SimpleFillSymbolProperties & { type: "simple-fill" }) | (SimpleLineSymbolProperties & { type: "simple-line" }) | (SimpleMarkerSymbolProperties & { type: "simple-marker" }) | (TextSymbolProperties & { type: "text" }) | (CIMSymbolProperties & { type: "cim" })) | ((LabelSymbol3DProperties & { type: "label-3d" }) | (LineSymbol3DProperties & { type: "line-3d" }) | (MeshSymbol3DProperties & { type: "mesh-3d" }) | (PointSymbol3DProperties & { type: "point-3d" }) | (PolygonSymbol3DProperties & { type: "polygon-3d" })) | (WebStyleSymbolProperties & { type: "web-style" })) | null | undefined);
/** The type of renderer. */
get type(): "simple";
/**
* Creates a deep clone of the renderer.
*
* @returns A deep clone of the object that
* invoked this method.
* @example
* // Creates a deep clone of the first layer's renderer
* let renderer = view.map.layers.at(0).renderer.clone();
*/
clone(): SimpleRenderer;
}
declare const SimpleRendererSuperclass: typeof Renderer & typeof VisualVariablesMixin