@arcgis/core
Version:
ArcGIS Maps SDK for JavaScript: A complete 2D and 3D mapping and data visualization API
122 lines (120 loc) • 10.3 kB
TypeScript
import type AuthoringInfo from "./support/AuthoringInfo.js";
import type { JSONSupport } from "../core/JSONSupport.js";
import type { RendererType } from "./types.js";
import type { AuthoringInfoProperties } from "./support/AuthoringInfo.js";
export interface RendererProperties {
/**
* Authoring metadata only included in renderers generated from one of the
* Smart Mapping creator methods, such as
* [sizeRendererCreator.createContinuousRenderer()](https://developers.arcgis.com/javascript/latest/references/core/smartMapping/renderers/size/#createContinuousRenderer) or
* [colorRendererCreator.createContinuousRenderer()](https://developers.arcgis.com/javascript/latest/references/core/smartMapping/renderers/color/#createContinuousRenderer). This includes information from UI
* elements such as sliders and selected classification methods
* and themes. This allows the authoring clients to save specific overridable settings
* so that next time it is accessed via the UI, their selections can be remembered.
*/
authoringInfo?: AuthoringInfoProperties | null;
}
/**
* Renderers define how to visually represent each feature in one of the following layer types:
*
* * [FeatureLayer](https://developers.arcgis.com/javascript/latest/references/core/layers/FeatureLayer/)
* * [SceneLayer](https://developers.arcgis.com/javascript/latest/references/core/layers/SceneLayer/)
* * [MapImageLayer](https://developers.arcgis.com/javascript/latest/references/core/layers/MapImageLayer/)
* * [CSVLayer](https://developers.arcgis.com/javascript/latest/references/core/layers/CSVLayer/)
* * [GeoJSONLayer](https://developers.arcgis.com/javascript/latest/references/core/layers/GeoJSONLayer/)
* * [OGCFeatureLayer](https://developers.arcgis.com/javascript/latest/references/core/layers/OGCFeatureLayer/)
* * [StreamLayer](https://developers.arcgis.com/javascript/latest/references/core/layers/StreamLayer/)
* * [WFSLayer](https://developers.arcgis.com/javascript/latest/references/core/layers/WFSLayer/)
*
* The Renderer object contains drawing information for the layer and is the base class for all renderers.
*
* There are several types of renderers available for visualizing data. Each serves a different purpose,
* allowing you to explore your data and tell a visual story about it by combining geography and statistics.
* Most cartographic visualizations fall into one of the following categories.
*
* Visualization type | Renderer
* ----------|---------
* Location only | [SimpleRenderer](https://developers.arcgis.com/javascript/latest/references/core/renderers/SimpleRenderer/), [HeatmapRenderer](https://developers.arcgis.com/javascript/latest/references/core/renderers/HeatmapRenderer/)
* Unique (typed) values | [UniqueValueRenderer](https://developers.arcgis.com/javascript/latest/references/core/renderers/UniqueValueRenderer/)
* Class breaks | [ClassBreaksRenderer](https://developers.arcgis.com/javascript/latest/references/core/renderers/ClassBreaksRenderer/)
* Continuous color/size | [SimpleRenderer](https://developers.arcgis.com/javascript/latest/references/core/renderers/SimpleRenderer/) or [UniqueValueRenderer](https://developers.arcgis.com/javascript/latest/references/core/renderers/UniqueValueRenderer/) with [SimpleRenderer.visualVariables](https://developers.arcgis.com/javascript/latest/references/core/renderers/SimpleRenderer/#visualVariables)
* Multivariate | [SimpleRenderer](https://developers.arcgis.com/javascript/latest/references/core/renderers/SimpleRenderer/) or [UniqueValueRenderer](https://developers.arcgis.com/javascript/latest/references/core/renderers/UniqueValueRenderer/) with [SimpleRenderer.visualVariables](https://developers.arcgis.com/javascript/latest/references/core/renderers/SimpleRenderer/#visualVariables), [DotDensityRenderer](https://developers.arcgis.com/javascript/latest/references/core/renderers/DotDensityRenderer/), [PieChartRenderer](https://developers.arcgis.com/javascript/latest/references/core/renderers/PieChartRenderer/)
*
* ### Location
*
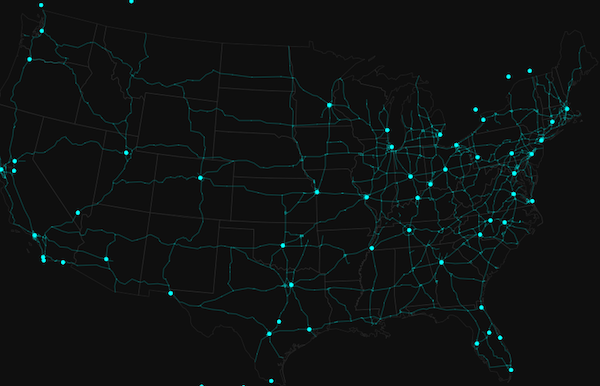
* In many cases, the user just wants to see where a set of features are located. Some examples might be
* political boundaries, cities, buildings, rivers, etc. These are scenarios where you want all features
* in the layer to have the same symbol. To accomplish this you would use a
* [SimpleRenderer](https://developers.arcgis.com/javascript/latest/references/core/renderers/SimpleRenderer/).
*
* The example in the screenshot below contains three layers; each uses a
* [SimpleRenderer](https://developers.arcgis.com/javascript/latest/references/core/renderers/SimpleRenderer/) to assign all features the same symbol.
* The polygon layer represents states with no fill and a gray outline. The polyline layer visualizes
* highways with bright blue lines. The point layer depicts cities as marker symbols with the same bright blue color.
*
* [](https://developers.arcgis.com/javascript/latest/sample-code/visualization-location-simple/)
*
* Read more on the [SimpleRenderer](https://developers.arcgis.com/javascript/latest/references/core/renderers/SimpleRenderer/) page.
*
* ### Unique types
*
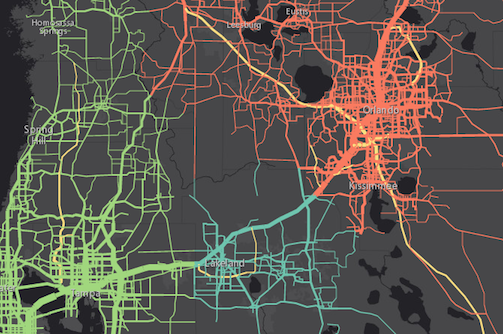
* [UniqueValueRenderer](https://developers.arcgis.com/javascript/latest/references/core/renderers/UniqueValueRenderer/) allows you to symbolize features based on one
* or more matching string attribute values. Unique values are typically differentiated with colors,
* fill styles, or images to represent features of various types.
*
* In the image below, each line is symbolized with a different color depending on the jurisdiction
* to which the highway belongs. For example, green lines are highways in the "Tampa District" whereas
* red lines are highways in the "Central District".
*
* [](https://developers.arcgis.com/javascript/latest/sample-code/visualization-location-types/)
*
* Read more on the [UniqueValueRenderer](https://developers.arcgis.com/javascript/latest/references/core/renderers/UniqueValueRenderer/) page.
*
* ### Class breaks
*
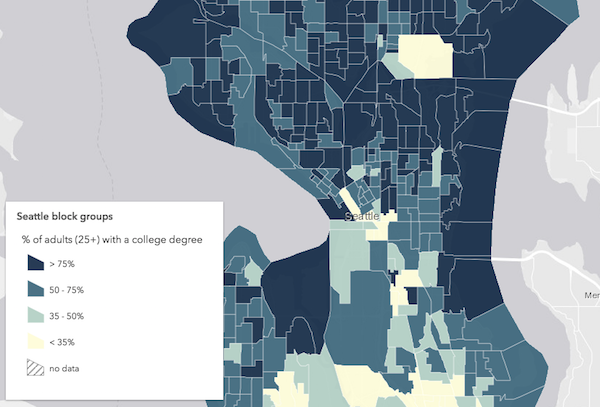
* [ClassBreaksRenderer](https://developers.arcgis.com/javascript/latest/references/core/renderers/ClassBreaksRenderer/) sets the symbol of each feature in a layer
* based on the value of a numeric attribute. Symbols are assigned to classes, or ranges
* of data. Each feature is assigned a symbol based on the class in which the value
* of the attribute falls. In the example below, a [FeatureLayer](https://developers.arcgis.com/javascript/latest/references/core/layers/FeatureLayer/) representing
* block groups is rendered with a [ClassBreaksRenderer](https://developers.arcgis.com/javascript/latest/references/core/renderers/ClassBreaksRenderer/). Features where fewer
* than 35% of the population have a college degree are rendered with a deep green color. Features
* where between 35% and 50% of the population have a college degree are rendered with a pale green symbol.
* The other features are similarly rendered based on the value of the attribute of interest.
*
* [](https://developers.arcgis.com/javascript/latest/sample-code/visualization-classbreaks/)
*
* Read more on the [ClassBreaksRenderer](https://developers.arcgis.com/javascript/latest/references/core/renderers/ClassBreaksRenderer/) page.
*
* ### Continuous ramps and multivariate visualizations
*
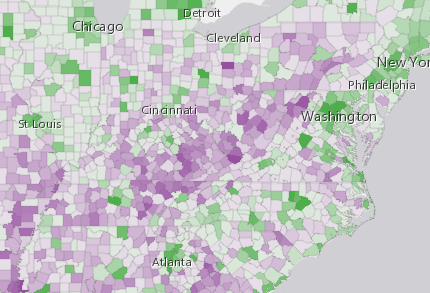
* Rather than manually creating several class breaks to visualize numeric data, you can depict more variation
* in your layer using continuous styles. The color, size, opacity, and rotation [SimpleRenderer.visualVariables](https://developers.arcgis.com/javascript/latest/references/core/renderers/SimpleRenderer/#visualVariables)
* allow you to do this in either a [SimpleRenderer](https://developers.arcgis.com/javascript/latest/references/core/renderers/SimpleRenderer/), [UniqueValueRenderer](https://developers.arcgis.com/javascript/latest/references/core/renderers/UniqueValueRenderer/), or [ClassBreaksRenderer](https://developers.arcgis.com/javascript/latest/references/core/renderers/ClassBreaksRenderer/).
*
* The example below uses a [UniqueValueRenderer](https://developers.arcgis.com/javascript/latest/references/core/renderers/UniqueValueRenderer/) with an
* [opacity](https://developers.arcgis.com/javascript/latest/references/core/renderers/visualVariables/OpacityVariable/)
* visual variable to map predominant types and the strength of their predominance in relation
* to other variables.
*
* [](https://developers.arcgis.com/javascript/latest/sample-code/visualization-vv-color/)
*
* See [visual variables](https://developers.arcgis.com/javascript/latest/references/core/renderers/SimpleRenderer/#visualVariables) for more information.
*
* @since 4.0
* @see [Styles and data visualization](https://developers.arcgis.com/javascript/latest/visualization/)
*/
export default abstract class Renderer extends JSONSupport {
/**
* Authoring metadata only included in renderers generated from one of the
* Smart Mapping creator methods, such as
* [sizeRendererCreator.createContinuousRenderer()](https://developers.arcgis.com/javascript/latest/references/core/smartMapping/renderers/size/#createContinuousRenderer) or
* [colorRendererCreator.createContinuousRenderer()](https://developers.arcgis.com/javascript/latest/references/core/smartMapping/renderers/color/#createContinuousRenderer). This includes information from UI
* elements such as sliders and selected classification methods
* and themes. This allows the authoring clients to save specific overridable settings
* so that next time it is accessed via the UI, their selections can be remembered.
*/
get authoringInfo(): AuthoringInfo | null | undefined;
set authoringInfo(value: AuthoringInfoProperties | null | undefined);
/** The renderer type. */
get type(): RendererType;
}