@arcgis/core
Version:
ArcGIS Maps SDK for JavaScript: A complete 2D and 3D mapping and data visualization API
341 lines (339 loc) • 14.9 kB
TypeScript
import type Color from "../Color.js";
import type Renderer from "./Renderer.js";
import type AttributeColorInfo from "./support/AttributeColorInfo.js";
import type OthersCategory from "./support/OthersCategory.js";
import type RendererLegendOptions from "./support/RendererLegendOptions.js";
import type OpacityVariable from "./visualVariables/OpacityVariable.js";
import type SizeVariable from "./visualVariables/SizeVariable.js";
import type CIMSymbol from "../symbols/CIMSymbol.js";
import type SimpleFillSymbol from "../symbols/SimpleFillSymbol.js";
import type SimpleLineSymbol from "../symbols/SimpleLineSymbol.js";
import type { ClonableMixin } from "../core/Clonable.js";
import type { RendererProperties } from "./Renderer.js";
import type { VisualVariablesMixin, VisualVariablesMixinProperties } from "./mixins/VisualVariablesMixin.js";
import type { AttributeColorInfoProperties } from "./support/AttributeColorInfo.js";
import type { CIMSymbolProperties } from "../symbols/CIMSymbol.js";
import type { SimpleFillSymbolProperties } from "../symbols/SimpleFillSymbol.js";
import type { ColorLike } from "../Color.js";
import type { OthersCategoryProperties } from "./support/OthersCategory.js";
import type { RendererLegendOptionsProperties } from "./support/RendererLegendOptions.js";
import type { SimpleLineSymbolProperties } from "../symbols/SimpleLineSymbol.js";
import type { OpacityVariableProperties } from "./visualVariables/OpacityVariable.js";
import type { SizeVariableProperties } from "./visualVariables/SizeVariable.js";
export interface PieChartRendererProperties extends RendererProperties, VisualVariablesMixinProperties, Partial<Pick<PieChartRenderer, "defaultLabel" | "holePercentage">> {
/**
* Defines the variable(s) to include in the pie charts. This is an array of objects, each of which references
* a numeric field value or [Arcade](https://developers.arcgis.com/javascript/latest/arcade/) expression used to drive the width of each sector. You
* must also set a color corresponding to each value.
*
* This property is limited to no more than 10 attributes.
*
* @see [Arcade Visualization Profile](https://developers.arcgis.com/javascript/latest/arcade/#visualization)
* @example
* renderer.attributes = [{
* field: "English",
* label: "English speakers",
* color: "red"
* }, {
* field: "Spanish",
* label: "Spanish speakers",
* color: "blue"
* }, {
* field: "Other",
* label: "All other languages",
* color: "brown"
* }];
*/
attributes?: AttributeColorInfoProperties[];
/**
* The symbol used to render polygons behind the pie symbols. Only applicable to polygon layers.
*
* > [!WARNING]
* >
* > Support for [CIMSymbol](https://developers.arcgis.com/javascript/latest/references/core/symbols/CIMSymbol/) was added at version 4.31.
*
* @example
* renderer.backgroundFillSymbol = {
* color: [51, 204, 51, 0.3],
* outline: {
* width: 1,
* color: [255,255,255,0.3]
* }
* };
*/
backgroundFillSymbol?: (SimpleFillSymbolProperties & { type: "simple-fill" }) | (CIMSymbolProperties & { type: "cim" }) | null;
/**
* The color used to visualize features whose [attributes](https://developers.arcgis.com/javascript/latest/references/core/renderers/PieChartRenderer/#attributes) all have null or empty values.
* By default, this is a transparent color, so no chart displays. You should set this value
* if you would like to show areas with features, but no data associated with it.
*
* @default new Color([0, 0, 0, 0])
* @see [defaultLabel](https://developers.arcgis.com/javascript/latest/references/core/renderers/PieChartRenderer/#defaultLabel)
* @example renderer.defaultColor = "lightgray";
*/
defaultColor?: ColorLike;
/**
* An object providing options for describing the renderer in the Legend.
*
* @example
* renderer.legendOptions = {
* title: "Population by educational attainment",
* order: "descending-values",
* };
*/
legendOptions?: RendererLegendOptionsProperties | null;
/**
* Defines the rules for how to aggregate small categories to a generic "others" category.
*
* @example
* // all categories that make up less than 4%
* // of the total will combine to an "others"
* // category represented with a gray color.
* renderer.othersCategory = {
* color: "gray",
* threshold: 0.04
* };
*/
othersCategory?: OthersCategoryProperties | null;
/**
* Defines the outline of the pie chart. The outline width and color is applied to the outer outline of the pie
* (and inner outline in the case of donut charts).
*
* @example
* renderer.outline = {
* width: 0.5,
* color: "black"
* };
*/
outline?: SimpleLineSymbolProperties | null;
/**
* Defines the size of each pie chart in points. This value may be autocast with a string expressing size in points or pixels (e.g. 12px).
*
* @default 12
* @example
* // size in points
* renderer.size = 14;
* @example
* // size in pixels
* renderer.size = "20px";
* @example
* // size in points
* renderer.size = "14pt";
*/
size?: number | string;
/**
* An array of [Size Visual Variable](https://developers.arcgis.com/javascript/latest/references/core/renderers/visualVariables/SizeVariable/) objects.
* Typically, this is used to vary the size of each pie chart based on the sum of all categories included in the pie.
*
* @example
* renderer.visualVariables = [{
* type: "size",
* valueExpression: "$feature.category1 + $feature.category2 + $feature.category3",
* valueExpressionTitle: "Total population"
* minSize: 20,
* maxSize: 72,
* minDataValue: 100,
* maxDataValue: 1000000
* }];
* @see [Styles and data visualization](https://developers.arcgis.com/javascript/latest/visualization/)
*/
visualVariables?: ((SizeVariableProperties & { type: "size" }) | (OpacityVariableProperties & { type: "opacity" }))[] | null;
}
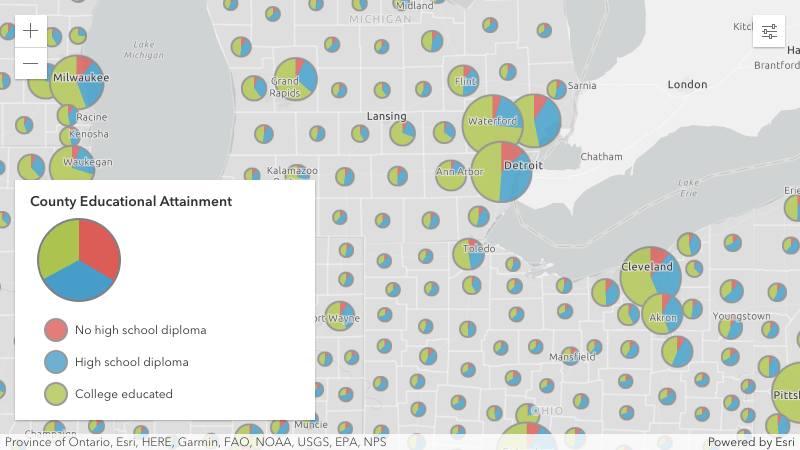
/**
* PieChartRenderer allows you to create a pie chart for each feature in the layer.
* The value and color of each pie slice is specified in the [attributes](https://developers.arcgis.com/javascript/latest/references/core/renderers/PieChartRenderer/#attributes)
* property. You can vary the size of each pie based on data with any other field value or Arcade
* expression using [visualVariables](https://developers.arcgis.com/javascript/latest/references/core/renderers/PieChartRenderer/#visualVariables).
*
* [](https://developers.arcgis.com/javascript/latest/sample-code/visualization-pie-chart/)
*
* > [!WARNING]
* >
* > **Known Limitations**
* >
* > PieChartRenderer is only supported in 2D [MapView](https://developers.arcgis.com/javascript/latest/references/core/views/MapView/)
* > PieChartRenderer is only supported with the following layer types containing point or polygon geometries: [FeatureLayer](https://developers.arcgis.com/javascript/latest/references/core/layers/FeatureLayer/), [CSVLayer](https://developers.arcgis.com/javascript/latest/references/core/layers/CSVLayer/), [GeoJSONLayer](https://developers.arcgis.com/javascript/latest/references/core/layers/GeoJSONLayer/), [WFSLayer](https://developers.arcgis.com/javascript/latest/references/core/layers/WFSLayer/), and [OGCFeatureLayer](https://developers.arcgis.com/javascript/latest/references/core/layers/OGCFeatureLayer/)
* > PieChartRenderer is not supported with [FeatureReductionCluster](https://developers.arcgis.com/javascript/latest/references/core/layers/support/FeatureReductionCluster/)
*
* @since 4.24
* @see [Sample - pie charts](https://developers.arcgis.com/javascript/latest/sample-code/visualization-pie-chart/)
* @example
* layer.renderer = {
* type: "pie-chart", // autocasts as new PieChartRenderer()
* attributes: [{
* field: "ELEMENTARY_SCHOOL",
* label: "Elementary School",
* color: "red"
* }, {
* field: "MIDDLE_SCHOOL",
* label: "Middle School",
* color: "blue"
* }, {
* field: "HIGH_SCHOOL",
* label: "High School",
* color: "orange"
* }, {
* valueExpression: "$feature.ASSOCIATES_DEGREE + $feature.BACHELOR_DEGREE + $feature.MASTER_DEGREE + $feature.DOCTORATE_DEGREE",
* valueExpressionTitle: "People who completed university",
* label: "University"
* color: "green"
* }]
* };
*/
export default class PieChartRenderer extends PieChartRendererSuperclass {
constructor(properties?: PieChartRendererProperties);
/**
* Defines the variable(s) to include in the pie charts. This is an array of objects, each of which references
* a numeric field value or [Arcade](https://developers.arcgis.com/javascript/latest/arcade/) expression used to drive the width of each sector. You
* must also set a color corresponding to each value.
*
* This property is limited to no more than 10 attributes.
*
* @see [Arcade Visualization Profile](https://developers.arcgis.com/javascript/latest/arcade/#visualization)
* @example
* renderer.attributes = [{
* field: "English",
* label: "English speakers",
* color: "red"
* }, {
* field: "Spanish",
* label: "Spanish speakers",
* color: "blue"
* }, {
* field: "Other",
* label: "All other languages",
* color: "brown"
* }];
*/
get attributes(): AttributeColorInfo[];
set attributes(value: AttributeColorInfoProperties[]);
/**
* The symbol used to render polygons behind the pie symbols. Only applicable to polygon layers.
*
* > [!WARNING]
* >
* > Support for [CIMSymbol](https://developers.arcgis.com/javascript/latest/references/core/symbols/CIMSymbol/) was added at version 4.31.
*
* @example
* renderer.backgroundFillSymbol = {
* color: [51, 204, 51, 0.3],
* outline: {
* width: 1,
* color: [255,255,255,0.3]
* }
* };
*/
get backgroundFillSymbol(): SimpleFillSymbol | CIMSymbol | null | undefined;
set backgroundFillSymbol(value: (SimpleFillSymbolProperties & { type: "simple-fill" }) | (CIMSymbolProperties & { type: "cim" }) | null | undefined);
/**
* The color used to visualize features whose [attributes](https://developers.arcgis.com/javascript/latest/references/core/renderers/PieChartRenderer/#attributes) all have null or empty values.
* By default, this is a transparent color, so no chart displays. You should set this value
* if you would like to show areas with features, but no data associated with it.
*
* @default new Color([0, 0, 0, 0])
* @see [defaultLabel](https://developers.arcgis.com/javascript/latest/references/core/renderers/PieChartRenderer/#defaultLabel)
* @example renderer.defaultColor = "lightgray";
*/
get defaultColor(): Color;
set defaultColor(value: ColorLike);
/**
* Describes the [defaultColor](https://developers.arcgis.com/javascript/latest/references/core/renderers/PieChartRenderer/#defaultColor) in the [Legend](https://developers.arcgis.com/javascript/latest/references/map-components/components/arcgis-legend/).
*
* @example renderer.defaultLabel = "No data";
*/
accessor defaultLabel: string | null | undefined;
/**
* Use this property to create a donut chart. Defines the size of the hole to cut from the center of the chart as a percentage
* of the entire pie chart. Accepted values are between 0 and 1.
* For example, a hole percentage of `0` will render a full pie chart. A ratio of `0.5` will remove 50% of
* the center of the pie, creating a donut.
*
* @default 0
* @example renderer.holePercentage = 0.5;
*/
accessor holePercentage: number;
/**
* An object providing options for describing the renderer in the Legend.
*
* @example
* renderer.legendOptions = {
* title: "Population by educational attainment",
* order: "descending-values",
* };
*/
get legendOptions(): RendererLegendOptions | null | undefined;
set legendOptions(value: RendererLegendOptionsProperties | null | undefined);
/**
* Defines the rules for how to aggregate small categories to a generic "others" category.
*
* @example
* // all categories that make up less than 4%
* // of the total will combine to an "others"
* // category represented with a gray color.
* renderer.othersCategory = {
* color: "gray",
* threshold: 0.04
* };
*/
get othersCategory(): OthersCategory | null | undefined;
set othersCategory(value: OthersCategoryProperties | null | undefined);
/**
* Defines the outline of the pie chart. The outline width and color is applied to the outer outline of the pie
* (and inner outline in the case of donut charts).
*
* @example
* renderer.outline = {
* width: 0.5,
* color: "black"
* };
*/
get outline(): SimpleLineSymbol | null | undefined;
set outline(value: SimpleLineSymbolProperties | null | undefined);
/**
* Defines the size of each pie chart in points. This value may be autocast with a string expressing size in points or pixels (e.g. 12px).
*
* @default 12
* @example
* // size in points
* renderer.size = 14;
* @example
* // size in pixels
* renderer.size = "20px";
* @example
* // size in points
* renderer.size = "14pt";
*/
get size(): number;
set size(value: number | string);
/** The type of renderer. */
get type(): "pie-chart";
/**
* An array of [Size Visual Variable](https://developers.arcgis.com/javascript/latest/references/core/renderers/visualVariables/SizeVariable/) objects.
* Typically, this is used to vary the size of each pie chart based on the sum of all categories included in the pie.
*
* @example
* renderer.visualVariables = [{
* type: "size",
* valueExpression: "$feature.category1 + $feature.category2 + $feature.category3",
* valueExpressionTitle: "Total population"
* minSize: 20,
* maxSize: 72,
* minDataValue: 100,
* maxDataValue: 1000000
* }];
* @see [Styles and data visualization](https://developers.arcgis.com/javascript/latest/visualization/)
*/
get visualVariables(): (SizeVariable | OpacityVariable)[] | null | undefined;
set visualVariables(value: ((SizeVariableProperties & { type: "size" }) | (OpacityVariableProperties & { type: "opacity" }))[] | null | undefined);
/**
* Creates a deep clone of the renderer.
*
* @returns A deep clone of the object that
* invoked this method.
* @example
* // Creates a deep clone of the first layer's renderer
* let renderer = view.map.layers.at(0).renderer.clone();
*/
clone(): this;
}
declare const PieChartRendererSuperclass: typeof Renderer & typeof ClonableMixin & typeof VisualVariablesMixin