@arcgis/core
Version:
ArcGIS Maps SDK for JavaScript: A complete 2D and 3D mapping and data visualization API
321 lines (319 loc) • 18.1 kB
TypeScript
import type Renderer from "./Renderer.js";
import type HeatmapColorStop from "./support/HeatmapColorStop.js";
import type HeatmapLegendOptions from "./support/HeatmapLegendOptions.js";
import type { HeatmapColorStopProperties } from "./support/HeatmapColorStop.js";
import type { HeatmapLegendOptionsProperties } from "./support/HeatmapLegendOptions.js";
import type { RendererProperties } from "./Renderer.js";
export interface HeatmapRendererProperties extends RendererProperties, Partial<Pick<HeatmapRenderer, "field" | "maxDensity" | "minDensity" | "referenceScale" | "valueExpression" | "valueExpressionTitle">> {
/**
* An array of objects describing the renderer's color ramp. The ratio of a pixel's density value to the
* [maxDensity](https://developers.arcgis.com/javascript/latest/references/core/renderers/HeatmapRenderer/#maxDensity) of the renderer is mapped to a corresponding color.
* The color of the first stop (i.e. the stop with the lowest `ratio` value) must
* have an alpha value of `0` for the underlying basemap to be visible in the app.
*
* The default value is the following:
*
* ```js
* [
* { ratio: 0, color: "rgba(255, 140, 0, 0)" },
* { ratio: 0.75, color: "rgba(255, 140, 0, 1)" },
* { ratio: 0.9, color: "rgba(255, 0, 0, 1)" }
* ]
* ```
*/
colorStops?: HeatmapColorStopProperties[];
/**
* An object providing options for describing the renderer in the [Legend](https://developers.arcgis.com/javascript/latest/references/map-components/components/arcgis-legend/).
*
* @since 4.24
* @example
* renderer.legendOptions = {
* title: "Car crashes",
* minLabel: "Few crashes",
* maxLabel: "Frequent crashes"
* };
*/
legendOptions?: HeatmapLegendOptionsProperties | null;
/**
* The search radius (in points) used to create a smooth kernel surface fitted around each point.
* The density value is highest at the location of the point and decreases as the distance away
* from the point increases. The density value is `0` at the distance specified in `radius`
* from the point.
*
* > [!WARNING]
* >
* > **Known Limitations**
* >
* > [HeatmapRenderer.radius](https://developers.arcgis.com/javascript/latest/references/core/renderers/HeatmapRenderer/) is limited to `112` pt in 3D [SceneViews](https://developers.arcgis.com/javascript/latest/references/core/views/SceneView/).
*
* @default 18
* @since 4.24
* @example
* // radius in points
* renderer.radius = 14;
* @example
* // radius in pixels
* renderer.radius = "20px";
* @example
* // radius in points
* renderer.radius = "14pt";
*/
radius?: number | string;
}
/**
* The HeatmapRenderer uses [kernel density](https://pro.arcgis.com/en/pro-app/2.8/tool-reference/spatial-analyst/how-kernel-density-works.htm)
* to render point features in
* [FeatureLayers](https://developers.arcgis.com/javascript/latest/references/core/layers/FeatureLayer/),
* [CSVLayers](https://developers.arcgis.com/javascript/latest/references/core/layers/CSVLayer/),
* [GeoJSONLayers](https://developers.arcgis.com/javascript/latest/references/core/layers/GeoJSONLayer/) and
* [OGCFeatureLayers](https://developers.arcgis.com/javascript/latest/references/core/layers/OGCFeatureLayer/) as a raster surface.
*
* To create this visual, the HeatmapRenderer fits a smoothly curved surface over each point. The surface value is highest
* at the location of the point and decreases proportionally to the distance from the point,
* reaching zero at the distance from the point specified in [radius](https://developers.arcgis.com/javascript/latest/references/core/renderers/HeatmapRenderer/#radius). The value of the surface equals
* the [field](https://developers.arcgis.com/javascript/latest/references/core/renderers/HeatmapRenderer/#field) value for the point, or 1 if no field is provided. The density at each pixel
* is calculated by adding the values of all the kernel surfaces where they overlay.
*
* Because there isn't an API for querying density values in a layer view, we suggest you use
* the [heatmapRendererCreator](https://developers.arcgis.com/javascript/latest/references/core/smartMapping/renderers/heatmap/) smart mapping function
* for creating the initial view of a heatmap, and then making renderer adjustments as needed.
*
* Colors are assigned to each pixel based on their density value. The color ramp specified
* by the [colorStops](https://developers.arcgis.com/javascript/latest/references/core/renderers/HeatmapRenderer/#colorStops) property maps colors to the ratio of each pixel's density value to
* the [maxDensity](https://developers.arcgis.com/javascript/latest/references/core/renderers/HeatmapRenderer/#maxDensity). This eases the process for creating your own color stops since you don't
* need to know the range of density values to apply a color ramp to the renderer.
*
* > [!WARNING]
* >
* > **Known Limitations**
* >
* > Labels on layers using HeatmapRenderer are currently not supported in a 3D [SceneView](https://developers.arcgis.com/javascript/latest/references/core/views/SceneView/).
*
* @since 4.8
* @see [Sample - Visualize points with a heatmap](https://developers.arcgis.com/javascript/latest/sample-code/visualization-heatmap/)
* @see [Sample - Create a scale-dependent visualization](https://developers.arcgis.com/javascript/latest/sample-code/visualization-heatmap-scale/)
* @see [Sample - Visualize points in a scene with a heatmap](https://developers.arcgis.com/javascript/latest/sample-code/visualization-heatmap-scene/)
* @see [Sample - Create a static heatmap](https://developers.arcgis.com/javascript/latest/sample-code/visualization-heatmap-static/)
* @see [heatmapRendererCreator](https://developers.arcgis.com/javascript/latest/references/core/smartMapping/renderers/heatmap/)
* @example
* layer.renderer = {
* type: "heatmap",
* field: "crime_count",
* colorStops: [
* { ratio: 0, color: "rgba(255, 255, 255, 0)" },
* { ratio: 0.2, color: "rgba(255, 255, 255, 1)" },
* { ratio: 0.5, color: "rgba(255, 140, 0, 1)" },
* { ratio: 0.8, color: "rgba(255, 140, 0, 1)" },
* { ratio: 1, color: "rgba(255, 0, 0, 1)" }
* ],
* minDensity: 0,
* maxDensity: 500,
* radius: 10
* };
*/
export default class HeatmapRenderer extends Renderer {
constructor(properties?: HeatmapRendererProperties);
/**
* An array of objects describing the renderer's color ramp. The ratio of a pixel's density value to the
* [maxDensity](https://developers.arcgis.com/javascript/latest/references/core/renderers/HeatmapRenderer/#maxDensity) of the renderer is mapped to a corresponding color.
* The color of the first stop (i.e. the stop with the lowest `ratio` value) must
* have an alpha value of `0` for the underlying basemap to be visible in the app.
*
* The default value is the following:
*
* ```js
* [
* { ratio: 0, color: "rgba(255, 140, 0, 0)" },
* { ratio: 0.75, color: "rgba(255, 140, 0, 1)" },
* { ratio: 0.9, color: "rgba(255, 0, 0, 1)" }
* ]
* ```
*/
get colorStops(): HeatmapColorStop[];
set colorStops(value: HeatmapColorStopProperties[]);
/**
* The name of the attribute field used to weight the density of each heatmap point.
*
* For example, suppose you have a layer of points representing buildings containing a
* field `num_units` for the number of units in the building (if it's an apartment complex). You could
* weight the heatmap renderer based on the `num_units` field to create a heatmap representing
* the density of housing units in a city.
*
* @example renderer.field = "num_units";
*/
accessor field: string;
/**
* An object providing options for describing the renderer in the [Legend](https://developers.arcgis.com/javascript/latest/references/map-components/components/arcgis-legend/).
*
* @since 4.24
* @example
* renderer.legendOptions = {
* title: "Car crashes",
* minLabel: "Few crashes",
* maxLabel: "Frequent crashes"
* };
*/
get legendOptions(): HeatmapLegendOptions | null | undefined;
set legendOptions(value: HeatmapLegendOptionsProperties | null | undefined);
/**
* The max density value to be assigned a color in the heatmap surface.
* Both [minDensity](https://developers.arcgis.com/javascript/latest/references/core/renderers/HeatmapRenderer/#minDensity) and `maxDensity` determine how [colorStops](https://developers.arcgis.com/javascript/latest/references/core/renderers/HeatmapRenderer/#colorStops) are applied to the heatmap surface.
* Pixels with density values above this number will be assigned the final (or hottest) color in the color ramp.
*
* Typically, `minDensity` will be zero and `maxDensity` will be set
* to a higher value appropriate for the dataset. The default may not be ideal for your dataset,
* so this value will likely need to change.
*
* Determining the best values for `minDensity` and `maxDensity` is an exercise left up to the developer
* since different types, scales, densities, and distributions of data will require different values for these properties
* to create a visually pleasing separation of high and low density areas appropriate for the data and the application.
*
* Because there isn't an API for querying density values in a layer view, we suggest you use
* the [heatmapRendererCreator](https://developers.arcgis.com/javascript/latest/references/core/smartMapping/renderers/heatmap/) smart mapping function
* for creating the initial view of a heatmap, and then making adjustments as needed.
*
* @default 0.04
* @since 4.24
* @example renderer.maxDensity = 100;
*/
accessor maxDensity: number;
/**
* The minimum density value to be assigned a color in the heatmap surface.
* Both `minDensity` and [maxDensity](https://developers.arcgis.com/javascript/latest/references/core/renderers/HeatmapRenderer/#maxDensity) determine how [colorStops](https://developers.arcgis.com/javascript/latest/references/core/renderers/HeatmapRenderer/#colorStops) are applied to the heatmap surface.
* Pixels with density values below the `minDensity` will be excluded from the visualization.
*
* When using a [field](https://developers.arcgis.com/javascript/latest/references/core/renderers/HeatmapRenderer/#field) to weight the heatmap, setting `minDensity` above zero might help to visually deemphasize
* frequently occurring but low value areas. This property does not actually filter the data or
* modify the calculated density value. Rather, it scales the color ramp such that a higher
* density value is required for a pixel to get a noticeable color.
*
* Determining the best values for `minDensity` and `maxDensity` is an exercise left up to the developer
* since different types, scales, densities, and distributions of data will require different values for these properties
* to create a visually pleasing separation of high and low density areas appropriate for the data and the application.
*
* Because there isn't an API for querying density values in a layer view, we suggest you use
* the [heatmapRendererCreator](https://developers.arcgis.com/javascript/latest/references/core/smartMapping/renderers/heatmap/) smart mapping function
* for creating the initial view of a heatmap, and then making adjustments as needed.
*
* @default 0
* @since 4.24
* @example renderer.minDensity = 10;
*/
accessor minDensity: number;
/**
* The search radius (in points) used to create a smooth kernel surface fitted around each point.
* The density value is highest at the location of the point and decreases as the distance away
* from the point increases. The density value is `0` at the distance specified in `radius`
* from the point.
*
* > [!WARNING]
* >
* > **Known Limitations**
* >
* > [HeatmapRenderer.radius](https://developers.arcgis.com/javascript/latest/references/core/renderers/HeatmapRenderer/) is limited to `112` pt in 3D [SceneViews](https://developers.arcgis.com/javascript/latest/references/core/views/SceneView/).
*
* @default 18
* @since 4.24
* @example
* // radius in points
* renderer.radius = 14;
* @example
* // radius in pixels
* renderer.radius = "20px";
* @example
* // radius in points
* renderer.radius = "14pt";
*/
get radius(): number;
set radius(value: number | string);
/**
* When set, the heatmap's visualization at the given scale will remain static and not
* change as the user zooms in and out of the view. This fixes each point's
* influence radius to a real-world range that doesn't change depending on the zoom level). The
* pixels of `radius` are defined at the reference scale.
*
* A value of 0 means that the heatmap does not have a `referenceScale`.
*
* The following images demonstrate how setting a reference scale will preserve a heatmap across various
* scales as opposed to dynamically updating on zoom.
*
* Zoom offset from reference scale | Static (reference scale) | Dynamic (no reference scale)
* ------------------------------|----------|--------------
* +1 LOD | 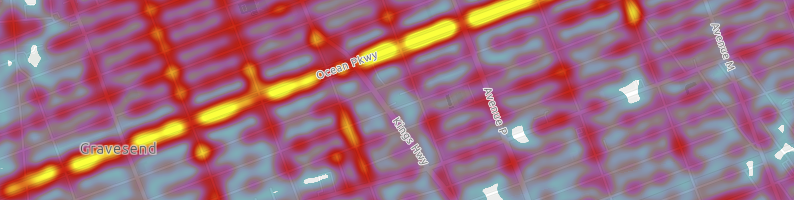 | 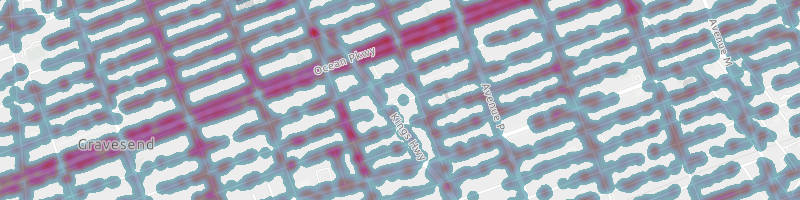
* reference scale | 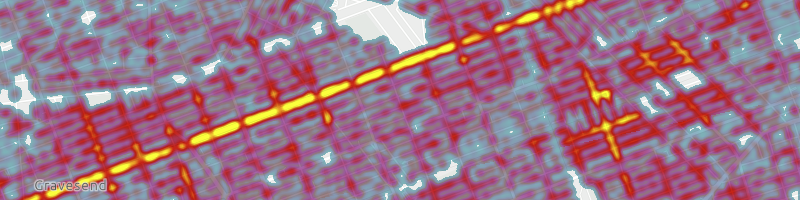 | 
* -1 LOD | 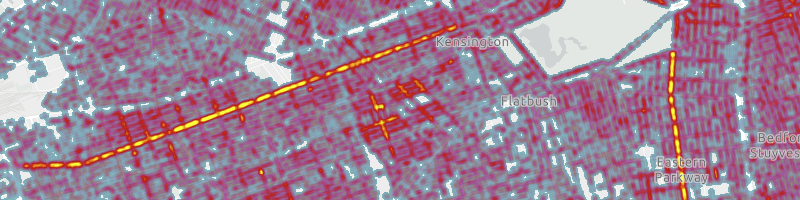 | 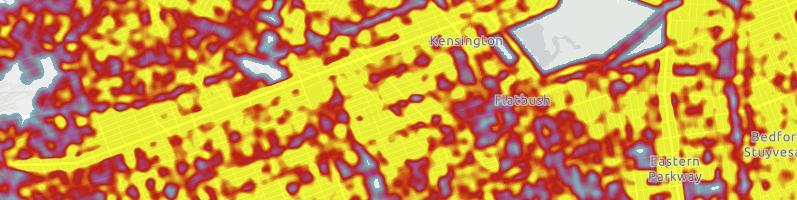
*
* @default 0
* @since 4.24
* @see [Sample - Create a static heatmap](https://developers.arcgis.com/javascript/latest/sample-code/visualization-heatmap-static/)
* @example
* // locks the heatmap surface at the current view scale
* // so that it doesn't change as the user zooms in and out
* renderer.referenceScale = view.scale;
*/
accessor referenceScale: number;
/** The type of renderer. */
get type(): "heatmap";
/**
* An [Arcade](https://developers.arcgis.com/javascript/latest/arcade/) expression following the specification
* defined by the [Arcade Visualization Profile](https://developers.arcgis.com/javascript/latest/arcade/#visualization). Expressions
* in HeatmapRenderer may reference field values using the `$feature` profile variable and must return a number.
*
* The values returned from this expression are used to weight the density of each heatmap point.
*
* This property is typically used as an alternative to [field](https://developers.arcgis.com/javascript/latest/references/core/renderers/HeatmapRenderer/#field) for
* data-driven visualizations.
*
* > [!WARNING]
* >
* > **Known Limitations**
* >
* > - Only valid in 2D [MapView](https://developers.arcgis.com/javascript/latest/references/core/views/MapView/).
* > - This property is not honored when persisting a HeatmapRenderer as part of
* > [WebMap.save()](https://developers.arcgis.com/javascript/latest/references/core/WebMap/#save) or
* > [WebScene.save()](https://developers.arcgis.com/javascript/latest/references/core/WebScene/#save).
*
* @since 4.25
* @see [Arcade Visualization Profile](https://developers.arcgis.com/javascript/latest/arcade/#visualization)
* @see [valueExpressionTitle](https://developers.arcgis.com/javascript/latest/references/core/renderers/HeatmapRenderer/#valueExpressionTitle)
* @example
* // expression calculating voter turnout based on two field values
* let renderer = {
* type: "heatmap", // autocasts as new HeatmapRenderer()
* valueExpression: "( $feature.TOT_VOTES / $feature.REG_VOTERS ) * 100",
* };
*/
accessor valueExpression: string | null | undefined;
/**
* The title identifying and describing the [Arcade](https://developers.arcgis.com/javascript/latest/arcade/)
* expression as defined in the [valueExpression](https://developers.arcgis.com/javascript/latest/references/core/renderers/HeatmapRenderer/#valueExpression) property. This is displayed
* as the title of the renderer in the [Legend](https://developers.arcgis.com/javascript/latest/references/map-components/components/arcgis-legend/)
* in the absence of a `title` in the [legendOptions](https://developers.arcgis.com/javascript/latest/references/core/renderers/HeatmapRenderer/#legendOptions) property.
*
* > [!WARNING]
* >
* > **Known Limitations**
* >
* > - Only valid in 2D [MapView](https://developers.arcgis.com/javascript/latest/references/core/views/MapView/).
* > - This property is not honored when persisting a HeatmapRenderer as part of
* > [WebMap.save()](https://developers.arcgis.com/javascript/latest/references/core/WebMap/#save) or
* > [WebScene.save()](https://developers.arcgis.com/javascript/latest/references/core/WebScene/#save).
*
* @since 4.25
* @see [valueExpression](https://developers.arcgis.com/javascript/latest/references/core/renderers/HeatmapRenderer/#valueExpression)
* @example
* renderer.valueExpression = "($feature.POP / $feature.SQ_MI) * 100";
* renderer.valueExpressionTitle = "Population per square mile";
*/
accessor valueExpressionTitle: string | null | undefined;
/**
* Creates a deep clone of the renderer.
*
* @returns A deep clone of the object that
* invoked this method.
* @example
* // Creates a deep clone of the first layer's renderer
* let renderer = view.map.layers.at(0).renderer.clone();
*/
clone(): HeatmapRenderer;
}