@arcgis/core
Version:
ArcGIS Maps SDK for JavaScript: A complete 2D and 3D mapping and data visualization API
358 lines (356 loc) • 20.5 kB
TypeScript
import type Color from "../Color.js";
import type AuthoringInfo from "./support/AuthoringInfo.js";
import type RendererLegendOptions from "./support/RendererLegendOptions.js";
import type { JSONSupport } from "../core/JSONSupport.js";
import type { VisualVariable } from "./types.js";
import type { VisualVariablesMixin, VisualVariablesMixinProperties } from "./mixins/VisualVariablesMixin.js";
import type { ColorVariableProperties } from "./visualVariables/ColorVariable.js";
import type { OpacityVariableProperties } from "./visualVariables/OpacityVariable.js";
import type { RotationVariableProperties } from "./visualVariables/RotationVariable.js";
import type { SizeVariableProperties } from "./visualVariables/SizeVariable.js";
import type { ColorLike } from "../Color.js";
import type { AuthoringInfoProperties } from "./support/AuthoringInfo.js";
import type { RendererLegendOptionsProperties } from "./support/RendererLegendOptions.js";
export interface FlowRendererProperties extends VisualVariablesMixinProperties, Partial<Pick<FlowRenderer, "density" | "flowRepresentation" | "flowSpeed" | "trailCap" | "trailLength">> {
/**
* Contains metadata about renderers generated from the
* [flowRendererCreator.createRenderer()](https://developers.arcgis.com/javascript/latest/references/core/smartMapping/raster/renderers/flow/#createRenderer) method,
* including information for setting UI elements such as sliders and themes. This allows the authoring clients to save specific overridable settings
* so user selections can be remembered the next time they are accessed via the UI.
*
* @since 4.23
*/
authoringInfo?: AuthoringInfoProperties;
/**
* The color of the animated streamlines.
*
* @default [255, 255, 255, 1]
*/
color?: ColorLike;
/**
* An object providing options for displaying the renderer in the Legend.
*
* @since 4.23
* @example
* renderer.legendOptions = {
* title: "Wind speed",
* order: "descending-values",
* };
*/
legendOptions?: RendererLegendOptionsProperties | null;
/**
* The maximum path length of the streamlines on which the trail travels in number of points.
* The trail is the visible and animated portion that travels along the streamline.
* The actual length of the trail depends on the magnitude coming from the raster layer and the defined [trailLength](https://developers.arcgis.com/javascript/latest/references/core/renderers/FlowRenderer/#trailLength).
* During the course of the animation, the trail will travel to reach the path length defined here, then
* will restart. This value may be autocast with a string expressing size in points or pixels (e.g. `100px`).
*
* @default 200
* @example
* // width in points
* flowRenderer.maxPathLength = 100;
* @example
* // width in pixels
* flowRenderer.maxPathLength = "200px";
* @example
* // width in points
* flowRenderer.maxPathLength = "100pt";
* @see [Streamline animation](https://developers.arcgis.com/javascript/latest/references/core/renderers/FlowRenderer/#streamline-animation)
*/
maxPathLength?: number | string;
/**
* The width of the streamline trail in points. This value may be autocast with a string
* expressing size in points or pixels (e.g. `3px`).
*
* @default 1.5
* @example
* // width in points
* flowRenderer.trailWidth = 4;
* @example
* // width in pixels
* flowRenderer.trailWidth = "2px";
* @example
* // width in points
* flowRenderer.trailWidth = "4pt";
*/
trailWidth?: number | string;
/**
* An array of [VisualVariable](https://developers.arcgis.com/javascript/latest/references/core/renderers/visualVariables/VisualVariable/) objects.
* Each object must indicate
* the type of visual variable to apply (e.g. [ColorVisualVariable](https://developers.arcgis.com/javascript/latest/references/core/renderers/visualVariables/ColorVariable/)), the numeric
* field from which to drive the visualization, and the visual values to map to the data.
* The following list identifies each visual variable type that is supported with the `FlowRenderer` and provides a link to the specification table
* of each: [ColorVisualVariable](https://developers.arcgis.com/javascript/latest/references/core/renderers/visualVariables/ColorVariable/),
* [OpacityVisualVariable](https://developers.arcgis.com/javascript/latest/references/core/renderers/visualVariables/OpacityVariable/), and [SizeVisualVariable](https://developers.arcgis.com/javascript/latest/references/core/renderers/visualVariables/SizeVariable/).
* `SizeVisualVariable` will update the [trailWidth](https://developers.arcgis.com/javascript/latest/references/core/renderers/FlowRenderer/#trailWidth) property.
*
* When setting fields for the visual variables set on the FlowRenderer, use the `Magnitude` field. `Magnitude` will return pixel values from the
* first band. If the data represents u (zonal) and v (meridional) speed components, values are automatically converted
* to `Magnitude` and `Direction`.
*
* > [!WARNING]
* > The RotationVariable is not supported on the FlowRenderer since the direction of the flow is already encoded in the underlying data.
*
* @example
* const renderer = new FlowRenderer({
* visualVariables: [{
* type: "color",
* field: "Magnitude",
* stops: [
* { value: 3, color: "#0080ff" },
* { value: 15, color: "#00ff00" }
* ]
* }, {
* type: "opacity",
* field: "Magnitude",
* stops: [
* { value: 1, opacity: 0.5 },
* { value: 8, opacity: 1 }
* ]
* }]
* });
* @see [Styles and data visualization](https://developers.arcgis.com/javascript/latest/visualization/)
*/
visualVariables?: ((ColorVariableProperties & { type: "color"; }) | (SizeVariableProperties & { type: "size"; }) | (OpacityVariableProperties & { type: "opacity"; }) | (RotationVariableProperties & { type: "rotation"; }))[] | null;
}
/**
* The FlowRenderer allows you to visualize your raster data with animated streamlines.
* This renderer can be used to visualize flow direction and magnitude information for meteorology and oceanography raster data.
*
* To use this renderer, the [source type of your raster dataset](https://pro.arcgis.com/en/pro-app/latest/help/data/imagery/raster-dataset-properties.htm) must be `Vector-UV` or `Vector-MagDir`.
* The direction of the raster defines the direction of movement, and the magnitude defines the visible length of the streamline.
*
* [](https://developers.arcgis.com/javascript/latest/sample-code/layers-imagery-afrenderer/)
*
* <span id="streamline-animation"></span>
* ## Streamline animation
*
* The final visuals are influenced by several key properties that control the behavior of the animated streamlines.
* In particular, the speed and length of the flow are defined by a combination of the properties [flowSpeed](https://developers.arcgis.com/javascript/latest/references/core/renderers/FlowRenderer/#flowSpeed), [trailLength](https://developers.arcgis.com/javascript/latest/references/core/renderers/FlowRenderer/#trailLength), and [maxPathLength](https://developers.arcgis.com/javascript/latest/references/core/renderers/FlowRenderer/#maxPathLength).
*
* The FlowRenderer displays animated streamlines by moving a visible trail (in red) along a precomputed path, or streamline (in black).
* This path represents the full route of flow and is based on the direction of the underlying data.
*
* 
*
* The trail's length and speed are initially influenced by the magnitude of the source data. To give users more control, the following properties can be adjusted:
*
* - The [flowSpeed](https://developers.arcgis.com/javascript/latest/references/core/renderers/FlowRenderer/#flowSpeed) scales the trail's speed without changing its length.
* - The [trailLength](https://developers.arcgis.com/javascript/latest/references/core/renderers/FlowRenderer/#trailLength) controls how much of the path is visibly lit up at any moment, with higher values producing longer trails.
* - The [maxPathLength](https://developers.arcgis.com/javascript/latest/references/core/renderers/FlowRenderer/#maxPathLength) defines how far along the path the trail can travel before looping back, affecting the total journey but not the visible trail length.
*
* When the source data has very low magnitudes, the animation may appear slow and the trail short (almost static).
* Increasing both the [flowSpeed](https://developers.arcgis.com/javascript/latest/references/core/renderers/FlowRenderer/#flowSpeed) and [trailLength](https://developers.arcgis.com/javascript/latest/references/core/renderers/FlowRenderer/#trailLength) can enhance visibility and motion.
* For example, flood simulations with magnitudes less than 5 m/s typically require [trailLength](https://developers.arcgis.com/javascript/latest/references/core/renderers/FlowRenderer/#trailLength) values of around 1500 to produce better visuals.
*
* > [!WARNING]
* >
* > **Known Limitations**
* >
* > The FlowRenderer is only supported with [ImageryTileLayer](https://developers.arcgis.com/javascript/latest/references/core/layers/ImageryTileLayer/) and [ImageryLayer](https://developers.arcgis.com/javascript/latest/references/core/layers/ImageryLayer/).
*
* @since 4.23
* @see [Sample - FlowRenderer](https://developers.arcgis.com/javascript/latest/sample-code/layers-imagery-afrenderer/)
* @see [Sample - FlowRenderer with Blending and Effects](https://developers.arcgis.com/javascript/latest/sample-code/layers-imagery-afrenderer-blending/)
* @see [Sample - FlowRenderer in a 3D scene](https://developers.arcgis.com/javascript/latest/sample-code/layers-imagerytilelayer-flow-3d-global/)
* @see [Sample - FlowRenderer with elevation modes](https://developers.arcgis.com/javascript/latest/sample-code/layers-imagerytilelayer-flow-3d-local/)
* @example
* const renderer = new FlowRenderer({
* density: 1,
* color: [50, 120, 240], // blue
* flowSpeed: 10,
* trailWidth: "2px"
* });
*/
export default class FlowRenderer extends FlowRendererSuperclass {
/**
* @example
* let renderer = {
* type: "flow",
* color: [50, 120, 240, 1]
* }
*/
constructor(properties?: FlowRendererProperties);
/**
* Contains metadata about renderers generated from the
* [flowRendererCreator.createRenderer()](https://developers.arcgis.com/javascript/latest/references/core/smartMapping/raster/renderers/flow/#createRenderer) method,
* including information for setting UI elements such as sliders and themes. This allows the authoring clients to save specific overridable settings
* so user selections can be remembered the next time they are accessed via the UI.
*
* @since 4.23
*/
get authoringInfo(): AuthoringInfo;
set authoringInfo(value: AuthoringInfoProperties);
/**
* The color of the animated streamlines.
*
* @default [255, 255, 255, 1]
*/
get color(): Color;
set color(value: ColorLike);
/**
* The density of the streamlines. This value determines how many streamlines appear in the visualization:
* * A value less than or equal to 0 means no streamlines will be rendered.
* * Values between 0 and 1 reduce the number of streamlines.
* * Values greater than 1 increase the number of streamlines proportionally.
*
* > [!WARNING]
* >
* > **Notes**
* >
* > While density can exceed 1, the effective maximum number of streamlines is constrained by factors such as screen size and [trailLength](https://developers.arcgis.com/javascript/latest/references/core/renderers/FlowRenderer/#trailLength) property. At high densities, new streamlines may be discarded to avoid cluttered visualizations and excessive computation time.
*
* |`density = 0.1` | `density = 1` | `density = 1.5` |
* |----------------|-----------------|---------------|
* | 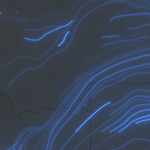 |  |  |
*
* @default 0.8
*/
accessor density: number;
/**
* Defines the flow direction of the data. This can be modified to display meteorological (the direction it is flowing from) or climatological data (the direction it is flowing to).
*
* Value | Description | Example
* ------|-------------|---------
* flow-from | Flow from angle. | 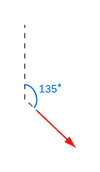
* flow-to | Flow to angle. | 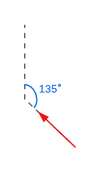
*
* @default "flow-from"
*/
accessor flowRepresentation: "flow-from" | "flow-to";
/**
* The speed of the animated trails that travel along the streamlines, relative to the simulation time.
* This property does not change the length of the trails or streamlines, only the speed at which the trail is animated.
* The final speed is initially based on the magnitude from the underlying data and is then further scaled by this property.
* A speed of 0 will result in no animation.
*
* @default 10
* @see [Streamline animation](https://developers.arcgis.com/javascript/latest/references/core/renderers/FlowRenderer/#streamline-animation)
*/
accessor flowSpeed: number;
/**
* An object providing options for displaying the renderer in the Legend.
*
* @since 4.23
* @example
* renderer.legendOptions = {
* title: "Wind speed",
* order: "descending-values",
* };
*/
get legendOptions(): RendererLegendOptions | null | undefined;
set legendOptions(value: RendererLegendOptionsProperties | null | undefined);
/**
* The maximum path length of the streamlines on which the trail travels in number of points.
* The trail is the visible and animated portion that travels along the streamline.
* The actual length of the trail depends on the magnitude coming from the raster layer and the defined [trailLength](https://developers.arcgis.com/javascript/latest/references/core/renderers/FlowRenderer/#trailLength).
* During the course of the animation, the trail will travel to reach the path length defined here, then
* will restart. This value may be autocast with a string expressing size in points or pixels (e.g. `100px`).
*
* @default 200
* @example
* // width in points
* flowRenderer.maxPathLength = 100;
* @example
* // width in pixels
* flowRenderer.maxPathLength = "200px";
* @example
* // width in points
* flowRenderer.maxPathLength = "100pt";
* @see [Streamline animation](https://developers.arcgis.com/javascript/latest/references/core/renderers/FlowRenderer/#streamline-animation)
*/
get maxPathLength(): number;
set maxPathLength(value: number | string);
/**
* The front cap of the streamline. A round cap will only be applied if [trailWidth](https://developers.arcgis.com/javascript/latest/references/core/renderers/FlowRenderer/#trailWidth) is greater than `4px` or `3pt`.
*
* > [!WARNING]
* >
* > **Known Limitations**
* >
* > The `round` trail cap is not supported in 3D [SceneView](https://developers.arcgis.com/javascript/latest/references/core/views/SceneView/).
*
* @default "butt"
* @since 4.24
*/
accessor trailCap: "butt" | "round";
/**
* The approximate visible length of the trail that travels along the streamline.
* The streamlines maintain their total [length](https://developers.arcgis.com/javascript/latest/references/core/renderers/FlowRenderer/#maxPathLength), only the visible trail is changed.
* The actual trail length is first based on the data, then further scaled by this property.
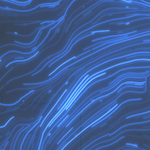
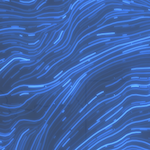
* |`trailLength = 20` | `trailLength = 100` | `trailLength = 250` |
* |----------------|-----------------|---------------|
* |  |  |  |
*
* @default 100
* @see [Streamline animation](https://developers.arcgis.com/javascript/latest/references/core/renderers/FlowRenderer/#streamline-animation)
*/
accessor trailLength: number;
/**
* The width of the streamline trail in points. This value may be autocast with a string
* expressing size in points or pixels (e.g. `3px`).
*
* @default 1.5
* @example
* // width in points
* flowRenderer.trailWidth = 4;
* @example
* // width in pixels
* flowRenderer.trailWidth = "2px";
* @example
* // width in points
* flowRenderer.trailWidth = "4pt";
*/
get trailWidth(): number;
set trailWidth(value: number | string);
/** The type of Renderer. */
get type(): "flow";
/**
* An array of [VisualVariable](https://developers.arcgis.com/javascript/latest/references/core/renderers/visualVariables/VisualVariable/) objects.
* Each object must indicate
* the type of visual variable to apply (e.g. [ColorVisualVariable](https://developers.arcgis.com/javascript/latest/references/core/renderers/visualVariables/ColorVariable/)), the numeric
* field from which to drive the visualization, and the visual values to map to the data.
* The following list identifies each visual variable type that is supported with the `FlowRenderer` and provides a link to the specification table
* of each: [ColorVisualVariable](https://developers.arcgis.com/javascript/latest/references/core/renderers/visualVariables/ColorVariable/),
* [OpacityVisualVariable](https://developers.arcgis.com/javascript/latest/references/core/renderers/visualVariables/OpacityVariable/), and [SizeVisualVariable](https://developers.arcgis.com/javascript/latest/references/core/renderers/visualVariables/SizeVariable/).
* `SizeVisualVariable` will update the [trailWidth](https://developers.arcgis.com/javascript/latest/references/core/renderers/FlowRenderer/#trailWidth) property.
*
* When setting fields for the visual variables set on the FlowRenderer, use the `Magnitude` field. `Magnitude` will return pixel values from the
* first band. If the data represents u (zonal) and v (meridional) speed components, values are automatically converted
* to `Magnitude` and `Direction`.
*
* > [!WARNING]
* > The RotationVariable is not supported on the FlowRenderer since the direction of the flow is already encoded in the underlying data.
*
* @example
* const renderer = new FlowRenderer({
* visualVariables: [{
* type: "color",
* field: "Magnitude",
* stops: [
* { value: 3, color: "#0080ff" },
* { value: 15, color: "#00ff00" }
* ]
* }, {
* type: "opacity",
* field: "Magnitude",
* stops: [
* { value: 1, opacity: 0.5 },
* { value: 8, opacity: 1 }
* ]
* }]
* });
* @see [Styles and data visualization](https://developers.arcgis.com/javascript/latest/visualization/)
*/
get visualVariables(): VisualVariable[] | null | undefined;
set visualVariables(value: ((ColorVariableProperties & { type: "color"; }) | (SizeVariableProperties & { type: "size"; }) | (OpacityVariableProperties & { type: "opacity"; }) | (RotationVariableProperties & { type: "rotation"; }))[] | null | undefined);
/**
* Creates a deep clone of the renderer.
*
* @example
* // Creates a deep clone of the first layer's renderer
* let renderer = view.map.layers.at(0).renderer.clone();
*/
clone(): FlowRenderer;
}
declare const FlowRendererSuperclass: typeof JSONSupport & typeof VisualVariablesMixin