@arcgis/core
Version:
ArcGIS Maps SDK for JavaScript: A complete 2D and 3D mapping and data visualization API
423 lines (421 loc) • 22.3 kB
TypeScript
import type Color from "../Color.js";
import type Renderer from "./Renderer.js";
import type AttributeColorInfo from "./support/AttributeColorInfo.js";
import type DotDensityLegendOptions from "./support/DotDensityLegendOptions.js";
import type SizeVariable from "./visualVariables/SizeVariable.js";
import type SimpleLineSymbol from "../symbols/SimpleLineSymbol.js";
import type { VisualVariablesMixin, VisualVariablesMixinProperties } from "./mixins/VisualVariablesMixin.js";
import type { SizeVariableProperties } from "./visualVariables/SizeVariable.js";
import type { AttributeColorInfoProperties } from "./support/AttributeColorInfo.js";
import type { ColorLike } from "../Color.js";
import type { DotDensityLegendOptionsProperties } from "./support/DotDensityLegendOptions.js";
import type { SimpleLineSymbolProperties } from "../symbols/SimpleLineSymbol.js";
import type { RendererProperties } from "./Renderer.js";
export interface DotDensityRendererProperties extends RendererProperties, VisualVariablesMixinProperties, Partial<Pick<DotDensityRenderer, "dotBlendingEnabled" | "dotSize" | "dotValue" | "referenceScale" | "seed">> {
/**
* Defines the variable(s) used to visualize density. This is an array of objects, each of which references
* a numeric field value or [Arcade](https://developers.arcgis.com/javascript/latest/arcade/) expression used to drive the density. You
* must also set a color corresponding to each value.
*
* If you set a single attribute, `POPULATION` and match it with a color `black` and the [dotValue](https://developers.arcgis.com/javascript/latest/references/core/renderers/DotDensityRenderer/#dotValue)
* is `100`, then number of black dots rendered for each feature will approximately equal the value of
* `POPULATION` divided by `100`.
*
* This property is limited to no more than 8 attributes.
*
* @see [Arcade Visualization Profile](https://developers.arcgis.com/javascript/latest/arcade/#visualization)
* @example
* renderer.attributes = [{
* field: "POPULATION",
* label: "Population (2019)",
* color: "gray"
* }];
*/
attributes?: AttributeColorInfoProperties[];
/**
* The color used to shade the polygon fill behind the dots. This can be autocast with a named string; hex string;
* array of rgb or rgba values; an
* object with `r`, `g`, `b`, and `a` properties; or a [Color](https://developers.arcgis.com/javascript/latest/references/core/Color/) object.
*
* @default [0, 0, 0, 0.25] - black, semitransparent
* @example
* // CSS color string
* renderer.backgroundColor = "dodgerblue";
* @example
* // HEX string
* renderer.backgroundColor = "#33cc33";
* @example
* // array of RGBA values
* renderer.backgroundColor = [51, 204, 51, 0.3];
* @example
* // object with rgba properties
* renderer.backgroundColor = {
* r: 51,
* g: 51,
* b: 204,
* a: 0.7
* };
*/
backgroundColor?: ColorLike;
/**
* An object providing options for configuring the renderer in the [Legend](https://developers.arcgis.com/javascript/latest/references/map-components/components/arcgis-legend/).
*
* @example
* // Legend will display: "1 dot = 50 cows"
* renderer.dotValue = 50;
* renderer.legendOptions = {
* unit: "cows"
* };
*/
legendOptions?: DotDensityLegendOptionsProperties | null;
/**
* The outline of the polygon. When not set, this renders using the default
* [SimpleLineSymbol](https://developers.arcgis.com/javascript/latest/references/core/symbols/SimpleLineSymbol/). It is good practice to explicitly set this
* for every DotDensityRenderer. Either remove the outline altogether, or set it to a
* very thin, transparent style so it doesn't distract from the dot density.
*
* @example
* // removes the default outline from the renderer
* renderer.outline = null;
* @example
* // sets a thin, transparent outline to the renderer
* renderer.outline = {
* color: [ 128,128,128, 0.2 ],
* width: 0.5
* };
* @example
* // disable the default outline
* renderer.outline = null;
*/
outline?: SimpleLineSymbolProperties;
/**
* An array of [Size Visual Variable](https://developers.arcgis.com/javascript/latest/references/core/renderers/visualVariables/SizeVariable/) objects. Only one
* should be provided. This visual variable is used to vary the [outline](#outline) width based on the [view.scale](https://developers.arcgis.com/javascript/latest/references/core/views/MapView/#scale).
* See the snippet below for an example of this.
*
* @example
* renderer.visualVariables = [{
* type: "size",
* target: "outline",
* valueExpression: "$view.scale",
* stops: [
* { size: 1.5, value: 1881217},
* { size: 0.75, value: 5878804},
* { size: 0.375, value: 23515218},
* { size: 0, value: 47030436},
* ]
* }];
* @see [Styles and data visualization](https://developers.arcgis.com/javascript/latest/visualization/)
*/
visualVariables?: (SizeVariableProperties & { type: "size"; })[] | null;
}
/**
* DotDensityRenderer allows you to create dot density visualizations for polygon layers. Dot density
* visualizations randomly draw dots within each polygon to visualize the density of a population or some
* other variable. Each dot represents an approximate numeric value
* of an [attribute](https://developers.arcgis.com/javascript/latest/references/core/renderers/DotDensityRenderer/#attributes) or a subset of attributes.
* Unlike choropleth maps, field values used in dot density visualizations don't need to be normalized
* because the size of the polygon, together with the number of dots rendered within its boundaries, indicate the
* spatial density of that value. In essence, the empty space between the dots acts as a form of data normalization.
*
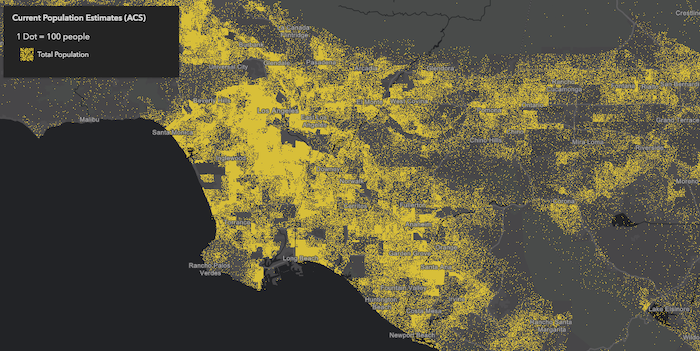
* The image below visualizes population by Census tract using dot density. Notice that each
* dot represents about 100 people.
*
* 
*
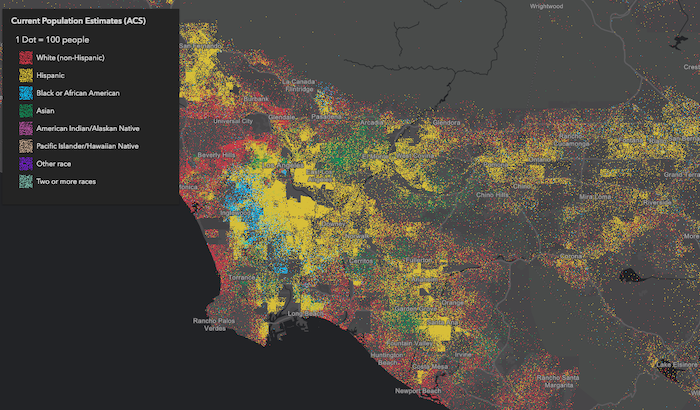
* You can specify multiple [attributes](https://developers.arcgis.com/javascript/latest/references/core/renderers/DotDensityRenderer/#attributes) to visualize subcategories of the data.
* For example, we can visualize the same layer above, but categorize each dot by race/ethnicity. So each
* dot of a different color represents 100 people of the respective category (e.g. 1 red dot represents
* 100 white non-Hispanic) people, each blue dot = 100 African American people, each yellow dot = 100 Hispanic people, etc).
*
* [](https://developers.arcgis.com/javascript/latest/sample-code/visualization-dot-density/)
*
* This implementation of dot density allows you to linearly scale the dot value based on the [view scale](https://developers.arcgis.com/javascript/latest/references/core/views/MapView/#scale).
* So as you zoom in and out of the initial view, the relative density of points remains the same across scales.
*
* > [!WARNING]
* >
* > **Usage guidelines**
* >
* > Keep in mind the following suggestions while creating dot density visualizations:
* >
* > - You should use Equal Area [spatial references](https://developers.arcgis.com/javascript/latest/references/core/geometry/SpatialReference/) whenever possible, particularly
* > when building dot density visualizations that span global extents. Using heavily distorted spatial references
* > with a DotDensityRenderer is OK as long as you restrict the user from comparing the densities
* > of features within the same view at large scales. We strongly discourage comparing features across multiple views when
* > equal area projections cannot be used since significant
* > differences in area distortion may cause the user to misinterpret feature density in heavily distorted areas.
* > - You should typically set a [FeatureLayer.minScale](https://developers.arcgis.com/javascript/latest/references/core/layers/FeatureLayer/#minScale)
* > on the layer. Dot density visualizations are difficult
* > to read when dots are no longer distinguishable either because they coalesce, or because they are too dispersed.
* > - Setting a [FeatureLayer.maxScale](https://developers.arcgis.com/javascript/latest/references/core/layers/FeatureLayer/#maxScale) on the layer is also important because dot density maps tend to become unreadable at larger scales.
* > Users may start seeing patterns in the random distribution of dots that do not exist in reality. They may
* > also mistakenly interpret the location of each dot as an actual point feature. Users are particularly susceptible to this when
* > the [dotValue](https://developers.arcgis.com/javascript/latest/references/core/renderers/DotDensityRenderer/#dotValue) is set to `1`. As an example,
* > dot density visualizations on county datasets should only be viewed at the state or regional level.
* > - Use the [attributes](https://developers.arcgis.com/javascript/latest/references/core/renderers/DotDensityRenderer/#attributes) property to specify one or more data values. When multiple attributes are
* > specified, the group of attributes should make sense when visualized together, and generally should belong to a parent group. For example,
* > you could map the density of pets, or the density of different kinds of pets such as dogs, cats, etc.
* > - The dot count inside a polygon is created using a stochastic dot density fast approximation,
* > and doesn't necessarily represent an exact count or population. Therefore, dot density should not be used to infer the
* > locations of actual populations, nor should map authors
* > expect users to count the number of dots to learn the exact value of a feature, even if the `dotValue` is set to `1`.
* > The popup or label should be used to communicate exact values to support the spatial pattern established by the visualization. Dot density
* > visualizations work best at communicating patterns and relative densities of populations that inherently have a margin of error
* > (such as U.S. Census data), and don't necessarily represent a precise or exact count.
* > - Use popups to clearly communicate the actual value of the feature, so the user can explore the map visually and interactively.
*
* > [!CAUTION]
* >
* > **Known Limitations**
* >
* > This renderer may only be applied to layers with a `geometryType` of `polygon`.
* > This renderer is currently only supported in 2D [MapViews](https://developers.arcgis.com/javascript/latest/references/core/views/MapView/).
*
* @since 4.11
* @see [Sample - Dot Density](https://developers.arcgis.com/javascript/latest/sample-code/visualization-dot-density/)
* @see [Guide - Esri color ramps](https://developers.arcgis.com/javascript/latest/esri-color-ramps/)
* @see [Guide - Visualization best practices](https://developers.arcgis.com/javascript/latest/visualization-best-practices/)
* @example
* layer.renderer = {
* type: "dot-density", // autocasts as new DotDensityRenderer()
* dotValue: 1000, // 1 dot = 1,000 people when the view.scale is 1:1,000,000
* referenceScale: 1000000, // view.scale
* attributes: [{
* field: "ELEMENTARY_SCHOOL",
* label: "Elementary School",
* color: "red"
* }, {
* field: "MIDDLE_SCHOOL",
* label: "Middle School",
* color: "blue"
* }, {
* field: "HIGH_SCHOOL",
* label: "High School",
* color: "orange"
* }, {
* valueExpression: "$feature.ASSOCIATES_DEGREE + $feature.BACHELOR_DEGREE + $feature.MASTER_DEGREE + $feature.DOCTORATE_DEGREE",
* valueExpressionTitle: "People who completed university",
* label: "University"
* color: "green"
* }]
* }
*/
export default class DotDensityRenderer extends DotDensityRendererSuperclass {
/**
* @example
* // Typical usage
* let renderer = {
* type: "dot-density", // autocasts as new DotDensityRenderer()
* dotValue: 1000,
* legendOptions: {
* unit: "people"
* },
* attributes: [{
* field: "Population",
* color: "yellow"
* }]
* };
*/
constructor(properties?: DotDensityRendererProperties);
/**
* Defines the variable(s) used to visualize density. This is an array of objects, each of which references
* a numeric field value or [Arcade](https://developers.arcgis.com/javascript/latest/arcade/) expression used to drive the density. You
* must also set a color corresponding to each value.
*
* If you set a single attribute, `POPULATION` and match it with a color `black` and the [dotValue](https://developers.arcgis.com/javascript/latest/references/core/renderers/DotDensityRenderer/#dotValue)
* is `100`, then number of black dots rendered for each feature will approximately equal the value of
* `POPULATION` divided by `100`.
*
* This property is limited to no more than 8 attributes.
*
* @see [Arcade Visualization Profile](https://developers.arcgis.com/javascript/latest/arcade/#visualization)
* @example
* renderer.attributes = [{
* field: "POPULATION",
* label: "Population (2019)",
* color: "gray"
* }];
*/
get attributes(): AttributeColorInfo[];
set attributes(value: AttributeColorInfoProperties[]);
/**
* The color used to shade the polygon fill behind the dots. This can be autocast with a named string; hex string;
* array of rgb or rgba values; an
* object with `r`, `g`, `b`, and `a` properties; or a [Color](https://developers.arcgis.com/javascript/latest/references/core/Color/) object.
*
* @default [0, 0, 0, 0.25] - black, semitransparent
* @example
* // CSS color string
* renderer.backgroundColor = "dodgerblue";
* @example
* // HEX string
* renderer.backgroundColor = "#33cc33";
* @example
* // array of RGBA values
* renderer.backgroundColor = [51, 204, 51, 0.3];
* @example
* // object with rgba properties
* renderer.backgroundColor = {
* r: 51,
* g: 51,
* b: 204,
* a: 0.7
* };
*/
get backgroundColor(): Color;
set backgroundColor(value: ColorLike);
/**
* Only applicable when two or more [attributes](https://developers.arcgis.com/javascript/latest/references/core/renderers/DotDensityRenderer/#attributes) are specified. When `true`,
* indicates that colors for overlapping dots will blend. For example, in a feature where
* a high density of blue dots exist on top of a high density of red dots, some of the dots may
* appear as purple dots if this property is `true`. When `false` only one color will be favored over
* the others in rendering.
*
* Blend enabled | Blend disabled
* --------------|---------------
* 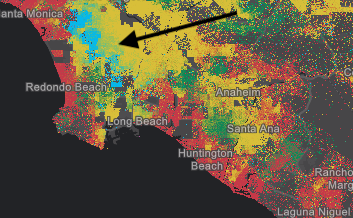 | 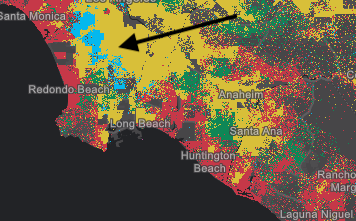
*
* @default true
*/
accessor dotBlendingEnabled: boolean;
/**
* Defines the size of the dots in points.
*
* @default 1
* @since 4.23
* @example renderer.dotSize = 0.5;
*/
accessor dotSize: number;
/**
* Defines the initial dot value used for visualizing density. If a [referenceScale](https://developers.arcgis.com/javascript/latest/references/core/renderers/DotDensityRenderer/#referenceScale)
* is provided, this value indicates the value of each dot at the [view.scale](https://developers.arcgis.com/javascript/latest/references/core/views/MapView/#scale)
* matching the value in [referenceScale](https://developers.arcgis.com/javascript/latest/references/core/renderers/DotDensityRenderer/#referenceScale). If [referenceScale](https://developers.arcgis.com/javascript/latest/references/core/renderers/DotDensityRenderer/#referenceScale) is set, the dot value will be recalculated depending on the
* view scale. Note the value of `dotValue` will remain constant even in this scenario. The variable
* dot value as displayed in the legend is recalculated using [calculateDotValue()](https://developers.arcgis.com/javascript/latest/references/core/renderers/DotDensityRenderer/#calculateDotValue).
* If a [referenceScale](https://developers.arcgis.com/javascript/latest/references/core/renderers/DotDensityRenderer/#referenceScale) is not provided, the value specified
* in this property will apply to dots at all scales.
*
* @example
* // Indicates that 1 dot = 100 people at any view scale
* renderer.dotValue = 100;
* renderer.legendOptions = {
* unit: "people"
* };
* @example
* // Indicates that 1 dot = 100 people only when the view's scale is 1:500,000
* // And a new dot value is computed as the scale changes.
* renderer.dotValue = 100;
* renderer.legendOptions = {
* unit: "people"
* };
* renderer.referenceScale = 500000;
*/
accessor dotValue: number;
/**
* An object providing options for configuring the renderer in the [Legend](https://developers.arcgis.com/javascript/latest/references/map-components/components/arcgis-legend/).
*
* @example
* // Legend will display: "1 dot = 50 cows"
* renderer.dotValue = 50;
* renderer.legendOptions = {
* unit: "cows"
* };
*/
get legendOptions(): DotDensityLegendOptions | null | undefined;
set legendOptions(value: DotDensityLegendOptionsProperties | null | undefined);
/**
* The outline of the polygon. When not set, this renders using the default
* [SimpleLineSymbol](https://developers.arcgis.com/javascript/latest/references/core/symbols/SimpleLineSymbol/). It is good practice to explicitly set this
* for every DotDensityRenderer. Either remove the outline altogether, or set it to a
* very thin, transparent style so it doesn't distract from the dot density.
*
* @example
* // removes the default outline from the renderer
* renderer.outline = null;
* @example
* // sets a thin, transparent outline to the renderer
* renderer.outline = {
* color: [ 128,128,128, 0.2 ],
* width: 0.5
* };
* @example
* // disable the default outline
* renderer.outline = null;
*/
get outline(): SimpleLineSymbol;
set outline(value: SimpleLineSymbolProperties);
/**
* When defined, the renderer will recalculate the dot value linearly based on the change in the view's scale
* using the [calculateDotValue()](https://developers.arcgis.com/javascript/latest/references/core/renderers/DotDensityRenderer/#calculateDotValue) method.
* The rendering will maintain the density of points as drawn at the provided scale across various scales.
* However, the dot value will change as the user zooms in or out from the provided scale value, though the value
* of [dotValue](https://developers.arcgis.com/javascript/latest/references/core/renderers/DotDensityRenderer/#dotValue) will remain constant.
*
* When the computed dot value reaches `1`, the dot value is no longer recalculated as the user zooms further in.
*
* @example
* // Indicates that 1 dot = 100 people only when the view's scale is 1:500,000
* // And a new dot value is computed as the scale changes.
* // When the scale is 1:250,000, the dot value will be 50.
* renderer.dotValue = 100;
* renderer.legendOptions = {
* unit: "people"
* };
* renderer.referenceScale = 500000;
*/
accessor referenceScale: number;
/**
* When set to a consistent value, dot placements will be preserved for the same
* scale given all parameters are the same in the renderer. By design, dot placement varies for the same feature
* across scales.
* If the user desires to see a different set of dot placements for a given scale, the developer may provide an alternate
* seed value to recalculate the random placement of dots.
*
* @default 1
*/
accessor seed: number;
/** The type of renderer. */
get type(): "dot-density";
/**
* An array of [Size Visual Variable](https://developers.arcgis.com/javascript/latest/references/core/renderers/visualVariables/SizeVariable/) objects. Only one
* should be provided. This visual variable is used to vary the [outline](#outline) width based on the [view.scale](https://developers.arcgis.com/javascript/latest/references/core/views/MapView/#scale).
* See the snippet below for an example of this.
*
* @example
* renderer.visualVariables = [{
* type: "size",
* target: "outline",
* valueExpression: "$view.scale",
* stops: [
* { size: 1.5, value: 1881217},
* { size: 0.75, value: 5878804},
* { size: 0.375, value: 23515218},
* { size: 0, value: 47030436},
* ]
* }];
* @see [Styles and data visualization](https://developers.arcgis.com/javascript/latest/visualization/)
*/
get visualVariables(): SizeVariable[] | null | undefined;
set visualVariables(value: (SizeVariableProperties & { type: "size"; })[] | null | undefined);
/**
* Calculates an updated dot value for the given scale for the cases where a [referenceScale](https://developers.arcgis.com/javascript/latest/references/core/renderers/DotDensityRenderer/#referenceScale)
* is provided. This allows the [Legend](https://developers.arcgis.com/javascript/latest/references/map-components/components/arcgis-legend/) to update the dot value as the user
* zooms in or out in the view.
*
* @param scale - The view scale at which to calculate a new dot value.
* @returns The dot value used to render dots based on the given view scale.
*/
calculateDotValue(scale: number): number;
/**
* Creates a deep clone of the renderer.
*
* @returns A deep clone of the object that
* invoked this method.
* @example
* // Creates a deep clone of the first layer's renderer
* let renderer = view.map.layers.at(0).renderer.clone();
*/
clone(): DotDensityRenderer;
}
declare const DotDensityRendererSuperclass: typeof Renderer & typeof VisualVariablesMixin