@arcgis/core
Version:
ArcGIS Maps SDK for JavaScript: A complete 2D and 3D mapping and data visualization API
442 lines (440 loc) • 24.9 kB
TypeScript
import type Graphic from "../Graphic.js";
import type Renderer from "./Renderer.js";
import type ClassBreakInfo from "./support/ClassBreakInfo.js";
import type RendererLegendOptions from "./support/RendererLegendOptions.js";
import type CIMSymbol from "../symbols/CIMSymbol.js";
import type PolygonSymbol3D from "../symbols/PolygonSymbol3D.js";
import type { VisualVariablesMixin, VisualVariablesMixinProperties } from "./mixins/VisualVariablesMixin.js";
import type { ClassBreakInfoProperties } from "./support/ClassBreakInfo.js";
import type { FillSymbolUnion, SymbolUnion } from "../symbols/types.js";
import type { CIMSymbolProperties } from "../symbols/CIMSymbol.js";
import type { PolygonSymbol3DProperties } from "../symbols/PolygonSymbol3D.js";
import type { SimpleFillSymbolProperties } from "../symbols/SimpleFillSymbol.js";
import type { PictureFillSymbolProperties } from "../symbols/PictureFillSymbol.js";
import type { WebStyleSymbolProperties } from "../symbols/WebStyleSymbol.js";
import type { PointSymbol3DProperties } from "../symbols/PointSymbol3D.js";
import type { MeshSymbol3DProperties } from "../symbols/MeshSymbol3D.js";
import type { LineSymbol3DProperties } from "../symbols/LineSymbol3D.js";
import type { LabelSymbol3DProperties } from "../symbols/LabelSymbol3D.js";
import type { TextSymbolProperties } from "../symbols/TextSymbol.js";
import type { SimpleMarkerSymbolProperties } from "../symbols/SimpleMarkerSymbol.js";
import type { SimpleLineSymbolProperties } from "../symbols/SimpleLineSymbol.js";
import type { PictureMarkerSymbolProperties } from "../symbols/PictureMarkerSymbol.js";
import type { RendererLegendOptionsProperties } from "./support/RendererLegendOptions.js";
import type { RendererProperties } from "./Renderer.js";
export interface ClassBreaksRendererProperties extends RendererProperties, VisualVariablesMixinProperties, Partial<Pick<ClassBreaksRenderer, "defaultLabel" | "field" | "normalizationField" | "normalizationTotal" | "normalizationType" | "valueExpression" | "valueExpressionTitle">> {
/**
* When symbolizing polygon features with graduated symbols, set a [FillSymbol](https://developers.arcgis.com/javascript/latest/references/core/symbols/FillSymbol/)
* on this property to visualize the boundaries of each feature. Use a
* [FillSymbol](https://developers.arcgis.com/javascript/latest/references/core/symbols/FillSymbol/) of varying sizes in the [classBreakInfos](https://developers.arcgis.com/javascript/latest/references/core/renderers/ClassBreaksRenderer/#classBreakInfos)
* to indicate the quantity.
*
* > [!WARNING]
* >
* > Support for [CIMSymbol](https://developers.arcgis.com/javascript/latest/references/core/symbols/CIMSymbol/) was added at version 4.31 and is limited to 2D MapView.
*
* @example
* // this symbol will be applied to all features. It is only
* // necessary when visualizing polygon data with icons.
* renderer.backgroundFillSymbol = {
* type: "simple-fill",
* outline: {
* width: 1,
* color: "gray"
* }
* };
*/
backgroundFillSymbol?: ((PictureFillSymbolProperties & { type: "picture-fill" }) | (SimpleFillSymbolProperties & { type: "simple-fill" })) | (PolygonSymbol3DProperties & { type: "polygon-3d" }) | (CIMSymbolProperties & { type: "cim" }) | null;
/**
* Each element in the array is an object that provides information about a class break
* associated with the renderer.
*
* @example
* let renderer = {
* type: "class-breaks", // autocasts as new ClassBreaksRenderer()
* field: "HARVESTED_ACRES",
* classBreakInfos: [
* {
* minValue: 0, // 0 acres
* maxValue: 200000, // 200,000 acres
* symbol: sym1, // will be assigned sym1
* label: "fewer than 200,000 acres"
* }, {
* minValue: 200001, // 200,001 acres
* maxValue: 500000, // 500,000 acres
* symbol: sym2, // will be assigned sym2
* label: "200,000 - 500,000 acres"
* }, {
* minValue: 500001, // 500,001 acres
* maxValue: 750000, // 750,000 acres
* symbol: sym3, // will be assigned sym2
* label: "more than 500,000 acres"
* }
* ]
* };
*/
classBreakInfos?: ClassBreakInfoProperties[];
/**
* The default symbol assigned to features with a value not matched to a given break.
* If `null`, unmatched features will not be assigned a symbol.
*
* > [!WARNING]
* >
* > **Known Limitations**
* >
* > SceneLayers with a `mesh` [SceneLayer.geometryType](https://developers.arcgis.com/javascript/latest/references/core/layers/SceneLayer/#geometryType)
* > will display unmatching features with a generic symbol even if the `defaultSymbol` is
* > `null`.
*/
defaultSymbol?: (((PictureFillSymbolProperties & { type: "picture-fill" }) | (PictureMarkerSymbolProperties & { type: "picture-marker" }) | (SimpleFillSymbolProperties & { type: "simple-fill" }) | (SimpleLineSymbolProperties & { type: "simple-line" }) | (SimpleMarkerSymbolProperties & { type: "simple-marker" }) | (TextSymbolProperties & { type: "text" }) | (CIMSymbolProperties & { type: "cim" })) | ((LabelSymbol3DProperties & { type: "label-3d" }) | (LineSymbol3DProperties & { type: "line-3d" }) | (MeshSymbol3DProperties & { type: "mesh-3d" }) | (PointSymbol3DProperties & { type: "point-3d" }) | (PolygonSymbol3DProperties & { type: "polygon-3d" })) | (WebStyleSymbolProperties & { type: "web-style" })) | null;
/**
* An object providing options for displaying the renderer in the Legend.
*
* @example
* renderer.legendOptions = {
* title: "Population density",
* order: "descending-values",
* };
*/
legendOptions?: RendererLegendOptionsProperties | null;
}
/**
* ClassBreaksRenderer defines the symbol of each feature in a [Layer](https://developers.arcgis.com/javascript/latest/references/core/layers/Layer/)
* based on the value of a numeric attribute. Symbols are assigned based on classes or ranges
* of data. Each feature is assigned a symbol based on the class break in which the value
* of the attribute falls.
*
* > [!WARNING]
* >
* > **Supported layers**
* >
* > ClassBreaksRenderer may only be used to create visualizations for the following layer types: [FeatureLayer](https://developers.arcgis.com/javascript/latest/references/core/layers/FeatureLayer/), [SceneLayer](https://developers.arcgis.com/javascript/latest/references/core/layers/SceneLayer/), [MapImageLayer](https://developers.arcgis.com/javascript/latest/references/core/layers/MapImageLayer/), [CSVLayer](https://developers.arcgis.com/javascript/latest/references/core/layers/CSVLayer/), [GeoJSONLayer](https://developers.arcgis.com/javascript/latest/references/core/layers/GeoJSONLayer/), [OGCFeatureLayer](https://developers.arcgis.com/javascript/latest/references/core/layers/OGCFeatureLayer/), [WFSLayer](https://developers.arcgis.com/javascript/latest/references/core/layers/WFSLayer/), [StreamLayer](https://developers.arcgis.com/javascript/latest/references/core/layers/StreamLayer/), [ImageryLayer](https://developers.arcgis.com/javascript/latest/references/core/layers/ImageryLayer/), and [ImageryTileLayer](https://developers.arcgis.com/javascript/latest/references/core/layers/ImageryTileLayer/)
*
* A numeric [attribute field](https://developers.arcgis.com/javascript/latest/references/core/renderers/ClassBreaksRenderer/#field) from which to define
* the class breaks must be specified. Each break and its associated symbol must also be defined
* using the [addClassBreakInfo()](https://developers.arcgis.com/javascript/latest/references/core/renderers/ClassBreaksRenderer/#addClassBreakInfo) method or the [classBreakInfos](https://developers.arcgis.com/javascript/latest/references/core/renderers/ClassBreaksRenderer/#classBreakInfos) property
* in the constructor.
*
* In the example below a [FeatureLayer](https://developers.arcgis.com/javascript/latest/references/core/layers/FeatureLayer/) representing
* block groups is rendered with a [ClassBreaksRenderer](https://developers.arcgis.com/javascript/latest/references/core/renderers/ClassBreaksRenderer/). Features where fewer
* than 35% of the population have a college degree are rendered with a deep green color. Features
* where between 35% and 50% of the population have a college degree are rendered with a pale green symbol.
* The other features are similarly rendered based on the value of the attribute of interest.
*
* [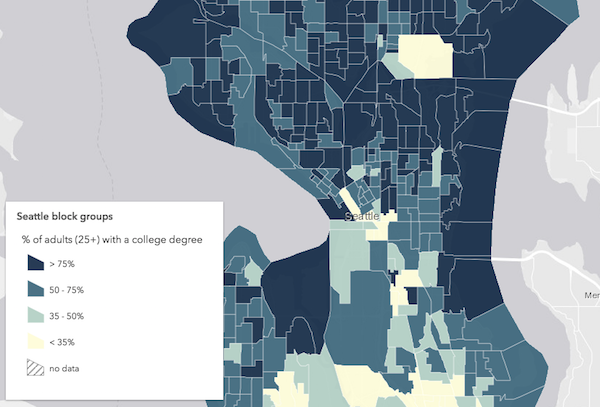](https://developers.arcgis.com/javascript/latest/sample-code/visualization-classbreaks/)
*
* @since 4.0
* @see [Sample - Visualize data with class breaks](https://developers.arcgis.com/javascript/latest/sample-code/visualization-classbreaks/)
* @see [Guide - Esri color ramps](https://developers.arcgis.com/javascript/latest/esri-color-ramps/)
* @see [Guide - Visualization best practices](https://developers.arcgis.com/javascript/latest/visualization-best-practices/)
* @example
* let renderer = new ClassBreaksRenderer({
* // attribute of interest - Earthquake magnitude
* field: "MAGNITUDE"
* });
* // All features with magnitude between 0 - 4.0
* renderer.addClassBreakInfo({
* minValue: 0,
* maxValue: 4.0,
* symbol: {
* type: "point-3d", // autocasts as new PointSymbol3D()
* symbolLayers: [{
* type: "object", // autocasts as new ObjectSymbol3DLayer()
* resource: { primitive: "cone" },
* material: { color: [0, 169, 230] },
* height: 200000,
* width: 50000
* }]
* }
* });
* // All features with magnitude between 4.1 - 7.0
* renderer.addClassBreakInfo({
* minValue: 4.1,
* maxValue: 7.0,
* symbol: {
* type: "point-3d", // autocasts as new PointSymbol3D()
* symbolLayers: [{
* type: "object", // autocasts as new ObjectSymbol3DLayer()
* resource: { primitive: "cone" },
* material: { color: [230, 230, 0] },
* height: 800000,
* width: 90000
* }]
* }
* });
* // All features with magnitude between 7.1 - 10.0
* renderer.addClassBreakInfo({
* minValue: 7.1,
* maxValue: 10.0,
* symbol: {
* type: "point-3d", // autocasts as new PointSymbol3D()
* symbolLayers: [{
* type: "object", // autocasts as new ObjectSymbol3DLayer()
* resource: { primitive: "cone" },
* material: { color: [230, 0, 0] },
* height: 3200000,
* width: 130000
* }]
* }
* });
*
* let layer = new FeatureLayer({
* url: "http://url.to.service",
* renderer: renderer
* });
*/
export default class ClassBreaksRenderer extends ClassBreaksRendererSuperclass {
/**
* @example
* // Typical usage
* let renderer = {
* type: "class-breaks", // autocasts as new ClassBreaksRenderer()
* field: "fieldName",
* classBreakInfos: [ ... ]
* };
*/
constructor(properties?: ClassBreaksRendererProperties);
/**
* When symbolizing polygon features with graduated symbols, set a [FillSymbol](https://developers.arcgis.com/javascript/latest/references/core/symbols/FillSymbol/)
* on this property to visualize the boundaries of each feature. Use a
* [FillSymbol](https://developers.arcgis.com/javascript/latest/references/core/symbols/FillSymbol/) of varying sizes in the [classBreakInfos](https://developers.arcgis.com/javascript/latest/references/core/renderers/ClassBreaksRenderer/#classBreakInfos)
* to indicate the quantity.
*
* > [!WARNING]
* >
* > Support for [CIMSymbol](https://developers.arcgis.com/javascript/latest/references/core/symbols/CIMSymbol/) was added at version 4.31 and is limited to 2D MapView.
*
* @example
* // this symbol will be applied to all features. It is only
* // necessary when visualizing polygon data with icons.
* renderer.backgroundFillSymbol = {
* type: "simple-fill",
* outline: {
* width: 1,
* color: "gray"
* }
* };
*/
get backgroundFillSymbol(): FillSymbolUnion | PolygonSymbol3D | CIMSymbol | null | undefined;
set backgroundFillSymbol(value: ((PictureFillSymbolProperties & { type: "picture-fill" }) | (SimpleFillSymbolProperties & { type: "simple-fill" })) | (PolygonSymbol3DProperties & { type: "polygon-3d" }) | (CIMSymbolProperties & { type: "cim" }) | null | undefined);
/**
* Each element in the array is an object that provides information about a class break
* associated with the renderer.
*
* @example
* let renderer = {
* type: "class-breaks", // autocasts as new ClassBreaksRenderer()
* field: "HARVESTED_ACRES",
* classBreakInfos: [
* {
* minValue: 0, // 0 acres
* maxValue: 200000, // 200,000 acres
* symbol: sym1, // will be assigned sym1
* label: "fewer than 200,000 acres"
* }, {
* minValue: 200001, // 200,001 acres
* maxValue: 500000, // 500,000 acres
* symbol: sym2, // will be assigned sym2
* label: "200,000 - 500,000 acres"
* }, {
* minValue: 500001, // 500,001 acres
* maxValue: 750000, // 750,000 acres
* symbol: sym3, // will be assigned sym2
* label: "more than 500,000 acres"
* }
* ]
* };
*/
get classBreakInfos(): ClassBreakInfo[];
set classBreakInfos(value: ClassBreakInfoProperties[]);
/**
* Label used in the [Legend](https://developers.arcgis.com/javascript/latest/references/map-components/components/arcgis-legend/) to describe features assigned the
* [default symbol](https://developers.arcgis.com/javascript/latest/references/core/renderers/ClassBreaksRenderer/#defaultSymbol). The [default symbol](https://developers.arcgis.com/javascript/latest/references/core/renderers/ClassBreaksRenderer/#defaultSymbol) is used to draw
* all features with unspecified, unmatched values.
*/
accessor defaultLabel: string | null | undefined;
/**
* The default symbol assigned to features with a value not matched to a given break.
* If `null`, unmatched features will not be assigned a symbol.
*
* > [!WARNING]
* >
* > **Known Limitations**
* >
* > SceneLayers with a `mesh` [SceneLayer.geometryType](https://developers.arcgis.com/javascript/latest/references/core/layers/SceneLayer/#geometryType)
* > will display unmatching features with a generic symbol even if the `defaultSymbol` is
* > `null`.
*/
get defaultSymbol(): SymbolUnion | null | undefined;
set defaultSymbol(value: (((PictureFillSymbolProperties & { type: "picture-fill" }) | (PictureMarkerSymbolProperties & { type: "picture-marker" }) | (SimpleFillSymbolProperties & { type: "simple-fill" }) | (SimpleLineSymbolProperties & { type: "simple-line" }) | (SimpleMarkerSymbolProperties & { type: "simple-marker" }) | (TextSymbolProperties & { type: "text" }) | (CIMSymbolProperties & { type: "cim" })) | ((LabelSymbol3DProperties & { type: "label-3d" }) | (LineSymbol3DProperties & { type: "line-3d" }) | (MeshSymbol3DProperties & { type: "mesh-3d" }) | (PointSymbol3DProperties & { type: "point-3d" }) | (PolygonSymbol3DProperties & { type: "polygon-3d" })) | (WebStyleSymbolProperties & { type: "web-style" })) | null | undefined);
/**
* The name of a numeric attribute field whose data determines
* the symbol of each feature based on the class breaks defined
* in [classBreakInfos](https://developers.arcgis.com/javascript/latest/references/core/renderers/ClassBreaksRenderer/#classBreakInfos).
*
* @example
* let renderer = {
* type: "class-breaks", // autocasts as new ClassBreaksRenderer()
* field: "totalAcres", // values returned by this field will
* // be used to render features
* classBreakInfos: [
* {
* minValue: 0, // 0 acres
* maxValue: 200000, // 200,000 acres
* symbol: sym1 // will be assigned sym1
* }, {
* minValue: 200001, // 200,001 acres
* maxValue: 500000, // 500,000 acres
* symbol: sym2 // will be assigned sym2
* }, {
* minValue: 500001, // 500,001 acres
* maxValue: 750000, // 750,000 acres
* symbol: sym3 // will be assigned sym2
* }
* ]
* };
*/
accessor field: string;
/**
* An object providing options for displaying the renderer in the Legend.
*
* @example
* renderer.legendOptions = {
* title: "Population density",
* order: "descending-values",
* };
*/
get legendOptions(): RendererLegendOptions | null | undefined;
set legendOptions(value: RendererLegendOptionsProperties | null | undefined);
/**
* When [normalizationType](https://developers.arcgis.com/javascript/latest/references/core/renderers/ClassBreaksRenderer/#normalizationType) is `field`, this property contains the
* attribute field name used for normalization.
*/
accessor normalizationField: string | null | undefined;
/**
* When [normalizationType](https://developers.arcgis.com/javascript/latest/references/core/renderers/ClassBreaksRenderer/#normalizationType) is `percent-of-total`, this property
* contains the total of all data values.
*/
accessor normalizationTotal: number | null | undefined;
/**
* Indicates how the data is normalized. If this property is defined, then
* the class breaks contain a normalized
* min/max value instead of the value in the given [field](https://developers.arcgis.com/javascript/latest/references/core/renderers/ClassBreaksRenderer/#field).
* The data value obtained from the field
* is normalized in one of the following ways before it is compared with the class breaks. See the
* table below for a list of possible values.
*
* Possible Value | Description
* ---------------|------------
* field | Divides the data value using the attribute value of the field specified in the [normalizationField](https://developers.arcgis.com/javascript/latest/references/core/renderers/ClassBreaksRenderer/#normalizationField) property. This value is set by default if the [normalizationField](https://developers.arcgis.com/javascript/latest/references/core/renderers/ClassBreaksRenderer/#normalizationField) is provided.
* log | Computes the base 10 logarithm of the data value. This can be a useful approach for some data distributions because it reduces the influence of very large data values.
* percent-of-total | Divides the data value by the sum of all data values then multiplies by 100. Use [normalizationTotal](https://developers.arcgis.com/javascript/latest/references/core/renderers/ClassBreaksRenderer/#normalizationTotal) to define the total value by which to normalize. This value is set by default if the [normalizationTotal](https://developers.arcgis.com/javascript/latest/references/core/renderers/ClassBreaksRenderer/#normalizationTotal) is provided.
*
* With the exception of `log` normalization, data normalization creates a ratio by dividing two values.
* When comparing attribute values between features, normalization minimizes the effect of varying
* map areas and the number of observations.
*
* For example, dividing the 18 to 30 year old population by the
* area of a polygon feature yields a density value that can be compared evenly with other features,
* regardless of their size.
*/
accessor normalizationType: "field" | "log" | "percent-of-total" | null | undefined;
/** The type of renderer. */
get type(): "class-breaks";
/**
* An [Arcade](https://developers.arcgis.com/javascript/latest/arcade/) expression following the specification
* defined by the [Arcade Visualization Profile](https://developers.arcgis.com/javascript/latest/arcade/#visualization). Expressions
* in ClassBreaksRenderer may reference field values using the `$feature` profile variable and must return a number.
*
* The values returned from this expression are the data used to drive the visualization as defined in the [classBreakInfos](https://developers.arcgis.com/javascript/latest/references/core/renderers/ClassBreaksRenderer/#classBreakInfos).
*
* This property is typically used as an alternative to [field](https://developers.arcgis.com/javascript/latest/references/core/renderers/ClassBreaksRenderer/#field) for
* data-driven visualizations.
*
* @see [Arcade Visualization Profile](https://developers.arcgis.com/javascript/latest/arcade/#visualization)
* @example
* // expression calculating voter turnout based on two field values
* let renderer = {
* type: "class-breaks", // autocasts as new ClassBreaksRenderer()
* valueExpression: "( $feature.TOT_VOTES / $feature.REG_VOTERS ) * 100",
* classBreakInfos: [ ... ], // assigns symbols to manual class breaks
* // e.g. 0-20, 20-40, 40-60, 60-80, 80-100
* };
*/
accessor valueExpression: string | null | undefined;
/**
* The title identifying and describing the associated [Arcade](https://developers.arcgis.com/javascript/latest/arcade/)
* expression as defined in the [valueExpression](https://developers.arcgis.com/javascript/latest/references/core/renderers/ClassBreaksRenderer/#valueExpression) property. This is displayed
* as the title of the corresponding renderer in the [Legend](https://developers.arcgis.com/javascript/latest/references/map-components/components/arcgis-legend/)
* in the absence of a provided `title` in the [legendOptions](https://developers.arcgis.com/javascript/latest/references/core/renderers/ClassBreaksRenderer/#legendOptions) property.
*
* @example
* renderer.valueExpression = "$feature.POP / $feature.SQ_MI * 100";
* renderer.valueExpressionTitle = "Population per square mile";
*/
accessor valueExpressionTitle: string | null | undefined;
/**
* Adds a class break to the renderer. You can provide the minimum, maximum and symbol values as individual
* arguments or by using the info object.
* The range of the break is greater than or equal to the minimum value and less than the maximum value.
*
* @param min - The minimum value to use in the break. This can be a number or an
* info object as defined in [classBreakInfos](https://developers.arcgis.com/javascript/latest/references/core/renderers/ClassBreaksRenderer/#classBreakInfos).
* @param max - The maximum value to use in the break.
* @param symbol - Symbol to use for the break.
* @example
* // add a class break using an info object
* renderer.addClassBreakInfo({
* minValue: 0, // lower limit of the break
* maxValue: 2, // upper limit of the break
* symbol: symbol1 // the symbol assigned to features in this break
* });
* @example
* // add a class break using arguments
* renderer.addClassBreakInfo(2, 4, symbol2);
* // Features with values between 2 - 4 will be assigned symbol2
* });
*/
addClassBreakInfo(min: number | ClassBreakInfoProperties, max?: number, symbol?: SymbolUnion): void;
/**
* Creates a deep clone of the renderer.
*
* @returns A deep clone of the object that
* invoked this method.
* @example
* // Creates a deep clone of the first layer's renderer
* let renderer = view.map.layers.at(0).renderer.clone();
*/
clone(): ClassBreaksRenderer;
/**
* Returns the [classBreakInfo](https://developers.arcgis.com/javascript/latest/references/core/renderers/ClassBreaksRenderer/#classBreakInfos) information (as defined by the renderer)
* associated with the given graphic.
*
* @param graphic - The graphic whose rendering information will be returned.
* @returns Resolves to an object containing rendering and legend information for
* the break associated with the graphic.
* @example
* view.on("click", function(event){
* view.hitTest(event)
* .then(function(hitResponse){
* const resultGraphic = hitResponse.results[0].graphic;
* // assumes the layer's renderer is a ClassBreakRenderer instance
* return layer.renderer.getClassBreakInfo(resultGraphic);
* }).then(function(classBreak){
* // returns the class break info to which the graphic belongs.
* });
* });
*/
getClassBreakInfo(graphic: Graphic): Promise<ClassBreakInfo | null | undefined>;
/**
* Removes a break from the renderer.
*
* @param min - Minimum value in the break to remove
* @param max - Maximum value in the break to remove.
* @example
* // removes the break defined for values between 2 - 4.
* renderer.removeClassBreakInfo(2,4);
*/
removeClassBreakInfo(min: number, max: number): void;
}
declare const ClassBreaksRendererSuperclass: typeof Renderer & typeof VisualVariablesMixin