@arcgis/core
Version:
ArcGIS Maps SDK for JavaScript: A complete 2D and 3D mapping and data visualization API
715 lines (713 loc) • 55.4 kB
TypeScript
import type PopupTemplate from "../PopupTemplate.js";
import type Layer from "./Layer.js";
import type Field from "./support/Field.js";
import type RasterFunction from "./support/RasterFunction.js";
import type RasterInfo from "./support/RasterInfo.js";
import type TileInfo from "./support/TileInfo.js";
import type PortalItem from "../portal/PortalItem.js";
import type ImageHistogramParameters from "../rest/support/ImageHistogramParameters.js";
import type ElevationInfo from "../symbols/support/ElevationInfo.js";
import type { ClonableMixin } from "../core/Clonable.js";
import type { MultiOriginJSONSupportMixin } from "../core/MultiOriginJSONSupport.js";
import type { AbortOptions } from "../core/promiseUtils.js";
import type { LayerSaveOptions, LayerSaveAsOptions } from "./types.js";
import type { BlendLayer, BlendLayerProperties } from "./mixins/BlendLayer.js";
import type { CustomParametersMixin, CustomParametersMixinProperties } from "./mixins/CustomParametersMixin.js";
import type { OperationalLayer, OperationalLayerProperties } from "./mixins/OperationalLayer.js";
import type { PortalLayer, PortalLayerProperties } from "./mixins/PortalLayer.js";
import type { RasterPresetRendererMixin, RasterPresetRendererMixinProperties } from "./mixins/RasterPresetRendererMixin.js";
import type { RefreshableLayer, RefreshableLayerProperties } from "./mixins/RefreshableLayer.js";
import type { ScaleRangeLayer, ScaleRangeLayerProperties } from "./mixins/ScaleRangeLayer.js";
import type { TemporalLayer, TemporalLayerProperties } from "./mixins/TemporalLayer.js";
import type { TiledImagery, TiledImageryProperties } from "./mixins/TiledImagery.js";
import type { FetchRasterOptions, PixelData } from "./raster/types.js";
import type { RasterFunctionProperties } from "./support/RasterFunction.js";
import type { PortalItemProperties } from "../portal/PortalItem.js";
import type { ClassBreaksRendererProperties } from "../renderers/ClassBreaksRenderer.js";
import type { FlowRendererProperties } from "../renderers/FlowRenderer.js";
import type { RasterColormapRendererProperties } from "../renderers/RasterColormapRenderer.js";
import type { RasterShadedReliefRendererProperties } from "../renderers/RasterShadedReliefRenderer.js";
import type { RasterStretchRendererProperties } from "../renderers/RasterStretchRenderer.js";
import type { UniqueValueRendererProperties } from "../renderers/UniqueValueRenderer.js";
import type { VectorFieldRendererProperties } from "../renderers/VectorFieldRenderer.js";
import type { RasterRendererUnion } from "../renderers/support/raster/types.js";
import type { RequestOptions } from "../request/types.js";
import type { ImageServiceStatisticsHistogramsResult } from "../rest/imageService.js";
import type { ImageHistogramParametersProperties } from "../rest/support/ImageHistogramParameters.js";
import type { CreatePopupTemplateOptions } from "../support/popupUtils.js";
import type { ElevationInfoProperties } from "../symbols/support/ElevationInfo.js";
import type { TileInfoProperties } from "./support/TileInfo.js";
import type { PopupTemplateProperties } from "../PopupTemplate.js";
import type { LayerProperties } from "./Layer.js";
export interface ImageryTileLayerProperties extends LayerProperties, RefreshableLayerProperties, TemporalLayerProperties, TiledImageryProperties, CustomParametersMixinProperties, RasterPresetRendererMixinProperties, PortalLayerProperties, OperationalLayerProperties, ScaleRangeLayerProperties, BlendLayerProperties, Partial<Pick<ImageryTileLayer, "popupEnabled" | "screenSizePerspectiveEnabled" | "sourceJSON" | "url">> {
/**
* Specifies how the imagery is placed on the vertical axis (z). This property may only be used
* in a [SceneView](https://developers.arcgis.com/javascript/latest/references/core/views/SceneView/). See the [ElevationInfo sample](https://developers.arcgis.com/javascript/latest/sample-code/scene-elevationinfo/)
* for an example of how this property may be used.
*
* > [!WARNING]
* >
* > The elevation info only affects [ImageryTileLayer](https://developers.arcgis.com/javascript/latest/references/core/layers/ImageryTileLayer/) if the `renderer` is set to [FlowRenderer](https://developers.arcgis.com/javascript/latest/references/core/renderers/FlowRenderer/) and applies `on-the-ground` mode if it is null.
* > The `relative-to-scene` mode does not affect [ImageryTileLayer](https://developers.arcgis.com/javascript/latest/references/core/layers/ImageryTileLayer/).
* > [ElevationInfo.featureExpressionInfo](https://developers.arcgis.com/javascript/latest/references/core/symbols/support/ElevationInfo/#featureExpressionInfo) is not supported when the elevation info is specified for this class.
* > If the elevation info is not specified, the effective elevation depends on the context and could vary per point.
*
* @since 4.34
*/
elevationInfo?: ElevationInfoProperties | null;
/**
* Indicates whether the layer will be included in the legend. When `false`, the layer will be excluded from the legend.
*
* @default true
*/
legendEnabled?: boolean;
/**
* The popup template for the layer. When set on the layer, the popupTemplate
* allows users to access attributes and display their values using text and/or charts
* in the view's popup when a pixel is clicked.
* See [this sample](https://developers.arcgis.com/javascript/latest/sample-code/layers-imagery-popup/)
* for an example of how [PopupTemplate](https://developers.arcgis.com/javascript/latest/references/core/PopupTemplate/) interacts with an
* [ImageryTileLayer](https://developers.arcgis.com/javascript/latest/references/core/layers/ImageryTileLayer/).
*
* A default popup template is automatically used if no `popupTemplate` has been defined when
* [Popup.defaultPopupTemplateEnabled](https://developers.arcgis.com/javascript/latest/references/core/widgets/Popup/#defaultPopupTemplateEnabled)
* is set to `true`.
*
* @see [ImageryTileLayerView](https://developers.arcgis.com/javascript/latest/references/core/views/layers/ImageryTileLayerView/)
* @see [Raster pixel value fields](https://developers.arcgis.com/javascript/latest/references/core/layers/ImageryTileLayer/#rasterFields)
* @see [createPopupTemplate()](https://developers.arcgis.com/javascript/latest/references/core/layers/ImageryTileLayer/#createPopupTemplate)
* @see [SceneView.popup](https://developers.arcgis.com/javascript/latest/references/core/views/SceneView/#popup)
* @see [View2D.popup](https://developers.arcgis.com/javascript/latest/references/core/views/View2D/#popup)
*/
popupTemplate?: PopupTemplateProperties | null;
/**
* The client-side raster functions are operations that apply processing directly to the source image pixels.
* The calculations are only applied to the source pixels that are visible in the map as you pan and zoom within the map.
*
* There are many of out-of-the-box raster functions that can be used for radiometric enhancement,
* data management, visualization, and analysis. These raster functions can be applied individually or combined to create function chains to be shared as
* raster function templates (RFTs). Refer to [Client-side raster function](https://ubatsukh.github.io/arcgis-js-api-demos/clientside-rasterfunctions/)
* app to see a list of client-side raster functions.
*
* Use helper functions from the [rasterFunctionUtils](https://developers.arcgis.com/javascript/latest/references/core/layers/support/rasterFunctionUtils/) module when creating raster functions that apply to ImageryTileLayers.
*
* The [rasterFunctionConstants](https://developers.arcgis.com/javascript/latest/references/core/layers/support/rasterFunctionConstants/) module provides constant values that can be used as parameters of different raster functions when
* setting the layer's `rasterFunction`.
*
* @beta
* @since 4.26
* @see [REST API Raster function objects](https://developers.arcgis.com/documentation/common-data-types/raster-function-objects.htm)
* @see [List of client-side raster function](https://ubatsukh.github.io/arcgis-js-api-demos/clientside-rasterfunctions/)
* @see [rasterFunctionConstants](https://developers.arcgis.com/javascript/latest/references/core/layers/support/rasterFunctionConstants/)
* @example
* // apply NDVI and colormap raster function to an imagery tile layer
* // use rasterFunctionUtils convenience methods to create raster functions
* const ndvi = rasterFunctionUtils.bandArithmeticNDVI({
* nirBandId: 4,
* redBandId: 3,
* scientificOutput: false
* });
*
* const colormap = rasterFunctionUtils.colormap({
* colorRampName: "NDVI3",
* raster: ndvi
* });
* layer.rasterFunction = colormap;
* @example
* function createRasterFunction() {
* // processed bands from the imagery tile layer
* const rasters = [weightedRoadDistance, weightedProtectedStatus, weightedTerrainRuggedness, weightedLandCover, 0.25];
* const sumFunction = new RasterFunction({
* functionName: "Local",
* functionArguments: {
* operation: rasterFunctionTypes.cellStatisticalOperation.sum,
* rasters
* },
* outputPixelType: "u8"
* });
*
* const colormapFunction = new RasterFunction({
* functionName: "Colormap",
* functionArguments: {
* colormap: [[0, 0, 0, 255], [1, 56, 168, 0], [2, 141, 212, 0], [3, 255, 255, 0], [4, 255, 128, 0], [5, 255, 0, 0]],
* raster: sumFunction
* },
* outputPixelType: "u8"
* });
* return colormapFunction;
* }
*
* // clear renderer to use the default renderer for the new function
* layer.renderer = null;
* layer.rasterFunction = createRasterFunction();
*/
rasterFunction?: RasterFunctionProperties | null;
/**
* The client-side renderer assigned to the layer. The renderer defines how to visualize pixels in the tile imagery layer.
* Depending on the renderer type, the pixels may be [stretched](https://developers.arcgis.com/javascript/latest/references/core/renderers/RasterStretchRenderer/)
* across the color ramp, [classified](https://developers.arcgis.com/javascript/latest/references/core/renderers/ClassBreaksRenderer/),
* have [different symbols](https://developers.arcgis.com/javascript/latest/references/core/renderers/UniqueValueRenderer/) based on values, or show [shaded reliefs](https://developers.arcgis.com/javascript/latest/references/core/renderers/RasterShadedReliefRenderer/).
*
* > [!WARNING]
* >
* > **Known Limitations**
* >
* > Currently, the [VectorFieldRenderer](https://developers.arcgis.com/javascript/latest/references/core/renderers/VectorFieldRenderer/) is not supported in 3D [SceneView](https://developers.arcgis.com/javascript/latest/references/core/views/SceneView/).
*
* @see [Sample - Intro to ImageryTileLayer](https://developers.arcgis.com/javascript/latest/sample-code/layers-imagerytilelayer/)
* @see [Sample - ImageryTileLayer - shaded relief renderer](https://developers.arcgis.com/javascript/latest/sample-code/layers-imagery-renderer/)
* @see [Sample - Transposed multidimensional ImageryTileLayer](https://developers.arcgis.com/javascript/latest/sample-code/layers-hosted-imagerytilelayer/)
* @see [Sample - FlowRenderer](https://developers.arcgis.com/javascript/latest/sample-code/layers-imagery-afrenderer/)
* @see [Sample - FlowRenderer with Blending and Effects](https://developers.arcgis.com/javascript/latest/sample-code/layers-imagery-afrenderer-blending/)
* @see [Sample - FlowRenderer in a 3D scene](https://developers.arcgis.com/javascript/latest/sample-code/layers-imagerytilelayer-flow-3d-global/)
* @see [Sample - FlowRenderer with elevation modes](https://developers.arcgis.com/javascript/latest/sample-code/layers-imagerytilelayer-flow-3d-local/)
* @see [Sample - Intro to ImageryTileLayer](https://developers.arcgis.com/javascript/latest/sample-code/layers-imagerytilelayer/)
* @see [Sample - ImageryTileLayer - shaded relief renderer](https://developers.arcgis.com/javascript/latest/sample-code/layers-imagery-renderer/)
* @see [Sample - Transposed multidimensional ImageryTileLayer](https://developers.arcgis.com/javascript/latest/sample-code/layers-hosted-imagerytilelayer/)
*/
renderer?: (ClassBreaksRendererProperties & { type: "class-breaks"; }) | (UniqueValueRendererProperties & { type: "unique-value"; }) | (RasterStretchRendererProperties & { type: "raster-stretch"; }) | (RasterShadedReliefRendererProperties & { type: "raster-shaded-relief"; }) | (RasterColormapRendererProperties & { type: "raster-colormap"; }) | (VectorFieldRendererProperties & { type: "vector-field"; }) | (FlowRendererProperties & { type: "flow"; }) | null;
/**
* The data source for client-side ImageryTileLayer can be a [coverage JSON](https://www.ogc.org/standard/coveragejson/) object
* or [PixelData](https://developers.arcgis.com/javascript/latest/references/core/layers/raster/types/#PixelData). Once the layer is loaded, the data source is stored in memory.
* See [Creating ImageryTileLayer from CoverageJSON](https://developers.arcgis.com/javascript/latest/references/core/layers/ImageryTileLayer/#creating-from-covjson) section for more information.
*
* @since 4.29
* @see [Creating ImageryTileLayer from CoverageJSON](https://developers.arcgis.com/javascript/latest/references/core/layers/ImageryTileLayer/#creating-from-covjson)
*/
source?: PixelData | null;
/** The tiling scheme information for the layer. */
tileInfo?: TileInfoProperties | null;
/**
* The title of the layer used to identify it in places such as the [Legend](https://developers.arcgis.com/javascript/latest/references/map-components/components/arcgis-legend/)
* and [Layer List](https://developers.arcgis.com/javascript/latest/references/map-components/components/arcgis-layer-list/).
*
* When loading a layer by service url, the title is derived from the service name.
* If the service has several layers, then the title of each layer will be the concatenation of the service name
* and the layer name.
* When the layer is loaded from a portal item, the title of the portal item will be used instead.
* Finally, if a layer is loaded as part of a webmap or a webscene, then the title of the layer as stored in the webmap/webscene will be used.
*/
title?: string | null;
}
/**
* * [Creating an ImageryTileLayer](https://developers.arcgis.com/javascript/latest/references/core/layers/ImageryTileLayer/#creating-a-imagerytilelayer)
* * [From ArcGIS tiled image services](https://developers.arcgis.com/javascript/latest/references/core/layers/ImageryTileLayer/#creating-from-service)
* * [From Cloud Optimized GeoTIFF (COG)](https://developers.arcgis.com/javascript/latest/references/core/layers/ImageryTileLayer/#adding-cog)
* * [From CoverageJSON](https://developers.arcgis.com/javascript/latest/references/core/layers/ImageryTileLayer/#creating-from-covjson)
* * [Image tiles](https://developers.arcgis.com/javascript/latest/references/core/layers/ImageryTileLayer/#image-tiles)
* * [Working with multidimensional raster data](https://developers.arcgis.com/javascript/latest/references/core/layers/ImageryTileLayer/#multidimensionaldata)
*
* ImageryTileLayer presents raster data from a tiled image service. Binary imagery tiles are projected, processed, and rendered on the client-side. Tiled access is fast and scalable.
*
* <span id="creating-a-imagerytilelayer"></span>
* ## Creating an ImageryTileLayer
*
* ImageryTileLayers may be created from one of the following sources:
*
* * ArcGIS Enterprise or ArcGIS Online tiled image services
* * Cloud Optimized GeoTIFF (COG)
* * Coverage json source
* * [PixelData](https://developers.arcgis.com/javascript/latest/references/core/layers/raster/types/#PixelData)
*
* <span id="creating-from-service"></span>
* ### From ArcGIS tiled image services
*
* You can create an ImageryTileLayer from ArcGIS Enterprise or ArcGIS Online tiled image services in one of two ways:
*
* * To create an ImageryTileLayer instance from a service, you must set the [url](https://developers.arcgis.com/javascript/latest/references/core/layers/ImageryTileLayer/#url) property
* to the REST endpoint of [tiled image service](https://developers.arcgis.com/rest/services-reference/enterprise/image-service.htm).
*
* ```js
* // reference an tiled image service via the ImageryTileLayer.url
* const ImageryTileLayer = await $arcgis.import("@arcgis/core/layers/ImageryTileLayer.js");
* const layer = new ImageryTileLayer({
* url: "https://sampleserver6.arcgisonline.com/arcgis/rest/services/Toronto/ImageServer"
* });
* map.add(layer);
* ```
* * You can also create an ImageryTileLayer from its ID if it exists as an item in ArcGIS Online or ArcGIS Enterprise.
* For example, the following snippet shows how to add a new ImageryTileLayer instance to a map using the
* [portalItem](https://developers.arcgis.com/javascript/latest/references/core/layers/ImageryTileLayer/#portalItem) property.
*
* ```js
* const layer = new ImageryTileLayer({
* portalItem: {
* id: "1fb9eae319e54c74a13e2a8135015c41"
* }
* });
* map.add(layer);
* ```
*
* <span id="adding-cog"></span>
* ### From Cloud Optimized GeoTIFF (COG) (beta)
*
* At version 4.25, an ImageryTileLayer can be created by setting the [url](https://developers.arcgis.com/javascript/latest/references/core/layers/ImageryTileLayer/#url) property to point to a [Cloud Optimized GeoTIFF](https://www.cogeo.org/)
* (COG) file. COG is a regular GeoTIFF file, hosted on a HTTP file server, with internal settings that enable efficient workflows on the cloud.
* This may be a useful option when your imagery workflow generates a temporary image, and you need to view the image without having to publish it as an image
* service. In addition to the geo/tiff specifications, the JS API also supports auxiliary metadata (aux.xml) containing statistics and histograms, and attribute tables (vat.dbf) if
* the COG has categorical information such as land use type. Review the [ImageryTileLayer with COG](https://developers.arcgis.com/javascript/latest/sample-code/layers-imagerytilelayer-cog/) sample to see COG in action.
*
* > [!WARNING]
* >
* > **Notes**
* >
* > At this release, only COGS with the following settings are supported:
* > Non user defined spatial references with [EPSG codes](https://epsg.org/search/by-name/sessionkey/1xn99fkonu/crs_sort_by/code/crs_sort_dir/asc#crs) or spatial references with [esri WKT](https://developers.arcgis.com/rest/services-reference/enterprise/using-spatial-references.htm).
* > `NONE`, `JPEG`, `DEFLATE`, `LZW`, `LERC` [compressions](https://gdal.org/drivers/raster/gtiff.html#:~:text=COMPRESS%3D%5BJPEG/LZW/PACKBITS/DEFLATE/CCITTRLE/CCITTFAX3/CCITTFAX4/LZMA/ZSTD/LERC/LERC_DEFLATE/LERC_ZSTD/WEBP/JXL/NONE%5D%3A%20Set%20the%20compression%20to%20use.).
* > [Affine](https://gdal.org/drivers/raster/gtiff.html#:~:text=Georeferencing%20from%20GeoTIFF%20is%20supported%20in%20the%20form%20of%20one%20tiepoint%20and%20pixel%20size%2C%20a%20transformation%20matrix%2C%20or%20a%20list%20of%20GCPs.) and polynomial transformations (in aux with coefficients).
* > [Photometric interpretation](https://gdal.org/drivers/raster/gtiff.html#:~:text=PHOTOMETRIC%3D%5BMINISBLACK/MINISWHITE/RGB/CMYK/YCBCR/CIELAB/ICCLAB/ITULAB%5D%3A) with normal grayscale, RGB or color palette. Other photometric interpretation are read but displayed without color space conversion.
* ```js
* const layer = new ImageryTileLayer({
* url: "https://ss6imagery.arcgisonline.com/imagery_sample/landsat8/Bolivia_LC08_L1TP_001069_20190719_MS.tiff",
* bandIds: [3, 2, 1]
* });
* ```
*
* <span id="creating-from-covjson"></span>
* ### From CoverageJSON (beta)
*
* At version 4.29, an ImageryTileLayer can be created from [CoverageJSON](https://www.ogc.org/standard/coveragejson/#:~:text=Based%20on%20JavaScript%20Object%20Notation,and%20human%20readability%20and%20efficiency.).
* CoverageJSON is an OGC format for storing data such as grids, time and elevation profiles. CoverageJSON with [grid](https://docs.ogc.org/cs/21-069r2/21-069r2.html#common_domain_types) domain and
* [NdArrays](https://docs.ogc.org/cs/21-069r2/21-069r2.html#_0c82b6df-30f7-4d54-b90f-a0f98e75deed) are supported. Once the layer is loaded, the data source is stored in memory.
*
* An ImageryTileLayer can be created from CoverageJSON in one of two ways:
* * Set the [url](https://developers.arcgis.com/javascript/latest/references/core/layers/ImageryTileLayer/#url) property to point to a [CoverageJSON](https://docs.ogc.org/cs/21-069r2/21-069r2.html#_b8b17e78-0147-4b58-8ade-a19465b57abc) file.
*
* ```js
* const layer = new ImageryTileLayer({
* url: "link-to-coveragejson.covjson"
* });
* map.add(layer);
* ```
*
* * Set the [source](https://developers.arcgis.com/javascript/latest/references/core/layers/ImageryTileLayer/#source) property to point a CoverageJSON object.
* ```js
* const layer = new ImageryTileLayer({
* source:{
* type: "Coverage",
* domain: {
* type: "Domain",
* domainType: "Grid",
* axes: {
* x: { values: [-10, -5, 0] },
* y: { values: [40, 50] },
* t: { values: ["2010-01-01T00:12:20Z"] }
* },
* referencing: [
* {
* coordinates: ["x", "y"],
* system: {
* type: "GeographicCRS",
* id: "http://www.opengis.net/def/crs/OGC/1.3/CRS84"
* }
* },
* {
* coordinates: ["t"],
* system: {
* type: "TemporalRS",
* calendar: "Gregorian"
* }
* }
* ]
* },
* parameters: {
* ...
* },
* ranges: {
* LC: {
* type: "NdArray",
* dataType: "integer",
* axisNames: ["t", "y", "x"],
* shape: [1, 2, 3],
* values: [1, 1, null, 2, 1, 2]
* }
* }
* }
* });
* map.add(layer);
* ```
*
* <span id="image-tiles"></span>
*
* ### Image tiles
*
* There are four types of [image service tiles](https://developers.arcgis.com/rest/services-reference/enterprise/image-tile.htm) that can be leveraged by ImageryTileLayer:
* 1. **Raster tiles** represent tiles with meaningful pixel values compressed with LERC or JPEGPNG. The [hosted land cover ImageryTileLayer](https://developers.arcgis.com/javascript/latest/sample-code/layers-hosted-imagerytilelayer-landcover/)
* sample uses a [raster tile service](https://tiledimageservices.arcgis.com/V6ZHFr6zdgNZuVG0/arcgis/rest/services/NLCD_2016_Land_Cover_L48_20190424/ImageServer).
* 2. **Map tiles** represent rendered map images, typically in JPEG or PNG format. For example, [this tile image service](https://sampleserver6.arcgisonline.com/arcgis/rest/services/Toronto/ImageServer)
* has map tiles.
* 3. **[Elevation tiles](https://developers.arcgis.com/rest/services-reference/enterprise/image-tile.htm#:~:text=terms%20of%20topology%2C-,elevation%20tiles,-differ%20from%20normal)** represent precooked
* elevation data compressed with Limited Error Raster Compression (LERC). Review the [Tiled elevations service](https://developers.arcgis.com/documentation/tiled-elevation-service/) document for more information.
* The [ImageryTileLayer - shaded relief renderer](https://developers.arcgis.com/javascript/latest/sample-code/layers-imagery-renderer/) sample uses a service with elevation tiles.
* 4. **[Transposed multidimensional tiles](https://developers.arcgis.com/rest/services-reference/enterprise/build-multidimensional-transpose.htm)** are a subtype of raster tiles, which are hyper-cubic image tiles
* representing specific variables over all dimensions. They are created for optimizing performance while accessing pixel values across all multidimensional slices.
* Transposed multidimensional tiles are not used for visualization; they are only used for analysis. For example, you would use transposed multidimensional tiles to perform an identify operation that would provide access to dimension series' pixel values for a requested variable at a given location.
* The [Transposed multidimensional ImageryTileLayer](https://developers.arcgis.com/javascript/latest/sample-code/layers-hosted-imagerytilelayer/) sample demonstrates how these services can be used for analysis efficiently.
*
* <span id="adding-cog"></span>
*
* ###
*
* <span id="multidimensionaldata"></span>
* ### Working with multidimensional raster data
*
* Multidimensional data is commonly used in the scientific community to store atmospheric, oceanographic, and earth science data. Temperature, humidity, wind speed, and direction
* are all examples of the data that can be stored as variables in a multidimensional array.
* As illustrated in the graphic below, multidimensional data can show sea temperature (variable) for a specific area at multiple time and depth dimensions.
* This information is stored as slices, where the service has a slice for each unique combination of dimension values and variable names.
*
* [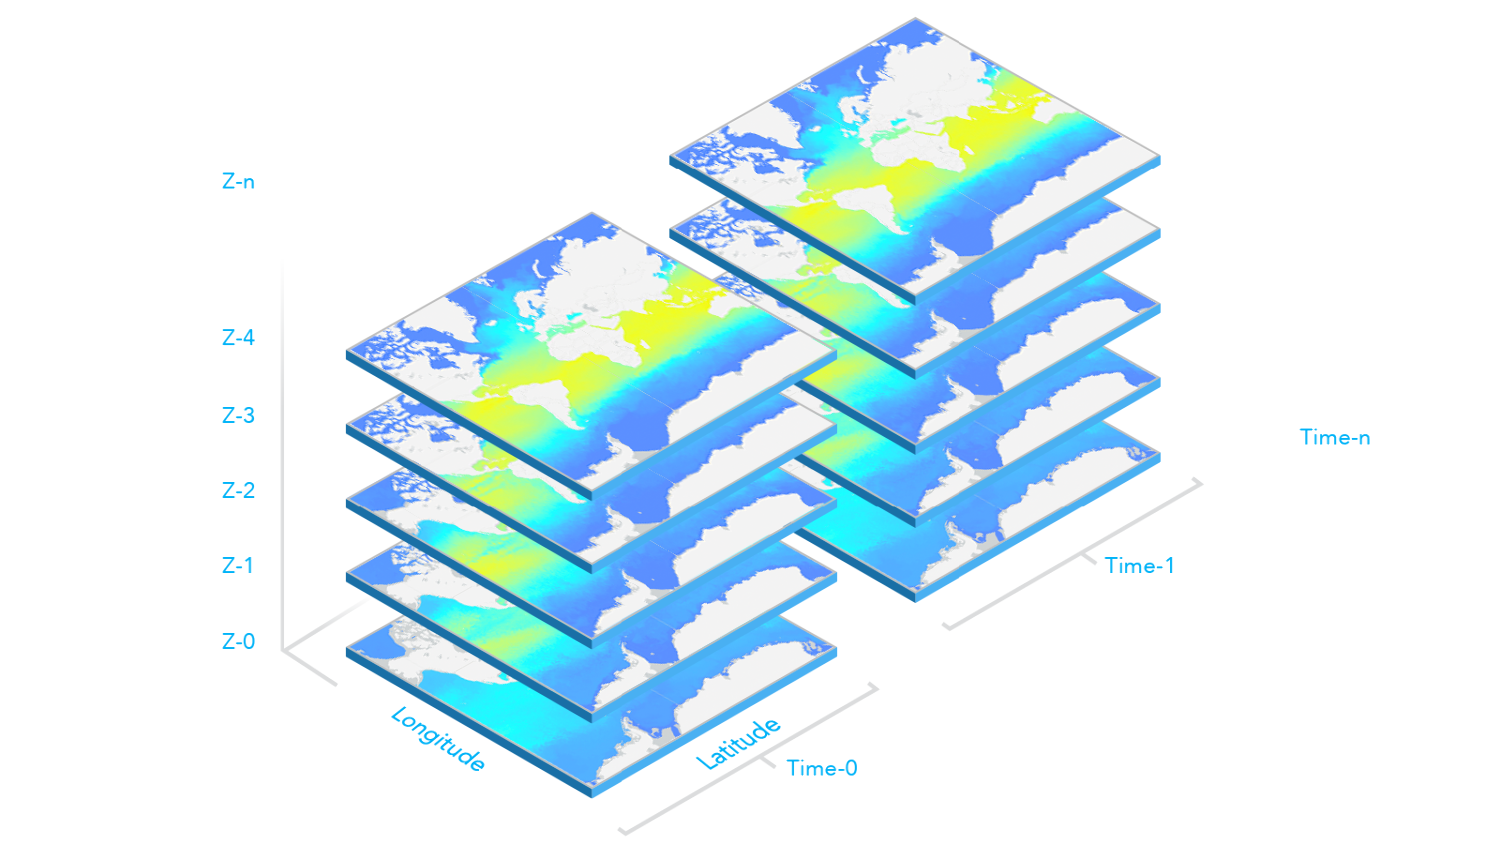](https://developers.arcgis.com/javascript/latest/sample-code/layers-hosted-imagerytilelayer/)
*
* <details>
* <summary>Read More</summary>
*
* ImageryTileLayer's multidimensional data information can be accessed through the layer's [serviceRasterInfo.multidimensionalInfo](https://developers.arcgis.com/javascript/latest/references/core/layers/ImageryTileLayer/#serviceRasterInfo) property. This
* information can then be used for analysis and visualization. For example, in the following snippet, the time dimension values associated with
* the `wind_magdir` variable are read from the layer's `serviceRasterInfo.multidimensionalInfo` property once the layer is loaded. Then, time values are used to configure
* the [Time Slider](https://developers.arcgis.com/javascript/latest/references/map-components/components/arcgis-time-slider/) component to animate the wind speed and direction data over time.
*
* ```js
* viewElement.whenLayerView(layer).then(() => {
* // get all time dimension values from the service, create an array of dates
* const windEpochDates = layer.serviceRasterInfo.multidimensionalInfo.variables[0].dimensions[0].values;
* const windDates = windEpochDates.map((item) => new Date(item));
*
* // time slider component initialization
* // users can visualize daily wind information for all the time dimension available
* const timeSlider = document.createElement("arcgis-time-slider");
* timeSlider.mode = "instant";
* timeSlider.view = view;
* timeSlider.fullTimeExtent = {
* start: new Date(windDates[0]), // Jan 1, 2011,
* end: new Date(windDates[windDates.length - 1]) // Dec 31, 2011
* };
* // set the stops to match the dates coming from time dimension
* timeSlider.stops = {
* dates: windDates
* };
* timeSlider.slot = "bottom-right";
* });
* ```
*
* To display data based on a specific slice of a variable and dimensions, set the layer's [multidimensionalDefinition](https://developers.arcgis.com/javascript/latest/references/core/layers/ImageryTileLayer/#multidimensionalDefinition)
* property to an array of desired [dimensional definitions](https://developers.arcgis.com/javascript/latest/references/core/layers/support/DimensionalDefinition/). For example, the following snippet
* shows how to update the layer's `multidimensionalDefinition` to display data based on a given `StdZ` (depth) value in response to a slider thumb change event.
*
* ```js
* depthSlider.on(["thumb-change", "thumb-drag"], (delta) => updateRenderer("StdZ", value));
* const updateRenderer = promiseUtils.debounce(function (dimensionName, sliderData) {
* // set the depth or StdZ dimension of the layer corresponding to the slider's thumb location
* const multidimensionalDefinition = layer.multidimensionalDefinition;
* const depthDef = multidimensionalDefinition.find((def) => def.dimensionName === "StdZ");
* if (dimensionName === "StdZ") {
* if (depthDef.values[0] === sliderData.value) {
* return;
* }
* depthDef.values[0] = sliderData.value;
* }
* layer.multidimensionalDefinition = multidimensionalDefinition;
* });
* ```
*
* The [multidimensionalSubset](https://developers.arcgis.com/javascript/latest/references/core/layers/ImageryTileLayer/#multidimensionalSubset) can be set on a layer to expose only a subset of multidimensional data that satisfies the requirements.
* For example, if you have one year of wind speed and direction data collected daily, but only want to expose a subset of the data for every day of October, then
* you can set the `multidimensionalSubset` property on the layer as shown in the code snippet below.
*
* ```js
* // Wind speed and direction info for every day of Oct will be available on the layer.
* // Users will not be able to access data that falls outside of Oct.
* const multidimensionalSubset = new MultidimensionalSubset({
* subsetDefinitions: [
* {
* variableName: "wind_magdir",
* dimensionName: "StdTime",
* values: [1317427200000, 1320019200000], // 10/1/14 - 10/31/14
* isSlice: true
* }
* ]
* });
* layer.multidimensionalSubset = multidimensionalSubset;
* ```
*
* The following image illustrates when the `multidimensionalDefinition` and `multidimensionalSubset` properties are both set on the layer. Slices with the
* purple borders are slices included in the layer's `multidimensionalSubset`. The slice with the red border is the `multidimensionalDefinition` of the layer and
* what is visible on the map. The layer's `multidimensionalDefinition` must fall within the `multidimensionalSubset`, otherwise nothing will be displayed in the map.
*
* [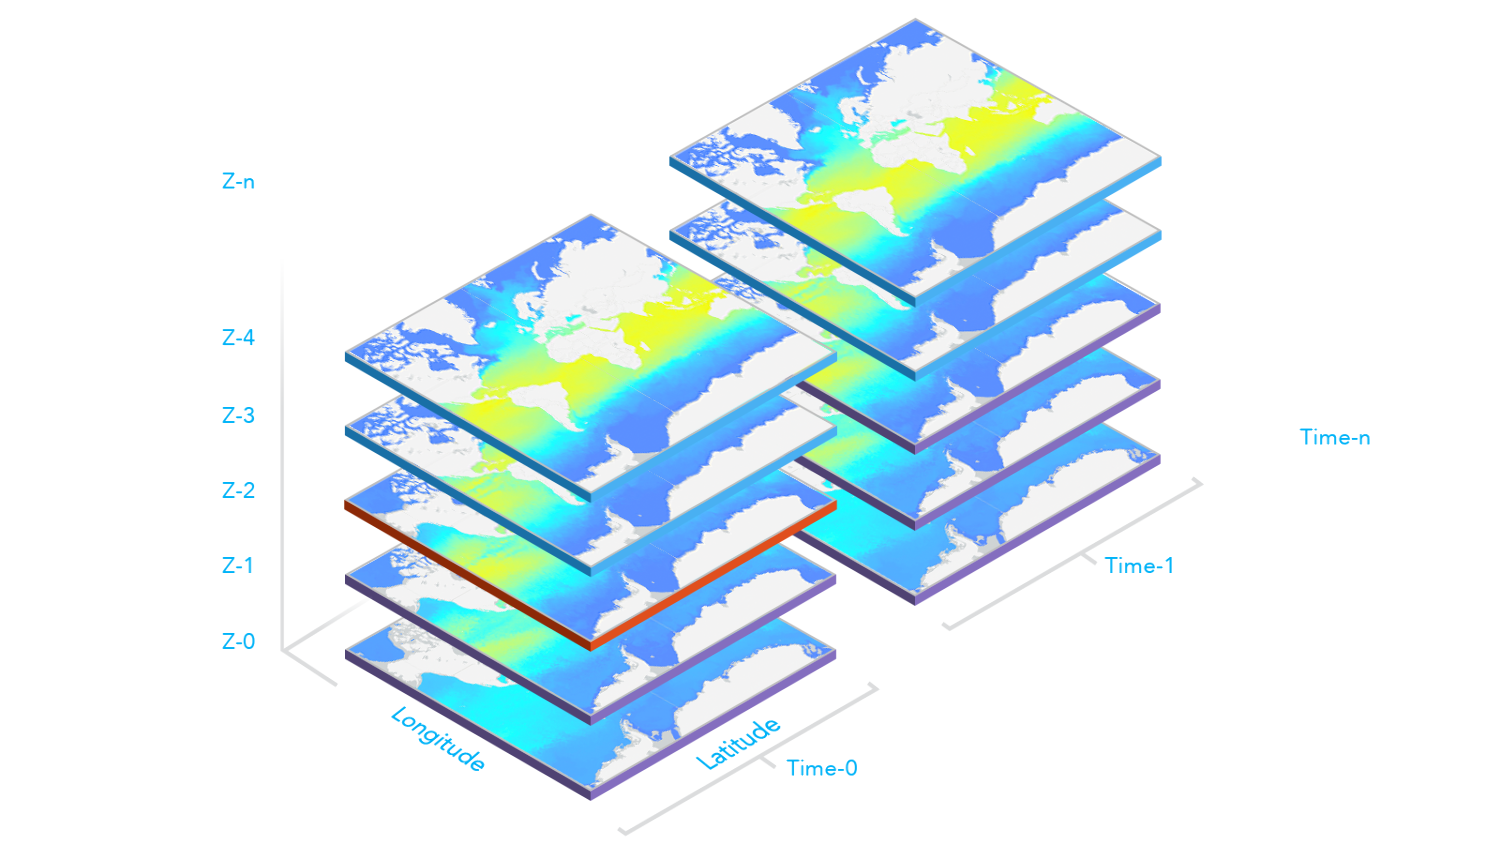](https://developers.arcgis.com/javascript/latest/sample-code/layers-imagery-multidimensional/)
*
* </details>
*
* @since 4.16
* @see [Sample - Intro to ImageryTileLayer](https://developers.arcgis.com/javascript/latest/sample-code/layers-imagerytilelayer/)
* @see [Sample - ImageryTileLayer - shaded relief renderer](https://developers.arcgis.com/javascript/latest/sample-code/layers-imagery-renderer/)
* @see [Sample - Transposed multidimensional ImageryTileLayer](https://developers.arcgis.com/javascript/latest/sample-code/layers-hosted-imagerytilelayer/)
* @see [Sample - Multidimensional ImageryTileLayer](https://developers.arcgis.com/javascript/latest/sample-code/layers-imagery-multidimensional/)
* @see [Cached image services](https://developers.arcgis.com/rest/services-reference/image-tile.htm)
*/
export default class ImageryTileLayer extends ImageryTileLayerSuperclass {
/**
* @example
* // Typical usage
* let layer = new ImageryTileLayer({
* url: "https://sampleserver6.arcgisonline.com/arcgis/rest/services/Toronto/ImageServer"
* });
*/
constructor(properties?: ImageryTileLayerProperties);
/**
* Specifies how the imagery is placed on the vertical axis (z). This property may only be used
* in a [SceneView](https://developers.arcgis.com/javascript/latest/references/core/views/SceneView/). See the [ElevationInfo sample](https://developers.arcgis.com/javascript/latest/sample-code/scene-elevationinfo/)
* for an example of how this property may be used.
*
* > [!WARNING]
* >
* > The elevation info only affects [ImageryTileLayer](https://developers.arcgis.com/javascript/latest/references/core/layers/ImageryTileLayer/) if the `renderer` is set to [FlowRenderer](https://developers.arcgis.com/javascript/latest/references/core/renderers/FlowRenderer/) and applies `on-the-ground` mode if it is null.
* > The `relative-to-scene` mode does not affect [ImageryTileLayer](https://developers.arcgis.com/javascript/latest/references/core/layers/ImageryTileLayer/).
* > [ElevationInfo.featureExpressionInfo](https://developers.arcgis.com/javascript/latest/references/core/symbols/support/ElevationInfo/#featureExpressionInfo) is not supported when the elevation info is specified for this class.
* > If the elevation info is not specified, the effective elevation depends on the context and could vary per point.
*
* @since 4.34
*/
get elevationInfo(): ElevationInfo | null | undefined;
set elevationInfo(value: ElevationInfoProperties | null | undefined);
/**
* Indicates whether the layer will be included in the legend. When `false`, the layer will be excluded from the legend.
*
* @default true
*/
accessor legendEnabled: boolean;
/**
* Indicates whether to display popups when features in the layer are clicked.
*
* @default true
*/
accessor popupEnabled: boolean;
/**
* The popup template for the layer. When set on the layer, the popupTemplate
* allows users to access attributes and display their values using text and/or charts
* in the view's popup when a pixel is clicked.
* See [this sample](https://developers.arcgis.com/javascript/latest/sample-code/layers-imagery-popup/)
* for an example of how [PopupTemplate](https://developers.arcgis.com/javascript/latest/references/core/PopupTemplate/) interacts with an
* [ImageryTileLayer](https://developers.arcgis.com/javascript/latest/references/core/layers/ImageryTileLayer/).
*
* A default popup template is automatically used if no `popupTemplate` has been defined when
* [Popup.defaultPopupTemplateEnabled](https://developers.arcgis.com/javascript/latest/references/core/widgets/Popup/#defaultPopupTemplateEnabled)
* is set to `true`.
*
* @see [ImageryTileLayerView](https://developers.arcgis.com/javascript/latest/references/core/views/layers/ImageryTileLayerView/)
* @see [Raster pixel value fields](https://developers.arcgis.com/javascript/latest/references/core/layers/ImageryTileLayer/#rasterFields)
* @see [createPopupTemplate()](https://developers.arcgis.com/javascript/latest/references/core/layers/ImageryTileLayer/#createPopupTemplate)
* @see [SceneView.popup](https://developers.arcgis.com/javascript/latest/references/core/views/SceneView/#popup)
* @see [View2D.popup](https://developers.arcgis.com/javascript/latest/references/core/views/View2D/#popup)
*/
get popupTemplate(): PopupTemplate | null | undefined;
set popupTemplate(value: PopupTemplateProperties | null | undefined);
/**
* A complete list of fields that consists of service pixel value and vector fields. This list is used for layer's [popupTemplate](https://developers.arcgis.com/javascript/latest/references/core/layers/ImageryTileLayer/#popupTemplate).
*
* It is essential in many imagery workflows to show pixel values and related categorical information (if applicable) in a popup.
* To meet this requirement, there're additional raster fields used in image service popups, representing pixel values and corresponding attributes
* if the service has additional rasterAttributeTable resource. These raster fields are prefixed with `Raster.` to indicate that they are special fields and avoid
* any potential conflict with fields from service info.
*
* Below is a list of raster fields that return different types of pixel values and their descriptions.
*
* ##### Service pixel value
* The `Raster.ServicePixelValue` field returns a pixel value based on the layer's [rasterFunction](https://developers.arcgis.com/javascript/latest/references/core/layers/ImageryTileLayer/#rasterFunction) at the identifying location.
* The `Raster.ServicePixelValue.Raw` field returns a pixel value from the source at the identifying location without a raster function.
* These fields exist for all image services.
*
* ##### Vector fields
* The `Raster.Magnitude` and `Raster.Direction` fields return magnitude and direction values from a multidimensional dataset with a vector field.
*
* ##### Multidimensional fields
* **Since 4.32.** For multidimensional data, the `Raster.Variable` field returns current variable used by the layer.
* Additional dimension fields are used to return corresponding dimension values, e.g. `Raster.Dim.StdTime`, `Raster.Dim.StdZ`.
* When a dimension is ranged, there will be a corresponding maximum dimension value field.
* For instance, a multidimensional data record representing average sea temperature during 02/12/2025 and 02/13/2025.
* In this example, `Raster.Dim.StdTime` is 02/12/2025, `Raster.Dim.StdTime.Max` is 02/13/2025.
*
* @since 4.20
* @example
* layer.when(() => {
* // print out field names returned in layer.rasterFields
* layer.rasterFields.forEach((field) => {
* console.log(field.name);
* });
* });
*/
get rasterFields(): Field[];
/**
* The client-side raster functions are operations that apply processing directly to the source image pixels.
* The calculations are only applied to the source pixels that are visible in the map as you pan and zoom within the map.
*
* There are many of out-of-the-box raster functions that can be used for radiometric enhancement,
* data management, visualization, and analysis. These raster functions can be applied individually or combined to create function chains to be shared as
* raster function templates (RFTs). Refer to [Client-side raster function](https://ubatsukh.github.io/arcgis-js-api-demos/clientside-rasterfunctions/)
* app to see a list of client-side raster functions.
*
* Use helper functions from the [rasterFunctionUtils](https://developers.arcgis.com/javascript/latest/references/core/layers/support/rasterFunctionUtils/) module when creating raster functions that apply to ImageryTileLayers.
*
* The [rasterFunctionConstants](https://developers.arcgis.com/javascript/latest/references/core/layers/support/rasterFunctionConstants/) module provides constant values that can be used as parameters of different raster functions when
* setting the layer's `rasterFunction`.
*
* @beta
* @since 4.26
* @see [REST API Raster function objects](https://developers.arcgis.com/documentation/common-data-types/raster-function-objects.htm)
* @see [List of client-side raster function](https://ubatsukh.github.io/arcgis-js-api-demos/clientside-rasterfunctions/)
* @see [rasterFunctionConstants](https://developers.arcgis.com/javascript/latest/references/core/layers/support/rasterFunctionConstants/)
* @example
* // apply NDVI and colormap raster function to an imagery tile layer
* // use rasterFunctionUtils convenience methods to create raster functions
* const ndvi = rasterFunctionUtils.bandArithmeticNDVI({
* nirBandId: 4,
* redBandId: 3,
* scientificOutput: false
* });
*
* const colormap = rasterFunctionUtils.colormap({
* colorRampName: "NDVI3",
* raster: ndvi
* });
* layer.rasterFunction = colormap;
* @example
* function createRasterFunction() {
* // processed bands from the imagery tile layer
* const rasters = [weightedRoadDistance, weightedProtectedStatus, weightedTerrainRuggedness, weightedLandCover, 0.25];
* const sumFunction = new RasterFunction({
* functionName: "Local",
* functionArguments: {
* operation: rasterFunctionTypes.cellStatisticalOperation.sum,
* rasters
* },
* outputPixelType: "u8"
* });
*
* const colormapFunction = new RasterFunction({
* functionName: "Colormap",
* functionArguments: {
* colormap: [[0, 0, 0, 255], [1, 56, 168, 0], [2, 141, 212, 0], [3, 255, 255, 0], [4, 255, 128, 0], [5, 255, 0, 0]],
* raster: sumFunction
* },
* outputPixelType: "u8"
* });
* return colormapFunction;
* }
*
* // clear renderer to use the default renderer for the new function
* layer.renderer = null;
* layer.rasterFunction = createRasterFunction();
*/
get rasterFunction(): RasterFunction | null | undefined;
set rasterFunction(value: RasterFunctionProperties | null | undefined);
/**
* The client-side renderer assigned to the layer. The renderer defines how to visualize pixels in the tile imagery layer.
* Depending on the renderer type, the pixels may be [stretched](https://developers.arcgis.com/javascript/latest/references/core/renderers/RasterStretchRenderer/)
* across the color ramp, [classified](https://developers.arcgis.com/javascript/latest/references/core/renderers/ClassBreaksRenderer/),
* have [different symbols](https://developers.arcgis.com/javascript/latest/references/core/renderers/UniqueValueRenderer/) based on values, or show [shaded reliefs](https://developers.arcgis.com/javascript/latest/references/core/renderers/RasterShadedReliefRenderer/).
*
* > [!WARNING]
* >
* > **Known Limitations**
* >
* > Currently, the [VectorFieldRenderer](https://developers.arcgis.com/javascript/latest/references/core/renderers/VectorFieldRenderer/) is not supported in 3D [SceneView](https://developers.arcgis.com/javascript/latest/references/core/views/SceneView/).
*
* @see [Sample - Intro to ImageryTileLayer](https://developers.arcgis.com/javascript/latest/sample-code/layers-imagerytilelayer/)
* @see [Sample - ImageryTileLayer - shaded relief renderer](https://developers.arcgis.com/javascript/latest/sample-code/layers-imagery-renderer/)
* @see [Sample - Transposed multidimensional ImageryTileLayer](https://developers.arcgis.com/javascript/latest/sample-code/layers-hosted-imagerytilelayer/)
* @see [Sample - FlowRenderer](https://developers.arcgis.com/javascript/latest/sample-code/layers-imagery-afrenderer/)
* @see [Sample - FlowRenderer with Blending and Effects](https://developers.arcgis.com/javascript/latest/sample-code/layers-imagery-afrenderer-blending/)
* @see [Sample - FlowRenderer in a 3D scene](https://developers.arcgis.com/javascript/latest/sample-code/layers-imagerytilelayer-flow-3d-global/)
* @see [Sample - FlowRenderer with elevation modes](https://developers.arcgis.com/javascript/latest/sample-code/layers-imagerytilelayer-flow-3d-local/)
* @see [Sample - Intro to ImageryTileLayer](https://developers.arcgis.com/javascript/latest/sample-code/layers-imagerytilelayer/)
* @see [Sample - ImageryTileLayer - shaded relief renderer](https://developers.arcgis.com/javascript/latest/sample-code/layers-imagery-renderer/)
* @see [Sample - Transposed multidimensional ImageryTileLayer](https://developers.arcgis.com/javascript/latest/sample-code/layers-hosted-imagerytilelayer/)
*/
get renderer(): RasterRendererUnion | null | undefined;
set renderer(value: (ClassBreaksRendererProperties & { type: "class-breaks"; }) | (UniqueValueRendererProperties & { type: "unique-value"; }) | (RasterStretchRendererProperties & { type: "raster-stretch"; }) | (RasterShadedReliefRendererProperties & { type: "raster-shaded-relief"; }) | (RasterColormapRendererProperties & { type: "raster-colormap"; }) | (VectorFieldRendererProperties & { type: "vector-field"; }) | (FlowRendererProperties & { type: "flow"; }) | null | undefined);
/**
* Apply perspective scaling to screen-size symbols in a [SceneView](https://developers.arcgis.com/javascript/latest/references/core/views/SceneView/).
* When `true`, screen sized objects such as streamlines from a [FlowRenderer](https://developers.arcgis.com/javascript/latest/references/core/renderers/FlowRenderer/)
* integrate better in the 3D scene by applying a certain perspective projection to the size.
* This only applies when using a [SceneView](https://developers.arcgis.com/javascript/latest/references/core/views/SceneView/).
*
* > [!WARNING]
* >
* > **Known Limitations**
* >
* > Screen size perspective is currently not optimized for situations where the camera is very near the ground, or for
* > scenes with visual elements located far from the ground surface. In these cases it may be better to turn off
* > screen size perspective.
*
* @default true
* @since 4.34
*/
accessor screenSizePerspectiveEnabled: boolean;
/**
* The data source for client-side ImageryTileLayer can be a [coverage JSON](https://www.ogc.org/standard/coveragejson/) object
* or [PixelData](https://developers.arcgis.com/javascript/latest/references/core/layers/raster/types/#PixelData). Once the layer is loaded, the data source is stored in memory.
* See [Creating ImageryTileLayer from CoverageJSON](https://developers.arcgis.com/javascript/latest/references/core/layers/ImageryTileLayer/#creating-from-covjson) section for more information.
*
* @since 4.29
* @see [Creating ImageryTileLayer from CoverageJSON](https://developers.arcgis.com/javascript/latest/references/core/layers/ImageryTileLayer/#creating-from-covjson)
*/
get source(): PixelData | null | undefined;
/**
* The [tiled image service's metadata JSON](https://developers.arcgis.com/rest/services-reference/image-service.htm)
* exposed by the ArcGIS REST API. While most commonly used properties
* are exposed on the ImageryTileLayer class directly, this property gives access to all information returned
* by the tiled image service. This property is useful if working in an application built using an older version of the API
* which requires access to image service properties from a more recent version.
*
* @since 4.16
*/
accessor sourceJSON: Record<string, any>;
/** The tiling scheme information for the layer. */
get tileInfo(): TileInfo | null | undefined;
set tileInfo(value: TileInfoProperties | null | undefined);
/**
* The title of the layer used to identify it in places such as the [Legend](https://developers.arcgis.com/javascript/latest/references/map-components/components/arcgis-legend/)
* and [Layer List](https://developers.arcgis.com/javascript/latest/references/map-components/components/arcgis-layer-list/).
*
* When loading a layer by service url, the title is derived from the service name.
* If the service has several layers, then the title of each layer will be the concatenation of the service name
* and the layer name.
* When the layer is loaded from a portal item, the title of the portal item will be used instead.
* Finally, if a layer is loaded as part of a webmap or a webscene, then the title of the layer as stored in the webmap/webscene will be used.
*/
accessor title: string | null | undefined;
/** The layer type provides a convenient way to check the type of the layer without the need to import specific layer modules. */
get type(): "imagery-tile";
/**
* The URL of the REST endpoint of the layer. The URL may either point to a resource on ArcGIS Enterprise or ArcGIS Online.
*
* Release specific changes:
* * At version 4.25, an ImageryTileLayer can be created by setting the [url](https://developers.arcgis.com/javascript/latest/references/core/layers/ImageryTileLayer/#url) property to point to a [Cloud Optimized GeoTIFF](https://www.cogeo.org/)
* (COG) file. See [Referencing Cloud Optimized GeoTiff URL](https://developers.arcgis.com/javascript/latest/references/core/layers/ImageryTileLayer/#adding-cog) section for more information.
* * At version 4.29, an ImageryTileLayer can be created by setting the [url](https://developers.arcgis.com/javascript/latest/references/core/layers/ImageryTileLayer/#url) property to point to a [coverage json](https://docs.ogc.org/cs/21-069r2/21-069r2.html#_b8b17e78-0147-4b58-8ade-a19465b57abc)
* file.
*
* @see [Referencing Cloud Optimized GeoTiff URL](https://developers.arcgis.com/javascript/latest/references/core/layers/ImageryTileLayer/#adding-cog)
* @see [Creating ImageryTileLayer from CoverageJSON](https://developers.arcgis.com/javascript/latest/references/core/layers/ImageryTileLayer/#creating-from-covjson)
*/
url: string;
/**
* The version of ArcGIS Server in which the image service is published.
*
* @example
* // Prints the version number to the console - e.g. 10.91, 11.2, 11.3
* console.log(layer.version);
*/
get version(): number | null | undefined;
/**
* Computes [statistics](https://developers.arcgis.com/javascript/latest/references/core/layers/raster/types/#RasterBandStatistics) and [histograms](https://developers.arcgis.com/javascript/latest/references/core/layers/raster/types/#RasterHistogram)
* for the provided [ImageHistogramParameters](https://developers.arcgis.com/javascript/latest/references/core/rest/support/ImageHistogramParameters/).
* Only [ImageHistogramParameters.geometry](https://developers.arcgis.com/javascript/latest/references/core/rest/support/ImageHistogramParameters/#geometry) and a
* [ImageHistogramParameters.pixelSize](https://developers.arcgis.com/javascript/latest/references/core/rest/support/ImageHistogramParameters/#pixelSize) parameters are supported for ImageryTileLayer.
*
* The result of this operation contains both statistics and histograms computed for the given extent or polygon.
* Note that the given extent or polygon is first projected to the spatial reference of the service, then the source pixels are requested at the specified
* resolution for the projected geometry's extent. The statistics and histogram are then computed based on the source pixel's values.
*
* @param parameters - Specifies parameters for computing statistics and histograms.
* @param requestOptions - Additional [options](https://developers.arcgis.com/javascript/latest/references/core/request/#request) to be used for the data request
* (will ov