@arcgis/core
Version:
ArcGIS Maps SDK for JavaScript: A complete 2D and 3D mapping and data visualization API
367 lines (364 loc) • 25 kB
TypeScript
import type PopupTemplate from "../PopupTemplate.js";
import type Layer from "./Layer.js";
import type PortalItem from "../portal/PortalItem.js";
import type ElevationInfo from "../symbols/support/ElevationInfo.js";
import type { ClonableMixin } from "../core/Clonable.js";
import type { MultiOriginJSONSupportMixin } from "../core/MultiOriginJSONSupport.js";
import type { LayerEvents, LayerProperties } from "./Layer.js";
import type { LayerSaveAsOptions, LayerSaveOptions } from "./types.js";
import type { ArcGISImageService, ArcGISImageServiceProperties } from "./mixins/ArcGISImageService.js";
import type { BlendLayer, BlendLayerProperties } from "./mixins/BlendLayer.js";
import type { CustomParametersMixin, CustomParametersMixinProperties } from "./mixins/CustomParametersMixin.js";
import type { OperationalLayer, OperationalLayerProperties } from "./mixins/OperationalLayer.js";
import type { PortalLayer, PortalLayerProperties } from "./mixins/PortalLayer.js";
import type { RasterPresetRendererMixin, RasterPresetRendererMixinProperties } from "./mixins/RasterPresetRendererMixin.js";
import type { RefreshableLayerEvents, RefreshableLayer, RefreshableLayerProperties } from "./mixins/RefreshableLayer.js";
import type { ScaleRangeLayer, ScaleRangeLayerProperties } from "./mixins/ScaleRangeLayer.js";
import type { TemporalLayer, TemporalLayerProperties } from "./mixins/TemporalLayer.js";
import type { PortalItemProperties } from "../portal/PortalItem.js";
import type { CreatePopupTemplateOptions } from "../support/popupUtils.js";
import type { ElevationInfoProperties } from "../symbols/support/ElevationInfo.js";
import type { PopupTemplateProperties } from "../PopupTemplate.js";
export interface ImageryLayerProperties extends LayerProperties, CustomParametersMixinProperties, RefreshableLayerProperties, ArcGISImageServiceProperties, RasterPresetRendererMixinProperties, PortalLayerProperties, OperationalLayerProperties, ScaleRangeLayerProperties, TemporalLayerProperties, BlendLayerProperties, Partial<Pick<ImageryLayer, "legendEnabled" | "popupEnabled" | "screenSizePerspectiveEnabled">> {
/**
* Specifies how the imagery is placed on the vertical axis (z). This property may only be used
* in a [SceneView](https://developers.arcgis.com/javascript/latest/references/core/views/SceneView/). See the [ElevationInfo sample](https://developers.arcgis.com/javascript/latest/sample-code/scene-elevationinfo/)
* for an example of how this property may be used.
*
* > [!WARNING]
* >
* > The elevation info only affects [ImageryLayer](https://developers.arcgis.com/javascript/latest/references/core/layers/ImageryLayer/) if the `renderer` is set to [FlowRenderer](https://developers.arcgis.com/javascript/latest/references/core/renderers/FlowRenderer/) and applies `on-the-ground` mode if it is null.
* > The `relative-to-scene` mode does not affect [ImageryLayer](https://developers.arcgis.com/javascript/latest/references/core/layers/ImageryLayer/).
* > [ElevationInfo.featureExpressionInfo](https://developers.arcgis.com/javascript/latest/references/core/symbols/support/ElevationInfo/#featureExpressionInfo) is not supported when the elevation info is specified for this class.
* > If the elevation info is not specified, the effective elevation depends on the context and could vary per point.
*
* @since 4.34
*/
elevationInfo?: ElevationInfoProperties | null;
/**
* The popup template for the layer. When set on the layer, the popupTemplate
* allows users to access attributes and display their values using text and/or charts
* in the view's popup when a pixel is clicked.
* See [this sample](https://developers.arcgis.com/javascript/latest/sample-code/layers-imagery-popup/)
* for an example of how [PopupTemplate](https://developers.arcgis.com/javascript/latest/references/core/PopupTemplate/) interacts with an
* [ImageryLayer](https://developers.arcgis.com/javascript/latest/references/core/layers/ImageryLayer/).
*
* A default popup template is automatically used if no `popupTemplate` has been defined when
* [Popup.defaultPopupTemplateEnabled](https://developers.arcgis.com/javascript/latest/references/core/widgets/Popup/#defaultPopupTemplateEnabled)
* is set to `true`.
*
* @see [createPopupTemplate()](https://developers.arcgis.com/javascript/latest/references/core/layers/ImageryLayer/#createPopupTemplate)
* @see [SceneView.popup](https://developers.arcgis.com/javascript/latest/references/core/views/SceneView/#popup)
* @see [View2D.popup](https://developers.arcgis.com/javascript/latest/references/core/views/View2D/#popup)
* @example
* // displays the temperature stored in the clicked pixel
* layer.popupTemplate = {
* title: "Sea Surface Temperature",
* content: "{Raster.ServicePixelValue}° Celsius"
* }
*/
popupTemplate?: PopupTemplateProperties | null;
}
export interface ImageryLayerEvents extends RefreshableLayerEvents, LayerEvents {}
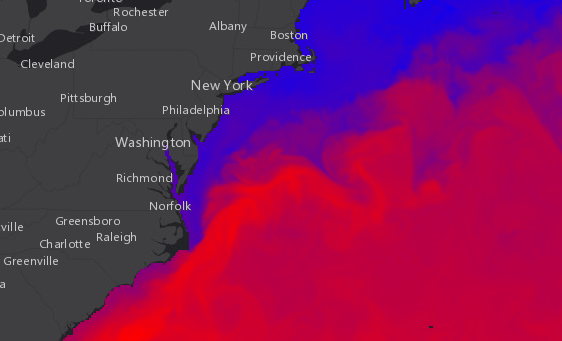
/**
* Represents a dynamic [image service resource](https://developers.arcgis.com/rest/services-reference/image-service.htm)
* as a layer. An ImageryLayer retrieves and displays data from dynamic image services.
* An image service supports accessing the mosaicked image, its catalog, and the individual
* rasters in the catalog. An image service supports dynamic access and tiled access. Dynamic access provides more functionalities,
* and tiled access provides faster and more scalable access to precooked tiles.
*
* [](https://developers.arcgis.com/javascript/latest/sample-code/layers-imagery-pixelvalues/)
*
* If the image service is requested from a different domain, a [CORS enabled server](https://developers.arcgis.com/javascript/latest/cors/) or a
* [proxy](https://developers.arcgis.com/javascript/latest/proxies/) is required.
*
* > [!WARNING]
* >
* > Esri requires that when you use an ArcGIS Online basemap in your app, the map must include Esri attribution and you must be licensed to use the content.
* > For detailed guidelines on working with attribution, please visit the official [attribution in your app](https://developers.arcgis.com/terms/attribution/) documentation.
* > For information, see the [Terms of Use documentation](https://developers.arcgis.com/documentation/terms-of-use/).
*
* <span id="rendering"></span>
* ### ImageryLayer rendering
*
* ImageryLayer can be rendered on the server or on the client. This section talks about different approaches you can take when rendering
* an ImageryLayer in your application.
*
* <details>
* <summary>Read More</summary>
*
* #### Applying rasterFunction
*
* Image service supports dynamic processing which can be applied through the layer's [rasterFunction](https://developers.arcgis.com/javascript/latest/references/core/layers/ImageryLayer/#rasterFunction) property.
* A raster function defines how the requested image should be processed or rendered. You can process images using raster functions
* published with the image service. You can also use well-known raster functions, such as the
* [hillshade function](https://developers.arcgis.com/documentation/common-data-types/raster-function-objects.htm) for elevation data,
* the [stretch function](https://developers.arcgis.com/documentation/common-data-types/raster-function-objects.htm) for multispectral
* data, and the [colormap function](https://developers.arcgis.com/documentation/common-data-types/raster-function-objects.htm)
* for thematic data. When rasterFunction is applied to the layer, the network request is made to the server for the image to be processed.
*
* #### Applying renderer
*
* ImageryLayer supports various [renderers](https://developers.arcgis.com/javascript/latest/references/core/layers/ImageryLayer/#renderer). By default, an ImageryLayer uses server side rendering. ImageryLayer
* parses a renderer specified by a user and leverages a [rasterFunction](https://developers.arcgis.com/javascript/latest/references/core/layers/ImageryLayer/#rasterFunction) specified by the server or the user to achieve the
* expected rendering for the images. The server processes and renders the ImageryLayer and returns a ready-to-draw `jpg` or `png` image
* to the client.
*
* When an ImageryLayer is created with `lerc` [format](https://developers.arcgis.com/javascript/latest/references/core/layers/ImageryLayer/#format), the client gets access to the raw data which
* can be used for client-side analysis and rendering. A default renderer that leverages available imagery information
* is applied to an ImageryLayer with `lerc` format if the [pixelFilter](https://developers.arcgis.com/javascript/latest/references/core/layers/ImageryLayer/#pixelFilter) function is not specified.
* The user can change this default renderer on the client-side by applying a [renderer](https://developers.arcgis.com/javascript/latest/references/core/layers/ImageryLayer/#renderer) or [pixelFilter](https://developers.arcgis.com/javascript/latest/references/core/layers/ImageryLayer/#pixelFilter).
* The [pixelFilter](https://developers.arcgis.com/javascript/latest/references/core/layers/ImageryLayer/#pixelFilter) is a good alternative if the existing renderers do not meet your requirements. If both
* `renderer` and `pixelFilter` are applied to the layer then the `pixelFilter` will take priority and its logic will be applied.
*
* #### Applying pixelFilter
*
* The [pixelFilter](https://developers.arcgis.com/javascript/latest/references/core/layers/ImageryLayer/#pixelFilter) can be used to colorize raw image pixels when ImageryLayer's [format](https://developers.arcgis.com/javascript/latest/references/core/layers/ImageryLayer/#format) is set to `lerc`.
* It is a function that processes the [ImageryLayerView.pixelData](https://developers.arcgis.com/javascript/latest/references/core/views/layers/ImageryLayerView/#pixelData).
* The `pixelData` object contains a [PixelBlock](https://developers.arcgis.com/javascript/latest/references/core/layers/support/PixelBlock/) property that gives
* you access to all of the pixels in the raster on the client. Inside the `pixelFilter` you may loop through all the pixels
* and process them. This function is a useful alternative if the existing renderers do not meet your requirements, because it gives you
* control over how to color image pixels. If both a [renderer](https://developers.arcgis.com/javascript/latest/references/core/layers/ImageryLayer/#renderer) and `pixelFilter` are applied to the layer then the
* `pixelFilter` will take priority and its logic will be applied.
*
* </details>
*
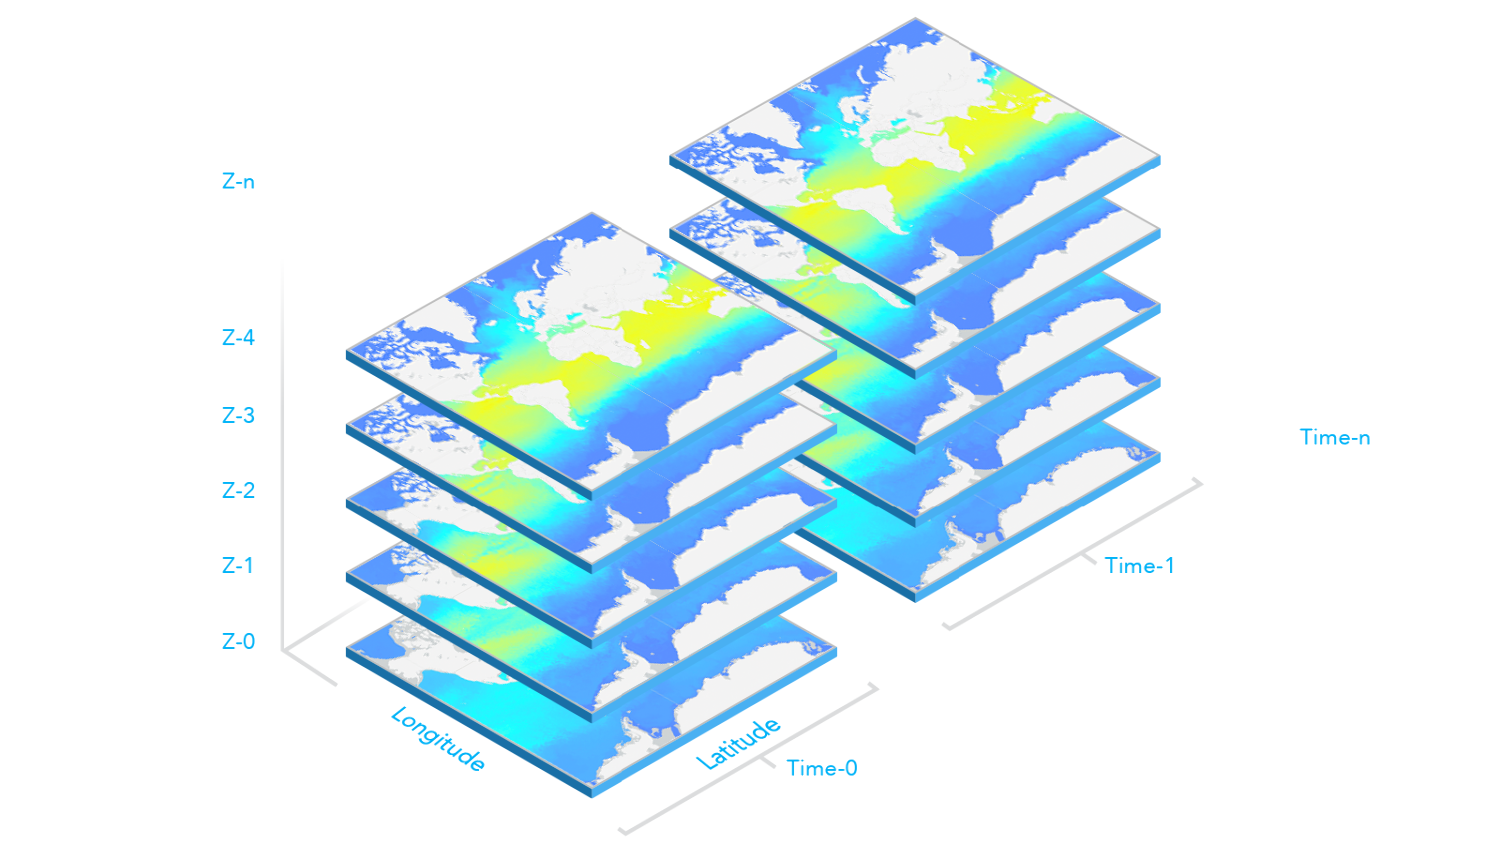
* <span id="multidimensionaldata"></span>
* ### Working with multidimensional raster data
* Multidimensional data is commonly used in the scientific community to store atmospheric, oceanographic, and earth science data. Temperature, humidity, wind speed, and direction
* are all examples of the data that can be stored as variables in a multidimensional array.
* As illustrated in the graphic below, multidimensional data can show sea temperature (variable) for a specific area at multiple time and depth dimensions.
* This information is stored as slices, where the service has a slice for each unique combination of dimension values and variable names.
*
* [](https://developers.arcgis.com/javascript/latest/sample-code/layers-hosted-imagerytilelayer/)
*
* <details>
* <summary>Read More</summary>
*
* ImageryLayer's multidimensional data information can be accessed through the layer's [multidimensionalInfo](https://developers.arcgis.com/javascript/latest/references/core/layers/ImageryLayer/#multidimensionalInfo) property. This
* information can then be used for analysis and visualization. For example, in the following snippet, the time dimension values associated with
* the `wind_magdir` variable are read from the layer's `multidimensionalInfo` property once the layer is loaded. Then time values are used to configure
* the [TimeSlider](https://developers.arcgis.com/javascript/latest/references/core/widgets/TimeSlider/) widget to animate the wind speed and direction data over time.
*
* ```js
* view.whenLayerView(layer).then(() => {
* // get all time dimension values from the service, create an array of dates
* const windEpochDates = layer.multidimensionalInfo.variables[0].dimensions[0].values;
* const windDates = windEpochDates.map((item) => new Date(item));
*
* // time slider widget initialization
* // users can visualize daily wind information for all the time dimension available
* const timeSlider = new TimeSlider({
* mode: "instant",
* view: view,
* fullTimeExtent: {
* start: new Date(windDates[0]), // Jan 1, 2011,
* end: new Date(windDates[windDates.length - 1]) // Dec 31, 2011
* },
* // set the stops to match the dates coming from time dimension
* stops: {
* dates: windDates
* }
* });
* });
* ```
*
* To display the data based on a specified slice of a variable and dimensions, set the layer's [mosaicRule.multidimensionalDefinition](https://developers.arcgis.com/javascript/latest/references/core/layers/ImageryLayer/#mosaicRule)
* property to an array of desired [dimensional definitions](https://developers.arcgis.com/javascript/latest/references/core/layers/support/DimensionalDefinition/). For example, the following snippet
* shows how to update the layer's `mosaicRule.multidimensionalDefinition` to display the data based on a given `StdZ` (depth) value in response to a slider thumb change event.
*
* ```js
* depthSlider.on(["thumb-change", "thumb-drag"], (delta) => updateRenderer("StdZ", value));
* const updateRenderer = promiseUtils.debounce(function (dimensionName, sliderData) {
* // set the depth or StdZ dimension of the layer corresponding to the slider's thumb location
* const multidimensionalDefinition = layer.mosaicRule.multidimensionalDefinition;
* const depthDef = multidimensionalDefinition.find((def) => def.dimensionName === "StdZ");
* if (dimensionName === "StdZ") {
* if (depthDef.values[0] === sliderData.value) {
* return;
* }
* depthDef.values[0] = sliderData.value;
* }
* layer.mosaicRule.multidimensionalDefinition = multidimensionalDefinition;
* });
* ```
*
* The [multidimensionalSubset](https://developers.arcgis.com/javascript/latest/references/core/layers/ImageryLayer/#multidimensionalSubset) can be set on a layer to expose only a subset of multidimensional data that satisfies the requirements.
* For example, if you have one year of wind speed and direction data collected daily, but only want to expose a subset of the data for every day of October, then
* you can set the `multidimensionalSubset` property on the layer as shown in the code snippet below.
*
* ```js
* // Wind speed and direction info for every day of Oct will be available on the layer.
* // Users will not be able to access data that falls outside of Oct.
* // Only the data intersects the extent will be available to users.
* const multidimensionalSubset = new MultidimensionalSubset({
* // extent covering california
* areaOfInterest: new Extent({
* xmax: -12195369.680716056,
* xmin: -14166833.514246799,
* ymax: 5336486.804891889,
* ymin: 3047044.933694898,
* spatialReference: {
* wkid: 102100
* }
* }),
* subsetDefinitions: [
* {
* variableName: "Vector-MagDir",
* dimensionName: "StdTime",
* values: [1412121600000, 1414713600000], // 10/1/14 - 10/31/14
* isSlice: false
* }
* ]
* });
* layer.multidimensionalSubset = multidimensionalSubset;
* ```
*
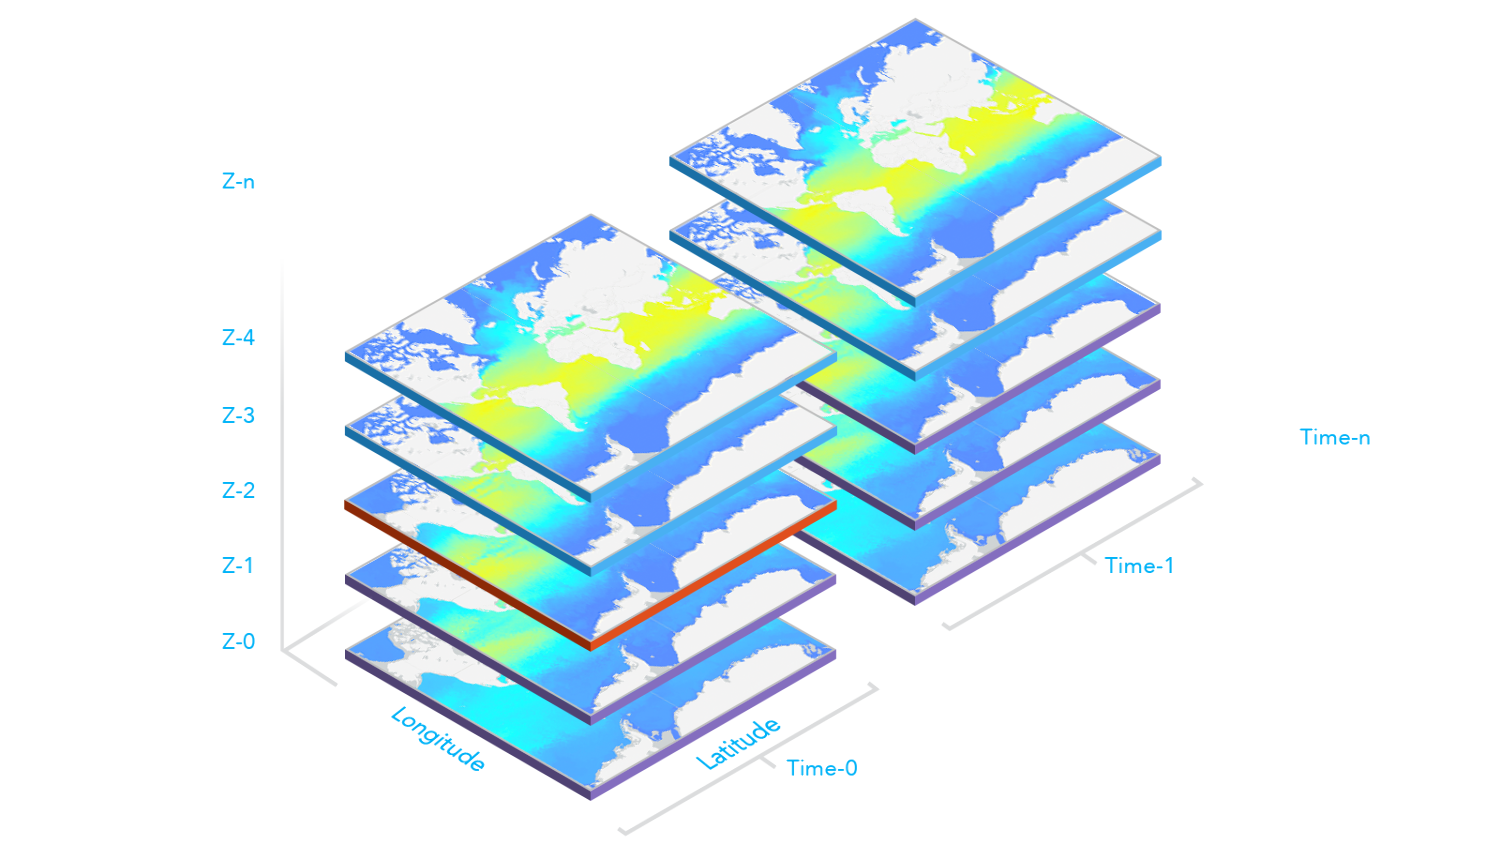
* The following image illustrates when the `multidimensionalDefinition` and `multidimensionalSubset` properties are both set on the layer. Slices with the
* purple borders are slices included in the layer's `multidimensionalSubset`. The slice with the red border is the `multidimensionalDefinition` of the layer and
* what is visible on the map. The layer's `multidimensionalDefinition` must fall within the `multidimensionalSubset`, otherwise nothing will be displayed in the map.
*
* [](https://developers.arcgis.com/javascript/latest/sample-code/layers-imagery-multidimensional/)
*
* </details>
*
* @since 4.0
* @see [ImageryLayerView](https://developers.arcgis.com/javascript/latest/references/core/views/layers/ImageryLayerView/)
* @see [Sample - Add an ImageryLayer to a map](https://developers.arcgis.com/javascript/latest/sample-code/layers-imagerylayer/)
* @see [Sample - Work with pixelFilter in an ImageryLayer](https://developers.arcgis.com/javascript/latest/sample-code/layers-imagery-pixelvalues/)
* @see [Sample - Set a server side raster function](https://developers.arcgis.com/javascript/latest/sample-code/layers-imagery-popup/)
* @see [Sample - ImageryLayer raster function](https://developers.arcgis.com/javascript/latest/sample-code/layers-imagery-rasterfunction/)
* @see [Sample - Raster attribute table](https://developers.arcgis.com/javascript/latest/sample-code/layers-imagery-attribute-table/)
* @see [Sample - Image coordinate system](https://developers.arcgis.com/javascript/latest/sample-code/layers-imagery-coordinatesystem/)
*/
export default class ImageryLayer extends ImageryLayerSuperclass {
/**
* @deprecated
* Do not directly reference this property.
* Use EventNames and EventTypes helpers from \@arcgis/core/Evented
*/
"@eventTypes": ImageryLayerEvents;
/**
* @example
* // Typical usage
* let layer = new ImageryLayer({
* // URL to the imagery service
* url: "https://landsat2.arcgis.com/arcgis/rest/services/Landsat8_Views/ImageServer"
* });
*/
constructor(properties?: ImageryLayerProperties);
/**
* Specifies how the imagery is placed on the vertical axis (z). This property may only be used
* in a [SceneView](https://developers.arcgis.com/javascript/latest/references/core/views/SceneView/). See the [ElevationInfo sample](https://developers.arcgis.com/javascript/latest/sample-code/scene-elevationinfo/)
* for an example of how this property may be used.
*
* > [!WARNING]
* >
* > The elevation info only affects [ImageryLayer](https://developers.arcgis.com/javascript/latest/references/core/layers/ImageryLayer/) if the `renderer` is set to [FlowRenderer](https://developers.arcgis.com/javascript/latest/references/core/renderers/FlowRenderer/) and applies `on-the-ground` mode if it is null.
* > The `relative-to-scene` mode does not affect [ImageryLayer](https://developers.arcgis.com/javascript/latest/references/core/layers/ImageryLayer/).
* > [ElevationInfo.featureExpressionInfo](https://developers.arcgis.com/javascript/latest/references/core/symbols/support/ElevationInfo/#featureExpressionInfo) is not supported when the elevation info is specified for this class.
* > If the elevation info is not specified, the effective elevation depends on the context and could vary per point.
*
* @since 4.34
*/
get elevationInfo(): ElevationInfo | null | undefined;
set elevationInfo(value: ElevationInfoProperties | null | undefined);
/**
* Indicates whether the layer will be included in the legend.
*
* @default true
* @since 4.12
*/
accessor legendEnabled: boolean;
/**
* Indicates whether to display popups when features in the layer are clicked.
*
* @default true
*/
accessor popupEnabled: boolean;
/**
* The popup template for the layer. When set on the layer, the popupTemplate
* allows users to access attributes and display their values using text and/or charts
* in the view's popup when a pixel is clicked.
* See [this sample](https://developers.arcgis.com/javascript/latest/sample-code/layers-imagery-popup/)
* for an example of how [PopupTemplate](https://developers.arcgis.com/javascript/latest/references/core/PopupTemplate/) interacts with an
* [ImageryLayer](https://developers.arcgis.com/javascript/latest/references/core/layers/ImageryLayer/).
*
* A default popup template is automatically used if no `popupTemplate` has been defined when
* [Popup.defaultPopupTemplateEnabled](https://developers.arcgis.com/javascript/latest/references/core/widgets/Popup/#defaultPopupTemplateEnabled)
* is set to `true`.
*
* @see [createPopupTemplate()](https://developers.arcgis.com/javascript/latest/references/core/layers/ImageryLayer/#createPopupTemplate)
* @see [SceneView.popup](https://developers.arcgis.com/javascript/latest/references/core/views/SceneView/#popup)
* @see [View2D.popup](https://developers.arcgis.com/javascript/latest/references/core/views/View2D/#popup)
* @example
* // displays the temperature stored in the clicked pixel
* layer.popupTemplate = {
* title: "Sea Surface Temperature",
* content: "{Raster.ServicePixelValue}° Celsius"
* }
*/
get popupTemplate(): PopupTemplate | null | undefined;
set popupTemplate(value: PopupTemplateProperties | null | undefined);
/**
* Apply perspective scaling to screen-size symbols in a [SceneView](https://developers.arcgis.com/javascript/latest/references/core/views/SceneView/).
* When `true`, screen sized objects such as streamlines from a [FlowRenderer](https://developers.arcgis.com/javascript/latest/references/core/renderers/FlowRenderer/)
* integrate better in the 3D scene by applying a certain perspective projection to the size.
* This only applies when using a [SceneView](https://developers.arcgis.com/javascript/latest/references/core/views/SceneView/).
*
* > [!WARNING]
* >
* > **Known Limitations**
* >
* > Screen size perspective is currently not optimized for situations where the camera is very near the ground, or for
* > scenes with visual elements located far from the ground surface. In these cases it may be better to turn off
* > screen size perspective.
*
* @default true
* @since 4.34
*/
accessor screenSizePerspectiveEnabled: boolean;
/** The layer type provides a convenient way to check the type of the layer without the need to import specific layer modules. */
get type(): "imagery";
/**
* Creates a default popup template for the layer, populated with all the fields of the layer.
*
* @param options - Options for creating the popup template.
* @returns The popup template, or `null` if the layer does not
* have any fields.
* @since 4.11
*/
createPopupTemplate(options?: CreatePopupTemplateOptions): PopupTemplate | null | undefined;
/**
* Executes the [pixelFilter](https://developers.arcgis.com/javascript/latest/references/core/layers/ImageryLayer/#pixelFilter) function and redraws the layer.
*
* @example
* // function defined in layer.pixelFilter is re-executed
* layer.redraw();
*/
redraw(): void;
/**
* Saves the layer to its existing portal item in the [Portal](https://developers.arcgis.com/javascript/latest/references/core/portal/Portal/)
* authenticated within the user's current session. If the layer is not saved to a
* [PortalItem](https://developers.arcgis.com/javascript/latest/references/core/portal/PortalItem/), then you should use [saveAs()](https://developers.arcgis.com/javascript/latest/references/core/layers/ImageryLayer/#saveAs).
*
* @param options - Various options for saving the layer.
* @returns When resolved, returns the portal item to which the layer is saved.
* @since 4.28
* @example const portalItem = await layer.save();
*/
save(options?: LayerSaveOptions): Promise<PortalItem>;
/**
* Saves the layer to a new portal item in the [Portal](https://developers.arcgis.com/javascript/latest/references/core/portal/Portal/) authenticated within the user's current session.
*
* @param portalItem - The portal item to which the layer will be saved.
* @param options - Various options for saving the layer.
* @returns When resolved, returns the portal item to which the layer is saved.
* @since 4.28
* @example
* const portalItem = new PortalItem();
* await layer.saveAs(portalItem);
*/
saveAs(portalItem: PortalItemProperties, options?: LayerSaveAsOptions): Promise<PortalItem>;
}
declare const ImageryLayerSuperclass: typeof Layer & typeof ClonableMixin & typeof MultiOriginJSONSupportMixin & typeof CustomParametersMixin & typeof RefreshableLayer & typeof ArcGISImageService & typeof RasterPresetRendererMixin & typeof PortalLayer & typeof OperationalLayer & typeof ScaleRangeLayer & typeof TemporalLayer & typeof BlendLayer