@arcgis/core
Version:
ArcGIS Maps SDK for JavaScript: A complete 2D and 3D mapping and data visualization API
258 lines (255 loc) • 18.7 kB
TypeScript
import type Graphic from "../Graphic.js";
import type Collection from "../core/Collection.js";
import type Layer from "./Layer.js";
import type ElevationInfo from "../symbols/support/ElevationInfo.js";
import type { LayerEvents, LayerProperties } from "./Layer.js";
import type { BlendLayer, BlendLayerProperties } from "./mixins/BlendLayer.js";
import type { EditBusLayerEvents } from "./mixins/EditBusLayer.js";
import type { ScaleRangeLayer, ScaleRangeLayerProperties } from "./mixins/ScaleRangeLayer.js";
import type { ElevationInfoProperties } from "../symbols/support/ElevationInfo.js";
import type { GraphicProperties } from "../Graphic.js";
import type { ReadonlyArrayOrCollection } from "../core/Collection.js";
export interface GraphicsLayerProperties extends LayerProperties, ScaleRangeLayerProperties, BlendLayerProperties, Partial<Pick<GraphicsLayer, "screenSizePerspectiveEnabled">> {
/**
* Specifies how graphics are placed on the vertical axis (z). This property may only be used
* in a [SceneView](https://developers.arcgis.com/javascript/latest/references/core/views/SceneView/). See the [ElevationInfo sample](https://developers.arcgis.com/javascript/latest/sample-code/scene-elevationinfo/)
* for an example of how this property may be used.
*
* > [!WARNING]
* >
* > If the elevation info is not specified, the effective elevation depends on the context and could vary per graphic.
*/
elevationInfo?: ElevationInfoProperties | null;
/**
* A collection of [graphics](https://developers.arcgis.com/javascript/latest/references/core/Graphic/) in the layer.
* Each graphic is a vector representation of the location of a
* real-world feature. Each graphic in a single GraphicsLayer may contain either a
* [Point](https://developers.arcgis.com/javascript/latest/references/core/geometry/Point/), [Polyline](https://developers.arcgis.com/javascript/latest/references/core/geometry/Polyline/), or
* [Polygon](https://developers.arcgis.com/javascript/latest/references/core/geometry/Polygon/) [Graphic.geometry](https://developers.arcgis.com/javascript/latest/references/core/Graphic/#geometry). In addition, each
* [Graphic](https://developers.arcgis.com/javascript/latest/references/core/Graphic/) in the collection
* may contain its own [Graphic.attributes](https://developers.arcgis.com/javascript/latest/references/core/Graphic/#attributes),
* [Symbol](https://developers.arcgis.com/javascript/latest/references/core/symbols/Symbol/), and [PopupTemplate](https://developers.arcgis.com/javascript/latest/references/core/PopupTemplate/).
*
* To add a graphic to the GraphicsLayer use [add()](https://developers.arcgis.com/javascript/latest/references/core/layers/GraphicsLayer/#add),
* [GraphicsLayer.graphics.add()](https://developers.arcgis.com/javascript/latest/references/core/core/Collection/#add) or [GraphicsLayer.graphics.push()](https://developers.arcgis.com/javascript/latest/references/core/core/Collection/#push).
*
* @see [Graphic](https://developers.arcgis.com/javascript/latest/references/core/Graphic/)
* @example
* // Add graphics to GraphicsLayer directly as an array
* layer.graphics = [graphicA, graphicB];
*
* // Add graphics to layer via Collection
* layer.graphics.addMany([graphicC, graphicD]);
*
* // Add graphics to layer via Collection
* layer.graphics.push(graphicC, graphicD);
*/
graphics?: ReadonlyArrayOrCollection<GraphicProperties>;
}
export interface GraphicsLayerEvents extends EditBusLayerEvents, LayerEvents {}
/**
* A GraphicsLayer contains one or more client-side [Graphics](https://developers.arcgis.com/javascript/latest/references/core/Graphic/). Each
* [graphic](https://developers.arcgis.com/javascript/latest/references/core/layers/GraphicsLayer/#graphics) in the GraphicsLayer is rendered in a [LayerView](https://developers.arcgis.com/javascript/latest/references/core/views/layers/LayerView/)
* inside either a [SceneView](https://developers.arcgis.com/javascript/latest/references/core/views/SceneView/) or a [MapView](https://developers.arcgis.com/javascript/latest/references/core/views/MapView/).
* The [graphics](https://developers.arcgis.com/javascript/latest/references/core/layers/GraphicsLayer/#graphics) contain discrete vector [geometries](https://developers.arcgis.com/javascript/latest/references/core/geometry/Geometry/)
* that represent real-world phenomena.
*
* Unlike [FeatureLayer](https://developers.arcgis.com/javascript/latest/references/core/layers/FeatureLayer/) and [MapImageLayer](https://developers.arcgis.com/javascript/latest/references/core/layers/MapImageLayer/),
* a GraphicsLayer has no schema. Therefore, the
* graphics that compose a GraphicsLayer may be of more than one geometry type (either
* [points](https://developers.arcgis.com/javascript/latest/references/core/geometry/Point/), [lines](https://developers.arcgis.com/javascript/latest/references/core/geometry/Polyline/), or
* [polygons](https://developers.arcgis.com/javascript/latest/references/core/geometry/Polygon/)). Each graphic must have its own symbol since
* the GraphicsLayer cannot have an associated renderer.
* Graphics may also contain different attribute schema from one another.
*
* > [!WARNING]
* >
* > It is generally preferred to construct a [FeatureLayer](https://developers.arcgis.com/javascript/latest/references/core/layers/FeatureLayer/) with its
* > [FeatureLayer.source](https://developers.arcgis.com/javascript/latest/references/core/layers/FeatureLayer/#source) property when working with client-side
* > [graphics](https://developers.arcgis.com/javascript/latest/references/core/Graphic/). The FeatureLayer performs better with larger datasets and has more
* > capabilities, including rendering, querying, and labeling.
*
* Graphics can be added to an instance of GraphicsLayer in several ways. They may be added via the [add()](https://developers.arcgis.com/javascript/latest/references/core/layers/GraphicsLayer/#add)
* method, directly on the [graphics](https://developers.arcgis.com/javascript/latest/references/core/layers/GraphicsLayer/#graphics) property in the constructor, or after the instance is
* created. Use [Map.add()](https://developers.arcgis.com/javascript/latest/references/core/Map/#add) to add a GraphicsLayer to a [Map](https://developers.arcgis.com/javascript/latest/references/core/Map/) instance.
*
* ```js
* const [GraphicsLayer, Graphic] = await $arcgis.import([
* "@arcgis/core/layers/GraphicsLayer.js",
* "@arcgis/core/Graphic.js"
* ]);
* // Create graphics
* let graphicA = new Graphic({ // graphic with line geometry
* geometry: new Polyline({...}), // set geometry here
* symbol: new SimpleLineSymbol({...}) // set symbol here
* });
* let graphicB = new Graphic({ // graphic with point geometry
* geometry: new Point({...}), // set geometry here
* symbol: new SimpleMarkerSymbol({...}) // set symbol here
* });
* let graphicC = new Graphic({ // graphic with polygon geometry
* geometry: new Polygon({...}), // set geometry here
* symbol: new SimpleFillSymbol({...}) // set symbol here
* });
* let graphicD = new Graphic();
* let graphicE = new Graphic();
*
* // Add graphic when GraphicsLayer is constructed
* let layer = new GraphicsLayer({
* graphics: [graphicA]
* });
*
* // Add graphic to graphics collection
* layer.graphics.add(graphicB);
*
* // Add graphic using add()
* layer.add(graphicC);
* layer.addMany([graphicD, graphicE]);
*
* // Add graphics using push method graphics collection
* layer.graphics.push(graphic1, graphic2);
*
* // Add GraphicsLayer to map
* map.add(layer);
* ```
*
* The [MapView](https://developers.arcgis.com/javascript/latest/references/core/views/MapView/) and [SceneView](https://developers.arcgis.com/javascript/latest/references/core/views/SceneView/) each contain a
* [graphics collection](https://developers.arcgis.com/javascript/latest/references/core/views/View/#graphics) that may be used in place of a
* GraphicsLayer.
*
* @since 4.0
* @see [Sample - Add graphics (MapView)](https://developers.arcgis.com/javascript/latest/sample-code/intro-graphics/)
* @see [Sample - Add graphics (SceneView)](https://developers.arcgis.com/javascript/latest/sample-code/graphics-basic-3d/)
* @see [Graphic](https://developers.arcgis.com/javascript/latest/references/core/Graphic/)
* @see [View.graphics](https://developers.arcgis.com/javascript/latest/references/core/views/View/#graphics)
* @see [FeatureLayer](https://developers.arcgis.com/javascript/latest/references/core/layers/FeatureLayer/)
*/
export default class GraphicsLayer extends GraphicsLayerSuperclass {
constructor(properties?: GraphicsLayerProperties);
/**
* Specifies how graphics are placed on the vertical axis (z). This property may only be used
* in a [SceneView](https://developers.arcgis.com/javascript/latest/references/core/views/SceneView/). See the [ElevationInfo sample](https://developers.arcgis.com/javascript/latest/sample-code/scene-elevationinfo/)
* for an example of how this property may be used.
*
* > [!WARNING]
* >
* > If the elevation info is not specified, the effective elevation depends on the context and could vary per graphic.
*/
get elevationInfo(): ElevationInfo | null | undefined;
set elevationInfo(value: ElevationInfoProperties | null | undefined);
/**
* A collection of [graphics](https://developers.arcgis.com/javascript/latest/references/core/Graphic/) in the layer.
* Each graphic is a vector representation of the location of a
* real-world feature. Each graphic in a single GraphicsLayer may contain either a
* [Point](https://developers.arcgis.com/javascript/latest/references/core/geometry/Point/), [Polyline](https://developers.arcgis.com/javascript/latest/references/core/geometry/Polyline/), or
* [Polygon](https://developers.arcgis.com/javascript/latest/references/core/geometry/Polygon/) [Graphic.geometry](https://developers.arcgis.com/javascript/latest/references/core/Graphic/#geometry). In addition, each
* [Graphic](https://developers.arcgis.com/javascript/latest/references/core/Graphic/) in the collection
* may contain its own [Graphic.attributes](https://developers.arcgis.com/javascript/latest/references/core/Graphic/#attributes),
* [Symbol](https://developers.arcgis.com/javascript/latest/references/core/symbols/Symbol/), and [PopupTemplate](https://developers.arcgis.com/javascript/latest/references/core/PopupTemplate/).
*
* To add a graphic to the GraphicsLayer use [add()](https://developers.arcgis.com/javascript/latest/references/core/layers/GraphicsLayer/#add),
* [GraphicsLayer.graphics.add()](https://developers.arcgis.com/javascript/latest/references/core/core/Collection/#add) or [GraphicsLayer.graphics.push()](https://developers.arcgis.com/javascript/latest/references/core/core/Collection/#push).
*
* @see [Graphic](https://developers.arcgis.com/javascript/latest/references/core/Graphic/)
* @example
* // Add graphics to GraphicsLayer directly as an array
* layer.graphics = [graphicA, graphicB];
*
* // Add graphics to layer via Collection
* layer.graphics.addMany([graphicC, graphicD]);
*
* // Add graphics to layer via Collection
* layer.graphics.push(graphicC, graphicD);
*/
get graphics(): Collection<Graphic>;
set graphics(value: ReadonlyArrayOrCollection<GraphicProperties>);
/**
* Indicates whether the layer instance has loaded.
* When `true`, all the properties of the object can be accessed.
*
* @default false
*/
get loaded(): boolean;
/**
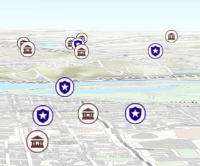
* Apply perspective scaling to screen-size symbols in a [SceneView](https://developers.arcgis.com/javascript/latest/references/core/views/SceneView/).
* When `true`, screen sized objects such as [icons](https://developers.arcgis.com/javascript/latest/references/core/symbols/IconSymbol3DLayer/),
* [labels](https://developers.arcgis.com/javascript/latest/references/core/symbols/LabelSymbol3D/) or [callouts](https://developers.arcgis.com/javascript/latest/references/core/symbols/callouts/Callout3D/) integrate
* better in the 3D scene by applying a certain perspective projection to the
* sizing of features. This only applies when using a [SceneView](https://developers.arcgis.com/javascript/latest/references/core/views/SceneView/).
*
* `layer.screenSizePerspectiveEnabled = true`
*
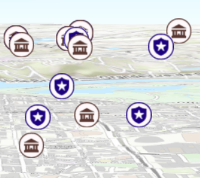
* 
*
* `layer.screenSizePerspectiveEnabled = false`
*
* 
*
* > [!WARNING]
* >
* > **Known Limitations**
* >
* > Screen size perspective is currently not optimized for situations where the camera is very near the ground, or for scenes
* > with visual elements located far from the ground surface. In these cases it may be better to turn off screen size perspective.
*
* @default true
* @since 4.4
*/
accessor screenSizePerspectiveEnabled: boolean;
/** The layer type provides a convenient way to check the type of the layer without the need to import specific layer modules. */
get type(): "graphics";
/**
* Adds a graphic to the layer's graphic collection. The [Collection.@before-changes](https://developers.arcgis.com/javascript/latest/references/core/core/Collection/#event-before-changes),
* [Collection.@before-add](https://developers.arcgis.com/javascript/latest/references/core/core/Collection/#event-before-add), [Collection.@after-add](https://developers.arcgis.com/javascript/latest/references/core/core/Collection/#event-after-add),
* [Collection.@after-changes](https://developers.arcgis.com/javascript/latest/references/core/core/Collection/#event-after-changes) and [Collection.@change](https://developers.arcgis.com/javascript/latest/references/core/core/Collection/#event-change)
* events will be emitted when this method is called.
*
* @param graphic - The graphic to add to the layer.
* @see [Collection events](https://developers.arcgis.com/javascript/latest/references/core/core/Collection/#CollectionEvents)
* @see [graphics collection's push() method](https://developers.arcgis.com/javascript/latest/references/core/core/Collection/#push)
*/
add(graphic: Graphic): this;
/**
* Adds an array of graphics to the layer. The [Collection.@before-changes](https://developers.arcgis.com/javascript/latest/references/core/core/Collection/#event-before-changes),
* [Collection.@before-add](https://developers.arcgis.com/javascript/latest/references/core/core/Collection/#event-before-add), [Collection.@after-add](https://developers.arcgis.com/javascript/latest/references/core/core/Collection/#event-after-add),
* [Collection.@after-changes](https://developers.arcgis.com/javascript/latest/references/core/core/Collection/#event-after-changes) and [Collection.@change](https://developers.arcgis.com/javascript/latest/references/core/core/Collection/#event-change)
* events will be emitted when this method is called.
*
* @param graphics - The graphic(s) to add to the layer.
* @see [Collection events](https://developers.arcgis.com/javascript/latest/references/core/core/Collection/#CollectionEvents)
* @see [graphics collection's push() method](https://developers.arcgis.com/javascript/latest/references/core/core/Collection/#push)
*/
addMany(graphics: Graphic[]): this;
/**
* Removes a graphic from the layer. The [Collection.@before-changes](https://developers.arcgis.com/javascript/latest/references/core/core/Collection/#event-before-changes),
* [Collection.@before-remove](https://developers.arcgis.com/javascript/latest/references/core/core/Collection/#event-before-remove), [Collection.@after-remove](https://developers.arcgis.com/javascript/latest/references/core/core/Collection/#event-after-remove),
* [Collection.@after-changes](https://developers.arcgis.com/javascript/latest/references/core/core/Collection/#event-after-changes) and [Collection.@change](https://developers.arcgis.com/javascript/latest/references/core/core/Collection/#event-change)
* events will be emitted when this method is called.
*
* @param graphic - The graphic to remove from the layer.
* @see [Collection events](https://developers.arcgis.com/javascript/latest/references/core/core/Collection/#CollectionEvents)
*/
remove(graphic: Graphic): void;
/**
* Clears all the graphics from the layer. The [Collection.@before-changes](https://developers.arcgis.com/javascript/latest/references/core/core/Collection/#event-before-changes),
* [Collection.@before-remove](https://developers.arcgis.com/javascript/latest/references/core/core/Collection/#event-before-remove), [Collection.@after-remove](https://developers.arcgis.com/javascript/latest/references/core/core/Collection/#event-after-remove),
* [Collection.@after-changes](https://developers.arcgis.com/javascript/latest/references/core/core/Collection/#event-after-changes) and [Collection.@change](https://developers.arcgis.com/javascript/latest/references/core/core/Collection/#event-change)
* events will be emitted when this method is called.
*
* @see [Collection events](https://developers.arcgis.com/javascript/latest/references/core/core/Collection/#CollectionEvents)
*/
removeAll(): this;
/**
* Removes an array of graphics from the layer. The [Collection.@before-changes](https://developers.arcgis.com/javascript/latest/references/core/core/Collection/#event-before-changes),
* [Collection.@before-remove](https://developers.arcgis.com/javascript/latest/references/core/core/Collection/#event-before-remove),
* [Collection.@after-remove](https://developers.arcgis.com/javascript/latest/references/core/core/Collection/#event-after-remove),
* [Collection.@after-changes](https://developers.arcgis.com/javascript/latest/references/core/core/Collection/#event-after-changes) and
* [Collection.@change](https://developers.arcgis.com/javascript/latest/references/core/core/Collection/#event-change)
* events will be emitted when this method is called.
*
* @param graphics - The graphics to remove from the layer.
* @see [Collection events](https://developers.arcgis.com/javascript/latest/references/core/core/Collection/#CollectionEvents)
*/
removeMany(graphics: readonly Graphic[]): void;
}
declare const GraphicsLayerSuperclass: typeof Layer & typeof ScaleRangeLayer & typeof BlendLayer