@arcgis/core
Version:
ArcGIS Maps SDK for JavaScript: A complete 2D and 3D mapping and data visualization API
308 lines (303 loc) • 15.5 kB
TypeScript
import type Widget from "../Widget.js";
import type { CommonSliderEvents } from "../Slider.js";
import type { InputParseFunction, InputFormatFunction, LabelFormatFunction } from "../types.js";
import type { WidgetProperties } from "../Widget.js";
import type { HistogramConfig, ZoomOptions } from "./types.js";
export interface SmartMappingSliderBaseProperties extends WidgetProperties, Partial<Pick<SmartMappingSliderBase, "histogramConfig" | "inputFormatFunction" | "inputParseFunction" | "labelFormatFunction" | "max" | "min" | "precision" | "syncedSegmentsEnabled" | "visibleElements" | "zoomOptions">> {}
export interface VisibleElements {
/**
* When `true`, displays interactive segments on the track that maintain the
* interval between two slider thumbs/handles.
*
* @default false
*/
interactiveTrack?: boolean;
}
export type SmartMappingSliderBaseState = "ready" | "disabled";
export interface SmartMappingSliderBaseEvents extends CommonSliderEvents {}
/**
* The base class for all Smart Mapping slider widgets.
*
* @deprecated since version 5.0. For information on widget deprecation, read about [Esri's move to web components](https://developers.arcgis.com/javascript/latest/components-transition-plan/).
* @since 4.12
*/
export default abstract class SmartMappingSliderBase extends Widget {
/**
* @deprecated
* Do not directly reference this property.
* Use EventNames and EventTypes helpers from \@arcgis/core/Evented
*/
"@eventTypes": SmartMappingSliderBaseEvents;
/**
* The [Histogram](https://developers.arcgis.com/javascript/latest/references/core/widgets/Histogram/) associated with the data represented on the slider. The bins are typically
* generated using the [histogram](https://developers.arcgis.com/javascript/latest/references/core/smartMapping/statistics/histogram/)
* statistics function.
*
* @see [histogram](https://developers.arcgis.com/javascript/latest/references/core/smartMapping/statistics/histogram/)
* @see [Histogram](https://developers.arcgis.com/javascript/latest/references/core/widgets/Histogram/)
* @example
* histogram({
* layer: featureLayer,
* field: "fieldName",
* numBins: 30
* }).then(function(histogramResult){
* // set the histogram to the slider
* slider.histogramConfig = {
* bins: histogramResult.bins
* };
* });
*/
accessor histogramConfig: HistogramConfig | null | undefined;
/**
* A function used to format user inputs. As opposed to [labelFormatFunction](https://developers.arcgis.com/javascript/latest/references/core/widgets/smartMapping/SmartMappingSliderBase/#labelFormatFunction), which formats
* thumb labels, the `inputFormatFunction` formats thumb values in the input element when the user begins
* to edit them.
*
* The image below demonstrates how slider input values resemble corresponding slider values by default
* and won't match the formatting set in `labelFormatFunction`.
*
* 
*
* If you want to format slider input values so they match thumb labels, you can pass the same function set in `labelFormatFunction` to
* `inputFormatFunction` for consistent formatting.
*
* 
*
* However, if an `inputFormatFunction` is specified, you must also write a corresponding
* [inputParseFunction](https://developers.arcgis.com/javascript/latest/references/core/widgets/smartMapping/SmartMappingSliderBase/#inputParseFunction) to parse user inputs to understandable slider values. In most cases, if
* you specify an `inputFormatFunction`, you should set the [labelFormatFunction](https://developers.arcgis.com/javascript/latest/references/core/widgets/smartMapping/SmartMappingSliderBase/#labelFormatFunction) to the same value
* for consistency between labels and inputs.
*
* This property overrides the default input formatter, which formats by calling `toString()` on the input value.
*
* @since 4.14
* @see [inputParseFunction](https://developers.arcgis.com/javascript/latest/references/core/widgets/smartMapping/SmartMappingSliderBase/#inputParseFunction)
* @example
* // Formats the slider input to abbreviated numbers with units
* // e.g. a thumb at position 1500 will render with an input label of 1.5k
* slider.inputFormatFunction = function(value, type){
* if(value >= 1000000){
* return (value / 1000000).toPrecision(3) + "m"
* }
* if(value >= 100000){
* return (value / 1000).toPrecision(3) + "k"
* }
* if(value >= 1000){
* return (value / 1000).toPrecision(2) + "k"
* }
* return value.toFixed(0);
* }
*/
accessor inputFormatFunction: InputFormatFunction | null | undefined;
/**
* Function used to parse slider inputs formatted by the [inputFormatFunction](https://developers.arcgis.com/javascript/latest/references/core/widgets/smartMapping/SmartMappingSliderBase/#inputFormatFunction).
* This property must be set if an `inputFormatFunction` is set. Otherwise the slider values will
* likely not update to their expected positions.
*
* Overrides the default input parses, which is a parsed floating point number.
*
* @since 4.14
* @see [inputFormatFunction](https://developers.arcgis.com/javascript/latest/references/core/widgets/smartMapping/SmartMappingSliderBase/#inputFormatFunction)
* @example
* // Parses the slider input (a string value) to a number value understandable to the slider
* // This assumes the slider was already configured with an inputFormatFunction
* // For example, if the input is 1.5k this function will parse
* // it to a value of 1500
* slider.inputParseFunction = function(value, type, index){
* let charLength = value.length;
* let valuePrefix = parseFloat(value.substring(0,charLength-1));
* let finalChar = value.substring(charLength-1);
*
* if(parseFloat(finalChar) >= 0){
* return parseFloat(value);
* }
* if(finalChar === "k"){
* return valuePrefix * 1000;
* }
* if(finalChar === "m"){
* return valuePrefix * 1000000;
* }
* return value;
* }
*/
accessor inputParseFunction: InputParseFunction | null | undefined;
/**
* A modified version of
* [Slider.labelFormatFunction](https://developers.arcgis.com/javascript/latest/references/core/widgets/Slider/#labelFormatFunction),
* which is a custom function used to format labels on the thumbs, min, max, and average
* values. Overrides the default label formatter.
* This function also supports date formatting.
*
* @example
* // For thumb values, rounds each label to whole numbers
* slider.labelFormatFunction = function(value, type) {
* return (type === "value-change") ? value.toFixed(0): value;
* }
*/
accessor labelFormatFunction: LabelFormatFunction | null | undefined;
/**
* The maximum value or upper bound of the slider. If the largest
* slider [value](https://developers.arcgis.com/javascript/latest/references/core/widgets/smartMapping/SmartMappingSliderViewModel/#values) _in the constructor_ is greater than the `max` set in
* this property, then the `max` will update to match the largest
* slider [value](https://developers.arcgis.com/javascript/latest/references/core/widgets/smartMapping/SmartMappingSliderViewModel/#values).
*
* @example slider.max = 150;
*/
accessor max: number;
/**
* The minimum value or lower bound of the slider. If the smallest
* slider [value](https://developers.arcgis.com/javascript/latest/references/core/widgets/smartMapping/SmartMappingSliderViewModel/#values) _in the constructor_ is greater than the `min` set in
* this property, then the `min` will update to match the smallest
* slider [value](https://developers.arcgis.com/javascript/latest/references/core/widgets/smartMapping/SmartMappingSliderViewModel/#values).
*
* @example slider.min = -150;
*/
accessor min: number;
/**
* Defines how slider thumb values should be rounded. This number indicates the number
* of decimal places slider thumb _values_ should round to when they have been moved.
*
* This value also indicates the precision of thumb labels when the data range
* is less than `10` (i.e. `(max - min) < 10`).
*
* When the data range is larger than `10`, labels display with a precision of
* no more than two decimal places, though actual slider thumb values will maintain the
* precision specified in this property.
*
* For example, given the default precision of `4`, and the following slider configuration,
* The labels of the thumbs will display two decimal places, but the precision of the actual
* thumb values will not be lost even when the user slides or moves the thumb.
*
* ```js
* const slider = new Slider({
* min: 20,
* max: 100, // data range of 80
* values: [50.4331],
* // thumb label will display 50.43
* // thumb value will maintain precision, so
* // value will remain at 50.4331
* container: "sliderDiv"
* });
* ```
*
* If the user manually enters a value that has a higher precision than what's indicated by
* this property, the precision of that thumb value will be maintained until the thumb
* is moved by the user. At that point, the value will be rounded according to the indicated precision.
*
* If thumb labels aren't visible, they must be enabled with labelInputsEnabled.
*
* Keep in mind this property rounds thumb [values](https://developers.arcgis.com/javascript/latest/references/core/widgets/smartMapping/SmartMappingSliderViewModel/#values) and shouldn't be used exclusively
* for formatting purposes. To format thumb `labels`, use the [labelFormatFunction](https://developers.arcgis.com/javascript/latest/references/core/widgets/smartMapping/SmartMappingSliderBase/#labelFormatFunction)
* property.
*
* @default 4
* @since 4.14
* @example slider.precision = 7;
*/
accessor precision: number;
/** The state of the view model. */
get state(): SmartMappingSliderBaseState;
/**
* When `true`, all segments will sync together in updating thumb values when the user drags any segment. This maintains the interval between all thumbs when any segment is dragged.
* Only applicable when [visibleElements.interactiveTrack](https://developers.arcgis.com/javascript/latest/references/core/widgets/smartMapping/SmartMappingSliderBase/#visibleElements) is `true`.
*
* In sliders where the primary handle is enabled, this allows you to disable handlesSyncedToPrimary to keep handle movements independent of the middle (primary) handle,
* but still provide an option for the end user to sync handles with the primary handle via slider drag events.
*
* @default false
* @since 4.20
* @see [visibleElements](https://developers.arcgis.com/javascript/latest/references/core/widgets/smartMapping/SmartMappingSliderBase/#visibleElements)
* @example
* slider.visibleElements = {
* interactiveTrack: true
* };
* slider.syncedSegmentsEnabled = true;
*/
accessor syncedSegmentsEnabled: boolean;
/**
* The visible elements that are displayed within the widget.
* This property provides the ability to turn individual elements of the widget's display on/off.
*
* @since 4.20
* @see [syncedSegmentsEnabled](https://developers.arcgis.com/javascript/latest/references/core/widgets/smartMapping/SmartMappingSliderBase/#syncedSegmentsEnabled)
* @see [segment-drag event](https://developers.arcgis.com/javascript/latest/references/core/widgets/smartMapping/SmartMappingSliderBase/#event-segment-drag)
* @example
* slider.visibleElements = {
* interactiveTrack: true
* };
* slider.syncedSegmentsEnabled = true;
*/
accessor visibleElements: VisibleElements;
/**
* Zooms the slider track to the bounds provided in this property.
* When min and/or max zoom values are provided, the absolute
* [min](https://developers.arcgis.com/javascript/latest/references/core/widgets/smartMapping/SmartMappingSliderBase/#min) and [max](https://developers.arcgis.com/javascript/latest/references/core/widgets/smartMapping/SmartMappingSliderBase/#max) slider values are preserved and
* rendered at their typical positions on the slider. However, the
* slider track itself is zoomed so that thumbs cannot be moved above or
* below the provided min and max zoomed values.
*
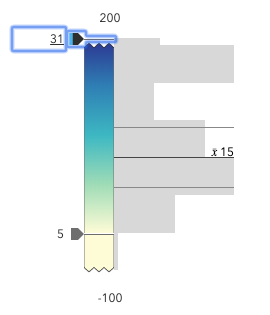
* When a slider is in a zoomed state, the zoomed
* ends of the track will appear jagged. In the image below, notice how the
* top thumb cannot be moved past the zoom max of `31` even though the slider
* max is `200`.
*
* 
*
* To exit a zoomed state, the user can click the
* jagged line or the developer can set the `zoomOptions` to `null`. It
* is up to the developer to provide a UI option for end users to
* enable zooming on the slider.
*
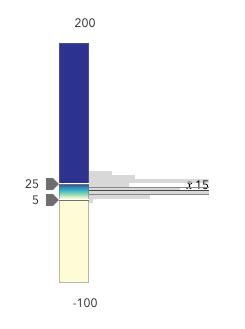
* Setting the `zoomOptions` is useful when the slider is tied to heavily skewed
* datasets where the histogram renders only one or two bars because of outliers.
*
* 
*
* You can remove the influence of outliers by zooming the slider and regenerating
* a histogram based on the zoomed min and max. This will provide a better view of the data
* and make the slider more useful to the end user.
*
* @example
* // zooms the slider to so thumbs can only be moved
* // to positions between the values of 10 and 25 while
* // maintaining the slider's absolute minimum and
* // maximum values
* slider.zoomOptions = {
* min: 10,
* max: 25
* };
* @example
* // disables zooming on the slider
* slider.zoomOptions = null;
* @example
* // zooms the slider to so thumbs can only be moved
* // to positions above the value of 10, while maintaining
* // the slider's absolute minimum value
* slider.zoomOptions = {
* min: 10
* };
* @example
* // zooms the slider to so thumbs can only be moved
* // to positions below the value of 25, while maintaining
* // the slider's absolute maximum value
* slider.zoomOptions = {
* max: 25
* };
* @example
* // zooms the slider to the handle positions
* // with some padding
* document.getElementById("zoomInButton").onclick = function() {
* const lowerThumb = slider.values[0];
* const upperThumb = slider.values[1];
*
* const range = upperThumb - lowerThumb;
* const padding = range * 0.3;
*
* const zoomMin = (lowerThumb - padding) > slider.min ? (lowerThumb - padding) : slider.min;
* const zoomMax = (upperThumb + padding) < slider.max ? (upperThumb + padding) : slider.max;
*
* slider.set({ zoomOptions: { min: zoomMin, max: zoomMax } });
* };
*/
accessor zoomOptions: ZoomOptions | null | undefined;
}