@arcgis/core
Version:
ArcGIS Maps SDK for JavaScript: A complete 2D and 3D mapping and data visualization API
170 lines (168 loc) • 8.01 kB
TypeScript
import type HeatmapColorStop from "../../renderers/support/HeatmapColorStop.js";
import type SmartMappingSliderBase from "./SmartMappingSliderBase.js";
import type HeatmapSliderViewModel from "./HeatmapSlider/HeatmapSliderViewModel.js";
import type { HeatmapRendererResult } from "../../smartMapping/renderers/heatmap.js";
import type { SmartMappingSliderBaseProperties } from "./SmartMappingSliderBase.js";
import type { HeatmapSliderViewModelProperties } from "./HeatmapSlider/HeatmapSliderViewModel.js";
export interface HeatmapSliderProperties extends SmartMappingSliderBaseProperties, Partial<Pick<HeatmapSlider, "stops">> {
/**
* The HeatmapSlider widget's default label.
*
* @since 4.11
*/
label?: string | null;
/**
* The view model for the Heatmap widget. This class contains all the logic
* (properties and methods) that controls this widget's behavior. See the
* [HeatmapSliderViewModel](https://developers.arcgis.com/javascript/latest/references/core/widgets/smartMapping/HeatmapSlider/HeatmapSliderViewModel/)
* class to access all properties and methods on the HeatmapSlider widget.
*/
viewModel?: HeatmapSliderViewModelProperties;
}
/**
* The HeatmapSlider widget is intended for authoring and exploring data-driven visualizations in any
* layer that can be rendered with a [HeatmapRenderer](https://developers.arcgis.com/javascript/latest/references/core/renderers/HeatmapRenderer/).
* At a minimum you must set the [stops](https://developers.arcgis.com/javascript/latest/references/core/widgets/smartMapping/HeatmapSlider/#stops) property
* of the widget. The stops are used to render a color gradient on the track of the slider.
*
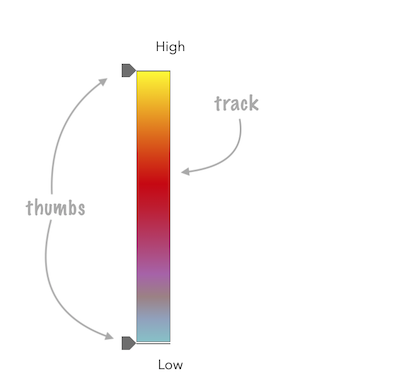
* <span id="image-annotations"></span>
* See the image below for a summary of the configurable options available on this slider.
*
* 
*
* The [fromHeatmapRendererResult()](https://developers.arcgis.com/javascript/latest/references/core/widgets/smartMapping/HeatmapSlider/#fromHeatmapRendererResult) method can be used to conveniently create this slider
* from the result of the [createRenderer()](https://developers.arcgis.com/javascript/latest/references/core/smartMapping/renderers/heatmap/#createRenderer)
* method.
*
* ```js
* const params = {
* layer: layer,
* basemap: map.basemap,
* view: view
* };
*
* let rendererResult = null;
*
* heatmapRendererCreator
* .createRenderer(params)
* .then(function(response) {
* rendererResult = response;
* layer.renderer = response.renderer;
*
* const slider = slider.fromRendererResult(rendererResult);
* colorSlider.container = "slider";
* })
* .catch(function(error) {
* console.log("there was an error: ", error);
* });
* ```
*
* This slider should be used to update the [HeatmapRenderer.colorStops](https://developers.arcgis.com/javascript/latest/references/core/renderers/HeatmapRenderer/#colorStops)
* in a HeatmapRenderer. It is the responsibility of the app developer
* to set up event listeners on this slider to update the renderer's color stops.
*
* ```js
* // when the user slides the handle(s), update the renderer
* // with the updated color stops
*
* slider.on(["thumb-change", "thumb-drag"], function() {
* const renderer = layer.renderer.clone();
* renderer.colorStops = slider.stops;
* layer.renderer = renderer;
* });
* ```
*
* @deprecated since version 5.0. Use the [Slider Heatmap](https://developers.arcgis.com/javascript/latest/references/map-components/components/arcgis-slider-heatmap-legacy/) component instead. For information on widget deprecation, read about [Esri's move to web components](https://developers.arcgis.com/javascript/latest/components-transition-plan/).
* @since 4.12
* @see [HeatmapSliderViewModel](https://developers.arcgis.com/javascript/latest/references/core/widgets/smartMapping/HeatmapSlider/HeatmapSliderViewModel/)
* @see [heatmapRendererCreator](https://developers.arcgis.com/javascript/latest/references/core/smartMapping/renderers/heatmap/)
*/
export default class HeatmapSlider extends SmartMappingSliderBase {
/**
* A convenience function used to create a HeatmapSlider widget instance from the
* [result](https://developers.arcgis.com/javascript/latest/references/core/smartMapping/renderers/heatmap/#HeatmapRendererResult) of
* the [heatmapRendererCreator.createRenderer()](https://developers.arcgis.com/javascript/latest/references/core/smartMapping/renderers/heatmap/#createRenderer)
* method.
*
* @param rendererResult - The result object from the [heatmapRendererCreator.createRenderer()](https://developers.arcgis.com/javascript/latest/references/core/smartMapping/renderers/heatmap/#createRenderer)
* method.
* @returns Returns a HeatmapSlider instance. This will not render until you assign
* it a valid [container](https://developers.arcgis.com/javascript/latest/references/core/widgets/smartMapping/HeatmapSlider/#container).
* @example
* let params = {
* layer: layer,
* basemap: map.basemap,
* field: "POP",
* view: view
* };
* heatmapRendererCreator
* .createRenderer(params)
* .then(function(response) {
* // set generated renderer on the layer and add it to the map
* rendererResult = response;
* layer.renderer = response.renderer;
*
* let slider = HeatmapSlider.fromHeatmapRendererResult(response);
* slider.container = "slider";
* });
*/
static fromHeatmapRendererResult(rendererResult: HeatmapRendererResult): HeatmapSlider;
/**
* @example
* const slider = new HeatmapSlider({
* stops: [
* { color: "rgba(63, 40, 102, 0)", ratio: 0 },
* { color: "#472b77", ratio: 0.083 },
* { color: "#4e2d87", ratio: 0.166 },
* { color: "#563098", ratio: 0.249 },
* { color: "#5d32a8", ratio: 0.332 },
* { color: "#6735be", ratio: 0.415 },
* { color: "#7139d4", ratio: 0.498 },
* { color: "#7b3ce9", ratio: 0.581 },
* { color: "#853fff", ratio: 0.664 },
* { color: "#a46fbf", ratio: 0.747 },
* { color: "#c29f80", ratio: 0.83 },
* { color: "#e0cf40", ratio: 0.913 },
* { color: "#ffff00", ratio: 1 }
* ]
* });
*/
constructor(properties?: HeatmapSliderProperties);
/**
* The HeatmapSlider widget's default label.
*
* @since 4.11
*/
get label(): string;
set label(value: string | null | undefined);
/**
* The color stops of the [HeatmapRenderer](https://developers.arcgis.com/javascript/latest/references/core/renderers/HeatmapRenderer/) to associate with the slider.
*
* @example
* slider.stops = [
* { color: "rgba(63, 40, 102, 0)", ratio: 0 },
* { color: "#472b77", ratio: 0.083 },
* { color: "#4e2d87", ratio: 0.166 },
* { color: "#563098", ratio: 0.249 },
* { color: "#5d32a8", ratio: 0.332 },
* { color: "#6735be", ratio: 0.415 },
* { color: "#7139d4", ratio: 0.498 },
* { color: "#7b3ce9", ratio: 0.581 },
* { color: "#853fff", ratio: 0.664 },
* { color: "#a46fbf", ratio: 0.747 },
* { color: "#c29f80", ratio: 0.83 },
* { color: "#e0cf40", ratio: 0.913 },
* { color: "#ffff00", ratio: 1 }
* ];
* @example slider.stops = layer.renderer.colorStops;
*/
accessor stops: HeatmapColorStop[];
/**
* The view model for the Heatmap widget. This class contains all the logic
* (properties and methods) that controls this widget's behavior. See the
* [HeatmapSliderViewModel](https://developers.arcgis.com/javascript/latest/references/core/widgets/smartMapping/HeatmapSlider/HeatmapSliderViewModel/)
* class to access all properties and methods on the HeatmapSlider widget.
*/
get viewModel(): HeatmapSliderViewModel;
set viewModel(value: HeatmapSliderViewModelProperties);
}