@arcgis/core
Version:
ArcGIS Maps SDK for JavaScript: A complete 2D and 3D mapping and data visualization API
125 lines (122 loc) • 7.87 kB
TypeScript
import type BarChartMediaInfo from "./BarChartMediaInfo.js";
import type ColumnChartMediaInfo from "./ColumnChartMediaInfo.js";
import type BaseContent from "./Content.js";
import type ImageMediaInfo from "./ImageMediaInfo.js";
import type LineChartMediaInfo from "./LineChartMediaInfo.js";
import type PieChartMediaInfo from "./PieChartMediaInfo.js";
import type { PieChartMediaInfoProperties } from "./PieChartMediaInfo.js";
import type { LineChartMediaInfoProperties } from "./LineChartMediaInfo.js";
import type { ImageMediaInfoProperties } from "./ImageMediaInfo.js";
import type { ColumnChartMediaInfoProperties } from "./ColumnChartMediaInfo.js";
import type { BarChartMediaInfoProperties } from "./BarChartMediaInfo.js";
import type { ContentProperties as BaseContentProperties } from "./Content.js";
export interface MediaContentProperties extends BaseContentProperties, Partial<Pick<MediaContent, "activeMediaInfoIndex" | "description" | "title">> {
/**
* Contains the media elements representing images or charts to display
* within the [PopupTemplate](https://developers.arcgis.com/javascript/latest/references/core/PopupTemplate/). This can be an individual
* chart or image element, or an array containing a combination of any of
* these types.
*/
mediaInfos?: ((BarChartMediaInfoProperties & { type: "bar-chart" }) | (ColumnChartMediaInfoProperties & { type: "column-chart" }) | (ImageMediaInfoProperties & { type: "image" }) | (LineChartMediaInfoProperties & { type: "line-chart" }) | (PieChartMediaInfoProperties & { type: "pie-chart" }))[] | null;
}
/** @since 5.0 */
export type PopupContentMediaInfoUnion = BarChartMediaInfo | ColumnChartMediaInfo | ImageMediaInfo | LineChartMediaInfo | PieChartMediaInfo;
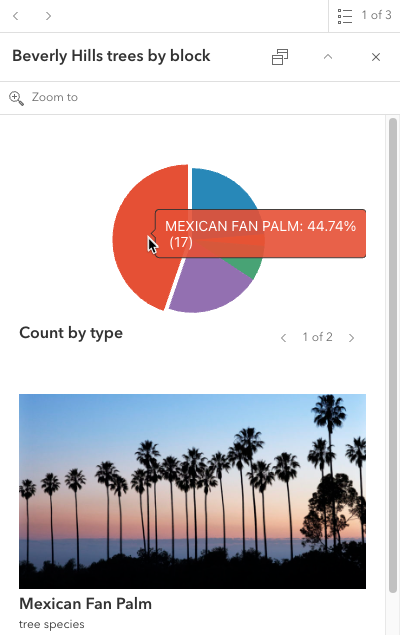
/**
* A `MediaContent` popup element contains an individual or array of chart and/or image media elements
* to display within a popup's content.
*
* Chart colors automatically respect renderer colors when visualizing data with the [predominance](https://developers.arcgis.com/javascript/latest/references/core/smartMapping/symbology/predominance/),
* [dot density](https://developers.arcgis.com/javascript/latest/references/core/renderers/DotDensityRenderer/), and [pie chart](https://developers.arcgis.com/javascript/latest/references/core/renderers/PieChartRenderer/) renderers.
* [Binning](https://developers.arcgis.com/javascript/latest/references/core/layers/support/FeatureReductionBinning/) and [clustering](https://developers.arcgis.com/javascript/latest/references/core/layers/support/FeatureReductionCluster/) popup charts are also based on the renderer colors.
* However, popup charts only respect the colors from the [pie chart](https://developers.arcgis.com/javascript/latest/references/core/renderers/PieChartRenderer/) renderer when clustering is configured.
*
* 
*
* @since 4.11
* @see [PopupTemplate](https://developers.arcgis.com/javascript/latest/references/core/PopupTemplate/)
* @see [BarChartMediaInfo](https://developers.arcgis.com/javascript/latest/references/core/popup/content/BarChartMediaInfo/)
* @see [ColumnChartMediaInfo](https://developers.arcgis.com/javascript/latest/references/core/popup/content/ColumnChartMediaInfo/)
* @see [LineChartMediaInfo](https://developers.arcgis.com/javascript/latest/references/core/popup/content/LineChartMediaInfo/)
* @see [PieChartMediaInfo](https://developers.arcgis.com/javascript/latest/references/core/popup/content/PieChartMediaInfo/)
* @see [ImageMediaInfo](https://developers.arcgis.com/javascript/latest/references/core/popup/content/ImageMediaInfo/)
* @see [Sample - Intro to PopupTemplate](https://developers.arcgis.com/javascript/latest/sample-code/intro-popuptemplate/)
* @see [Sample - Multiple popup elements](https://developers.arcgis.com/javascript/latest/sample-code/popup-multipleelements/)
* @see [Sample - Pie charts](https://developers.arcgis.com/javascript/latest/sample-code/visualization-pie-chart/)
* @example
* layer.popupTemplate.content = [{
* // The following creates a piechart in addition to an image. The chart is
* // also set up to work with related tables.
* // Autocasts as new MediaContent()
* type: "media",
* activeMediaInfoIndex: 1,
* // Autocasts as array of MediaInfo objects
* mediaInfos: [{
* title: "<b>Count by type</b>",
* type: "pie-chart", // autocasts as new PieChartMediaInfo
* // Autocasts as new ChartMediaInfoValue object
* value: {
* fields: ["relationships/0/Point_Count_COMMON"],
* normalizeField: null,
* tooltipField: "relationships/0/COMMON"
* }
* }, {
* title: "<b>Mexican Fan Palm</b>",
* type: "image", // Autocasts as new ImageMediaInfo object
* caption: "tree species",
* // Autocasts as new ImageMediaInfoValue object
* value: {
* sourceURL: "https://www.sunset.com/wp-content/uploads/96006df453533f4c982212b8cc7882f5-800x0-c-default.jpg"
* }
* }]
* }];
*/
export default class MediaContent extends BaseContent {
constructor(properties?: MediaContentProperties);
/**
* Index of the current active media within the popup's media content. This will be the media
* that is currently viewed when displayed.
*
* @since 4.19
*/
accessor activeMediaInfoIndex: number | null | undefined;
/**
* Describes the media's content in detail. Starting at version 4.30, the `description` supports rendering HTML.
*
* @since 4.19
*/
accessor description: string | null | undefined;
/**
* Contains the media elements representing images or charts to display
* within the [PopupTemplate](https://developers.arcgis.com/javascript/latest/references/core/PopupTemplate/). This can be an individual
* chart or image element, or an array containing a combination of any of
* these types.
*/
get mediaInfos(): PopupContentMediaInfoUnion[] | null | undefined;
set mediaInfos(value: ((BarChartMediaInfoProperties & { type: "bar-chart" }) | (ColumnChartMediaInfoProperties & { type: "column-chart" }) | (ImageMediaInfoProperties & { type: "image" }) | (LineChartMediaInfoProperties & { type: "line-chart" }) | (PieChartMediaInfoProperties & { type: "pie-chart" }))[] | null | undefined);
/**
* Heading indicating what the media's content represents. Starting at version 4.30, the `title` supports rendering HTML.
*
* @since 4.19
*/
accessor title: string | null | undefined;
/**
* The type of popup element displayed.
*
* @default "media"
* @see [TextContent](https://developers.arcgis.com/javascript/latest/references/core/popup/content/TextContent/)
* @see [FieldsContent](https://developers.arcgis.com/javascript/latest/references/core/popup/content/FieldsContent/)
* @see [MediaContent](https://developers.arcgis.com/javascript/latest/references/core/popup/content/MediaContent/)
* @see [AttachmentsContent](https://developers.arcgis.com/javascript/latest/references/core/popup/content/AttachmentsContent/)
* @see [CustomContent](https://developers.arcgis.com/javascript/latest/references/core/popup/content/CustomContent/)
* @see [ExpressionContent](https://developers.arcgis.com/javascript/latest/references/core/popup/content/ExpressionContent/)
* @see [RelationshipContent](https://developers.arcgis.com/javascript/latest/references/core/popup/content/RelationshipContent/)
* @see [UtilityNetworkAssociationsContent](https://developers.arcgis.com/javascript/latest/references/core/popup/content/UtilityNetworkAssociationsContent/)
*/
get type(): "media";
/**
* Creates a deep clone of the MediaContent class.
*
* @returns A deep clone of the MediaContent instance.
*/
clone(): MediaContent;
}